Abstract
The marginal shell of the anteroventral cochlear nucleus houses small cells that are distinct from the overlying microneurons of the granule cell domain and the underlying projection neurons of the magnocellular core. This thin shell of small cells and associated neuropil receives auditory nerve input from only the low (<18 s/s) spontaneous rate (SR), high threshold auditory nerve fibers; high SR, low threshold fibers do not project there. It should be noted, however, that most of these auditory nerve terminations reside in the neuropil and intermix with dendrites that originate outside the shell. Consequently, electron microscopy is necessary to determine the synaptic targets. For this report, the terminations of intracellularly labeled low SR auditory nerve fibers in the small cell cap were mapped through serial sections using a light microscope. The terminals were then examined with an electron microscope and found to form synapses with the somata and dendrites of small cells. Moreover, the small cell dendrites were identifiable by an abundance of microtubules and the presence of polyribosomes that were free or associated with membraneous cisterns. These data contribute to the concept of a high threshold feedback circuit to the inner ear, and reveal translational machinery for local control of activity-dependent synaptic modification.
Keywords: dendrite, hearing, olivocochlear feedback circuit, synapse
Introduction
The cochlear nucleus is not a homogenous structure. Large neurons that reside in the central core of the nucleus can be classified into distinct groupings on the basis of cytoplasmic and dendritic features (Osen, 1969; Brawer et al., 1974; Lorente de Nó, 1981), separate physiological properties (Pfeiffer, 1966; Evans and Nelson, 1973; Young and Brownell, 1976; Young et al., 1988; Blackburn and Sachs, 1989), and different projection targets (Roth et al., 1978; Adams, 1979; Glendenning et al., 1981; Warr, 1982; Ryugo and Willard, 1985; Schofield, 1995; Schofield and Cant, 1996a, b; Alibardi, 1998, 1999, 2000, 2001). In addition, there is a peripheral shell of microneurons that forms a superficial layer over the dorsal, medial and lateral surface of the ventral cochlear nucleus (VCN) and penetrates the dorsal cochlear nucleus (DCN) to help form layer II (Mugnaini et al., 1980a, b; Weedman and Ryugo, 1996). The microneurons of the superficial shell form the granule cell domain (GCD) and participate in local circuit connections with the large neurons of the DCN (Mugnaini et al., 1980a, b; Manis, 1989; Weedman et al., 1996). Squeezed between these two domains lies a thin cap of small cells (Osen, 1969; Cant, 1993).
The sheet of small cells that surrounds the peripheral margins of the VCN was named the peripheral cap of small cells (Osen, 1969). The resident cells have small to medium sized somata that exhibit a variety of shapes; some are roundish, others are oval or fusiform, and still others are distinctly polygonal. These cells give rise to dendrites that can be smooth or spiny (Cant, 1993), but the neuropil also contains dendrites from magnocellular projection neurons that pass through the small cell zone to enter the granule cell domain (Oertel et al., 1990; Cant, 1993; Benson et al., 1996; Schofield and Cant, 1996a; Doucet and Ryugo, 1997). The GCD is devoid of myelinated fibers, whereas the small cell cap (SCC) is distinguished by the presence of thin myelinated fibers that run orthogonally to the heavily myelinated ascending and descending auditory nerve fibers in the magnocellular part of the nucleus. These thin myelinated fibers represent, at least in part, collaterals from low spontaneous rate (SR) fibers that provide the only auditory nerve input to this region (Liberman, 1991). Light microscopic analysis indicated that although a few endings of low SR fibers were in close apposition to the cell bodies of small cells, most of the endings were in the neuropil. Consequently, the synaptic targets for this projection remain to be determined. This question about synaptic targets is important because the region has been shown to project to olivocochlear neurons that modulate the output of the cochlea (Ye et al., 2000). It is also the region that receives collateral projections from medial olivocochlear efferents (Liberman and Brown, 1986; Brown et al., 1988; Benson et al., 1996). In order to have a more complete understanding of efferent mechanisms, it is necessary to determine whether the components of this high threshold feedback pathway selectively involve the population of small cells or more generally include cells whose dendrites encroach into the terminal zone.
Myelinated auditory nerve fibers were labeled with horseradish peroxidase (HRP) that was intracellularly injected following electrophysiological characterization of frequency sensitivity, threshold, and spontaneous discharge rate. After histological processing, individual stained fibers were reconstructed using a light microscope and drawing tube, analyzed, and then studied with an electron microscope. In this study, we tested the hypothesis that the low spontaneous, high threshold auditory nerve fibers make synapses with small cells of the cap and not with dendrites of magnocellular projection neurons.
Experimental Procedures
Subjects
A total of 10 healthy cats, each weighing between 1.5 and 4 kg, were used in this study. Eight animals were anesthetized (0.4 cc/kg body weight) with diallyl barbituric acid (100 mg/ml) in urethane solution (400 mg/ml) and prepared surgically for auditory nerve recordings as described previously (Liberman 1982a,b; Sento and Ryugo, 1989). Two animals were used for normal light microscopic cytoarchitecture analysis and electron microscopic cell typing. All procedures were performed in accordance with NIH guidelines and approved by the Animal Care and Use Committee of the Johns Hopkins University.
Surgery and Recordings
Briefly, the trachea was cannulated, an indwelling catheter inserted into the cephalic vein for administration of fluids, and the skin and muscle layers overlying the skull removed. The bulla was opened to allow for round window recordings and the external meati were cut near the tympanic ring in order to insert hollow ear bars for delivering calibrated acoustic stimuli (Kiang et al., 1965; Sokolich, 1977). The posterior fossa was opened using rongeurs, the dura reflected over the cerebellum, and the cerebellum retracted to expose the auditory nerve as it extended from the internal auditory meatus to the cochlear nucleus. N1 potentials to 100 µsec, 4V peak-to-peak clicks were recorded to confirm that the cats had normal hearing thresholds (always less than 5 dB SPL).
Recording micropipettes were placed into the auditory nerve under direct visual control using an operating microscope. For each unit, a threshold tuning curve and a 10-sec period of spontaneous activity were obtained before and after injection of HRP. The similarity of pre- and post-injection response properties and a continuously negative DC potential provided evidence that the injected fiber was the same one from which recordings were obtained. An automated tuning curve maker (using parameters of Liberman, 1982b) was used to determine the fiber’s characteristic frequency (CF, that frequency to which it is most sensitive). Individual fibers were marked by iontophoresing a 10% HRP solution in 0.05 M Tris buffer (pH 7.3) containing 0.15 M KCl through micropipettes having impedances of 24 – 34 MΩ. Unambiguous recovery was facilitated by injecting only a single fiber per nerve, or injecting fibers whose characteristic frequencies were at least 10 kHz apart.
Histology
Approximately 24 hrs after the last fiber was injected, the cat was given a lethal dose of Nembutal and perfused through the heart with 25 cc isotonic saline (25°C) with 0.1% NaNO2 in 0.12 M cacodylate buffer (pH 7.4), followed immediately by 1.5 L of fixative containing 2% paraformaldehyde, 2% glutaraldehyde, and 0.008% CaCl2 in 0.12 M cacodylate buffer (pH 7.4). Following perfusion, the brain was dissected from the skull, and then the brain stem isolated and stored overnight in the same fixative. The next morning, each cochlear nucleus was embedded in a gelatin-albumin mixture hardened with glutaraldehyde so that 50–75 µm-thick Vibratome sections could be collected approximately parallel to the lateral surface of the nucleus. Sections were kept in serial order, rinsed several times in 0.1 M Tris buffer (pH 7.5), and processed using standard procedures with 0.05% 3,3′-diaminobenzidine (DAB, Sigma, grade II Tetra HCl) in phosphate buffer containing 0.01% H2O2. Sections were placed in 1% OsO4 for 15 min, rinsed in 0.1 M maleate buffer, pH 5.0, stained en bloc overnight in 1% uranyl acetate, dehydrated in a series of graded alcohol concentrations, and embedded in Epon between Aclar sheets (Polysciences). Once the Epon hardened, sections were taped to microscope slides and examined with the aid of a light microscope.
Data Analysis
The outlines of the somata and nuclei of small cells (50 cells per cat) were drawn at x1250 using a 100x objective and drawing tube. The long and short axis of each cell and silhouette area of cell body and nucleus were calculated using ImageJ. ImageJ is a public domain, Java-based image processing program developed at the National Institutes of Health (available at: http://rsb.info.nih.gov/ij/download.html). Labeled fibers were drawn at a total magnification of 250x and 1250x with the aid of a light microscope and drawing tube. The drawn fiber segments were aligned across serial sections to produce a two dimensional reconstruction of the entire fiber that was mapped onto the cochlear nucleus. Special attention was given to those collaterals that arborized into the region of the small cell cap. Terminal arbors were identified and then cut from the Epon-embedded tissue, re-embedded in a BEEM capsule, and prepared for thin sectioning for electron microscopic analysis. Images were altered only in brightness and contrast except in figure 4A where the fiber was pieced together across multiple focal planes and the out-of-focus backgrounds were erased.
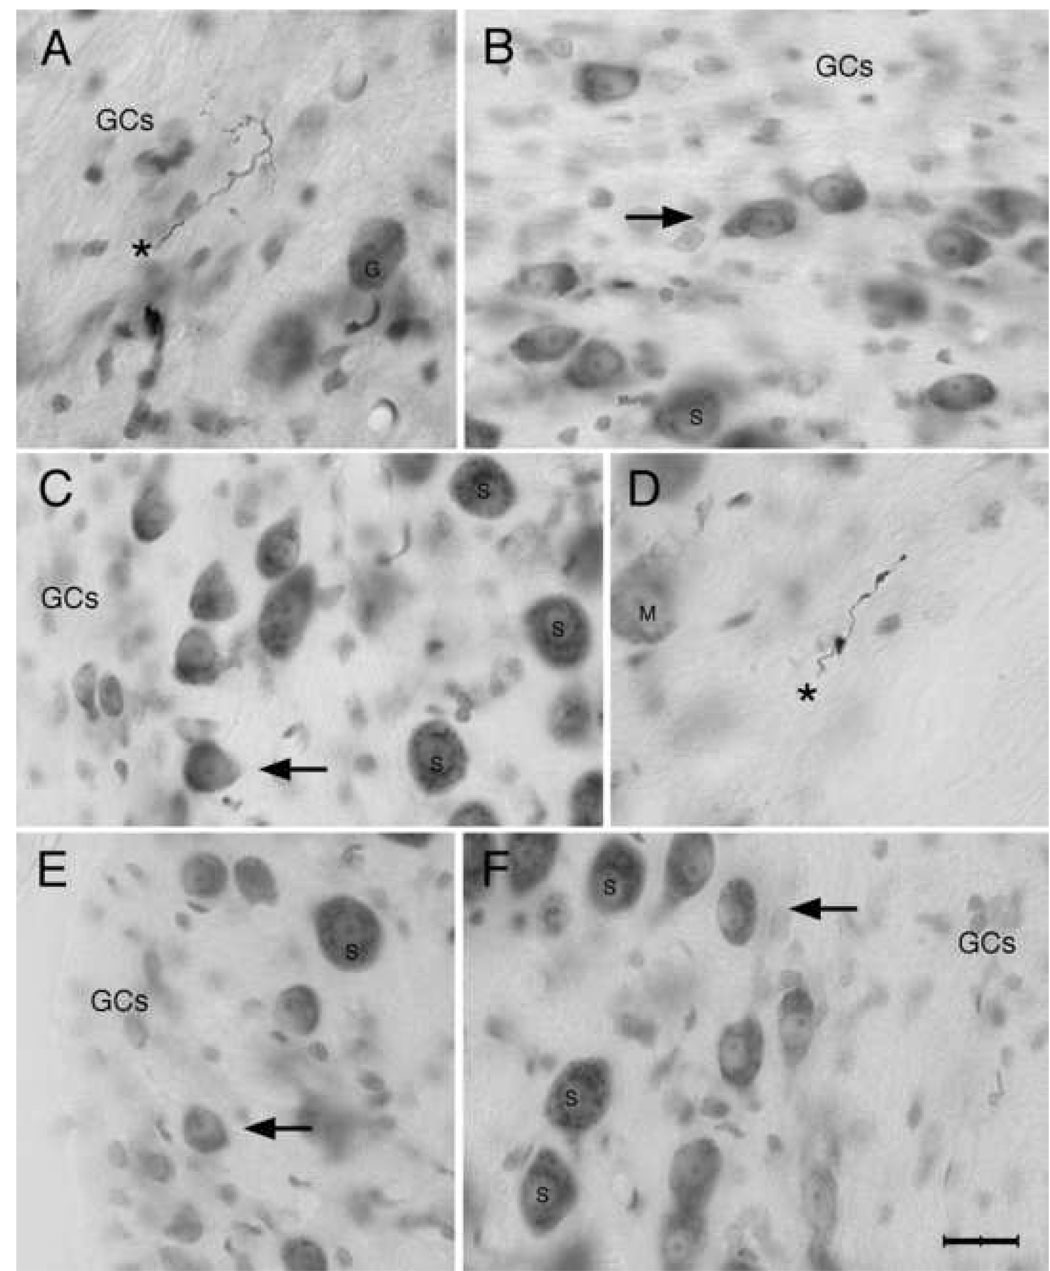
Figure 4.
Photomicrographs of HRP-labeled collaterals from low SR auditory nerve fibers (A, D asterisks) and small cells of the cap stained with cresyl violet. Note that the labeled fibers are thin and the swellings are small (A, CF=0.17 kHz, SR=0.06 s/s, Th=26 dB SPL; D, CF=2.8 kHz, SR=1.6 s/s, Th=29 dB SPL). The fiber in A was montaged and pieced together across multiple focal planes. The small cells (arrows, B, C, E, F) have a qualitatively similar appearance in addition to their small size. They have a pale, round, and slightly eccentric nucleus with a prominent nuclear envelope. Even though they vary somewhat in size and shape, the cytoplasm and nucleus have a homogenous appearance across the population. These cells were selected from different locations around the cochlear nucleus. Clockwise: (A) dorsolateral, (B) dorsal, (D) dorsomedial, (F) medial; (E) ventrolateral, and (C) middle lateral. Abbreviations: GCs, granule cells; G, globular bushy cell; M, multipolar cell; S, spherical bushy cell. Scale bar equals 20 µm.
In order to classify terminals, we analyzed 50 terminals with respect to symmetry or asymmetry of the postsynaptic density and we drew every synaptic vesicle characterized as a “ring” of membrane that enclosed a clear lumen with a diameter less than 75 nm. Vesicles were filled and analyzed using ImageJ software, and vesicle area was plotted against circularity. Means and standard deviations are provided when appropriate. The three types of endings in this report were classified (e.g., large round, small round, and flattened) on the basis of their distinctly different distributions.
Results
The present results are based on analysis of nine intracellularly characterized and stained auditory nerve fibers from eight different cats (Table 1). Data from different parts of six fibers have been used in publications unrelated to this report (Liberman 1982a; Fekete et al., 1984; Rouiller et al., 1986; Ryugo and Rouiller, 1988; Sento and Ryugo, 1989; Ryugo and May, 1993). Individual fibers entered the cochlear nucleus upon passing the Schwann-glia border, traveled a variable distance depending upon their CF, and bifurcated. The bifurcation gave rise to an ascending branch and a descending branch (Fig. 1). The spatial location of these branches was related to fiber CF and defined a strict tonotopic organization. The ascending branch proceeded through the anteroventral cochlear nucleus (AVCN), emitting as many as 10 short collaterals. The descending branches of auditory nerve fibers, regardless of their physiological properties, were indistinguishable as they passed through the posteroventral cochlear nucleus (PVCN). They dropped off short collaterals, and usually (but not always) entered the DCN where they terminated in narrow isofrequency contours in layers III and the deep part of layer II (Liberman, 1993; Ryugo and May, 1993) in a manner consistent with Golgi staining and degeneration results (Sando, 1965; Lorente de Nó, 1981; Osen, 1970).
Table 1.
Auditory nerve fibers in terms of CF, SR and threshold:
| Appearance | CF | SR | Threshold |
|---|---|---|---|
| Figure 1 | 1.20 kHz | 86 s/s | −3 dB SPL |
| Figure 1, 7A, 7B | 3.10 kHz | 0.2 s/s | 26 dB SPL |
| Figure 2A | 1.20 kHz | 1.0 s/s | 4 dB SPL |
| Figure 2B | 1.85 kHz | 0.0 s/s | 50 dB SPL |
| Figure 2C | 0.3 kHz | 0.1 s/s | 39 dB SPL |
| Figure 3, 7C, 7E | 0.45 kHz | 1.2 s/s | 34 dB SPL |
| Figure 4A | 0.17 kHz | 0.06 s/s | 26 dB SPL |
| Figure 4D | 2.80 kHz | 1.6 s/s | 29 dB SPL |
| Figure 6, 7D | 0.78 kHz | 6.33 s/s | 20 dB SPL |
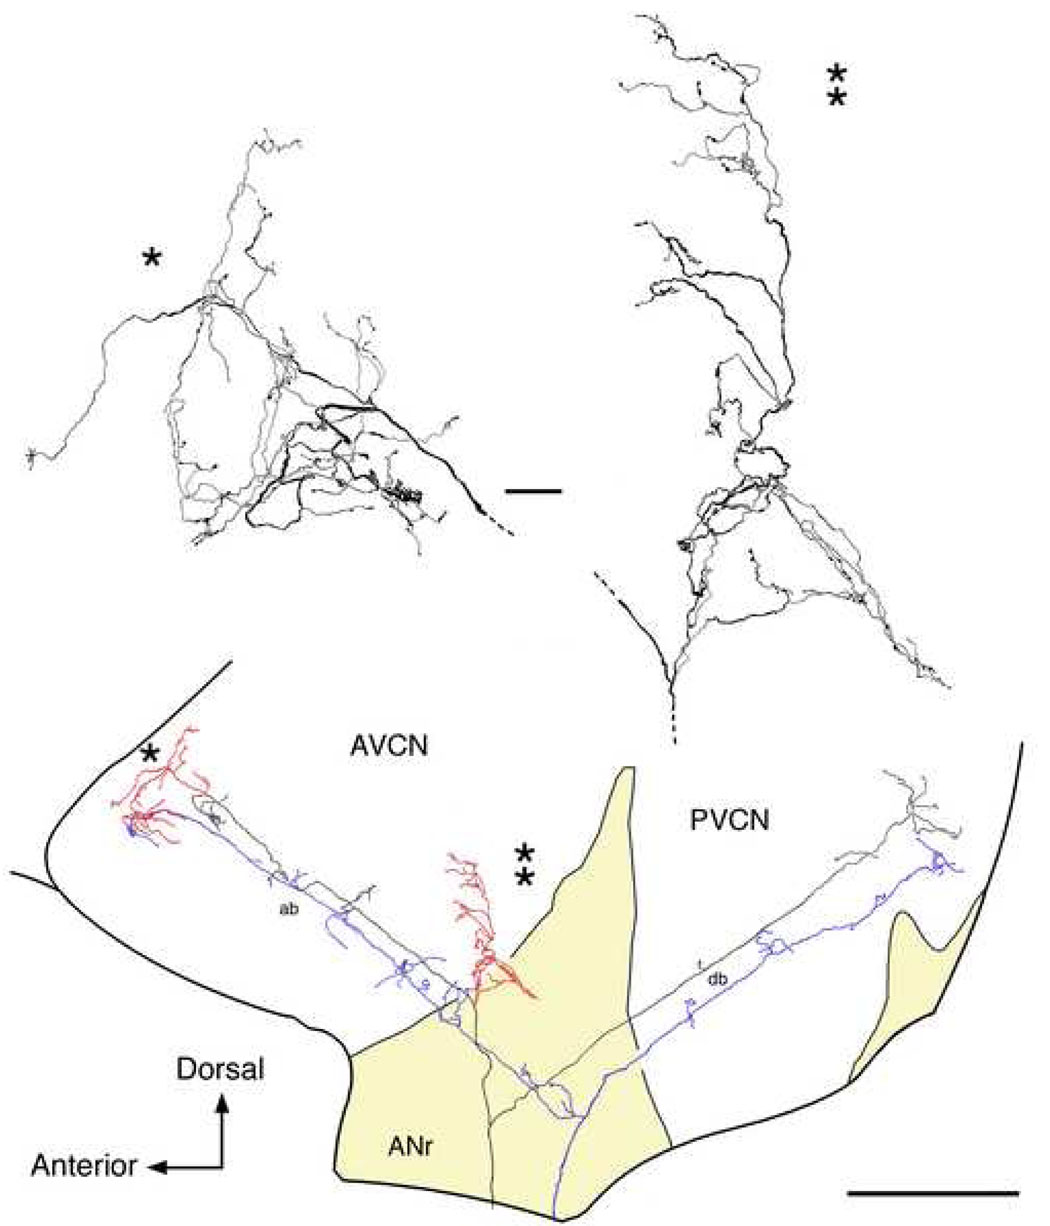
Figure 1.
Drawing tube reconstructions of a low SR auditory nerve fiber (black and red, CF=3.1 kHz; SR=0.2 s/s; Th=26 dB SPL) and a high SR auditory nerve fiber (blue, CF=1.2 kHz, SR=86 s/s; Th= −3 dB) as viewed laterally. These fibers are from separate cats but are shown together to illustrate the differences in branching patterns. Their placement in the nucleus is based on tonotopic maps of the fibers (Ryugo and May, 1993; Ryugo and Parks, 2003) and cochlear nucleus (Bourk et al., 1981). The ascending branches take a relatively straight trajectory through the AVCN. Low SR fibers are distinctive by the collaterals that arborize within the small cell cap (red). Otherwise, the main parts of the ascending and descending branches are similar for the different SR fiber types (black, low SR; blue, high SR). Higher magnification drawings are shown for each collateral. One collateral ramifies anterior to the endbulb (*), whereas the other ramifies laterally (**). The ascending branch has been modified from Fig. 15 of Fekete et al., 1984 in order to show details of the collateral branching. Abbreviations: ab, ascending branch; ANr, auditory nerve root; AVCN, anteroventral cochlear nucleus; db, descending branch; PVCN, posteroventral cochlear nucleus. The scale bar equals 25 µm for the high magnification collateral drawings (top) and 0.5 mm for the orientation drawing (bottom).
Low SR Collaterals
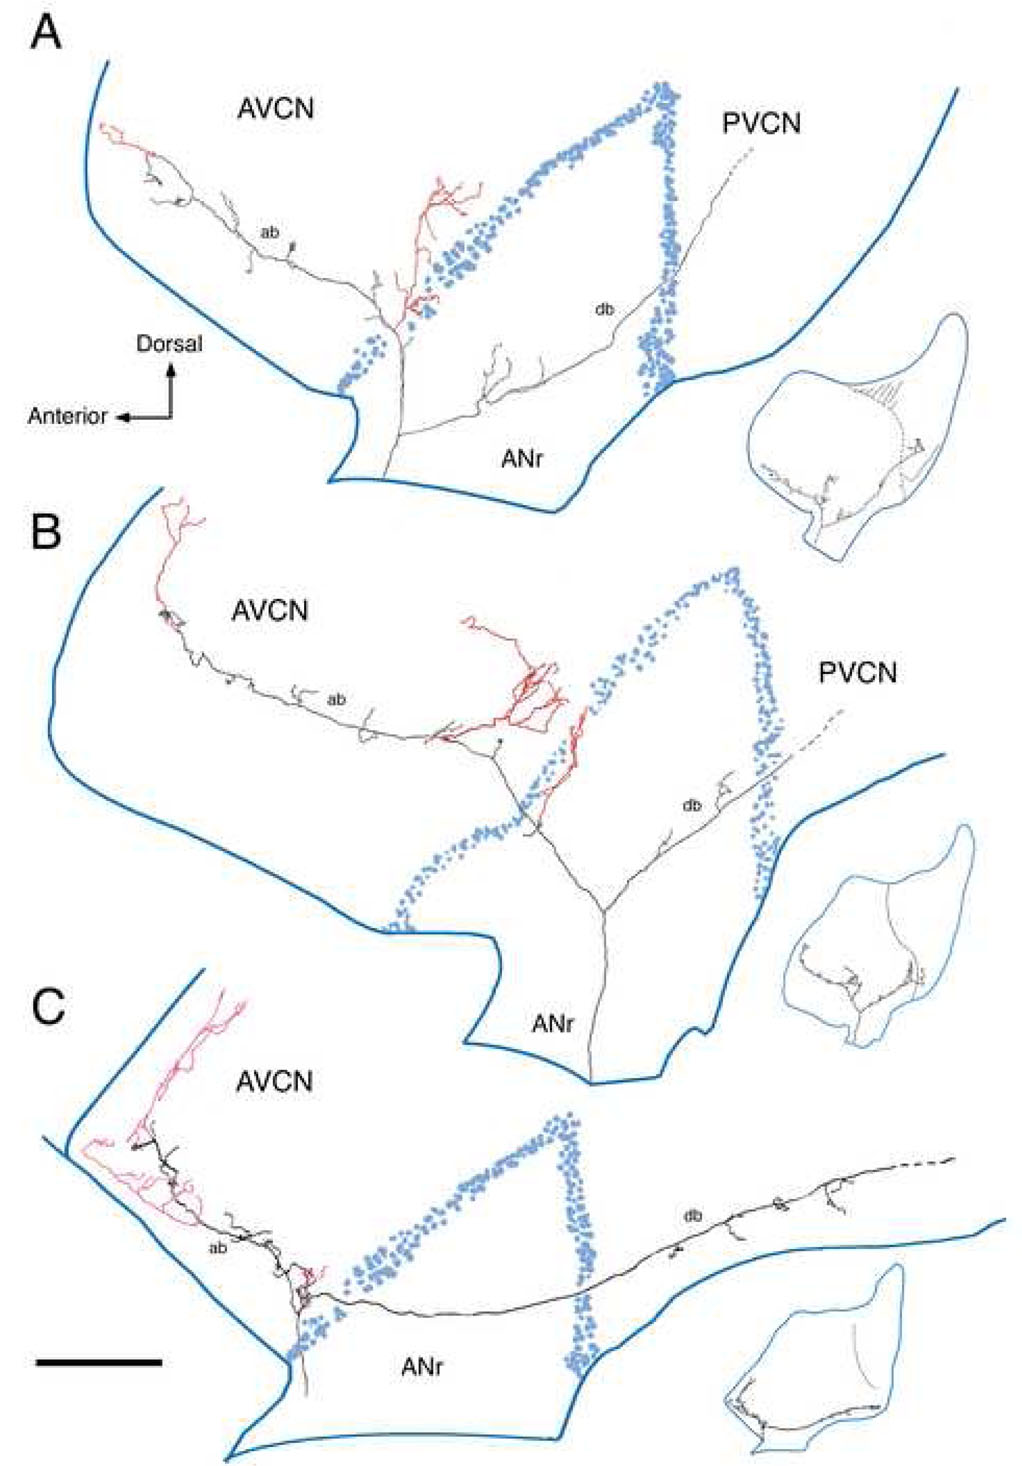
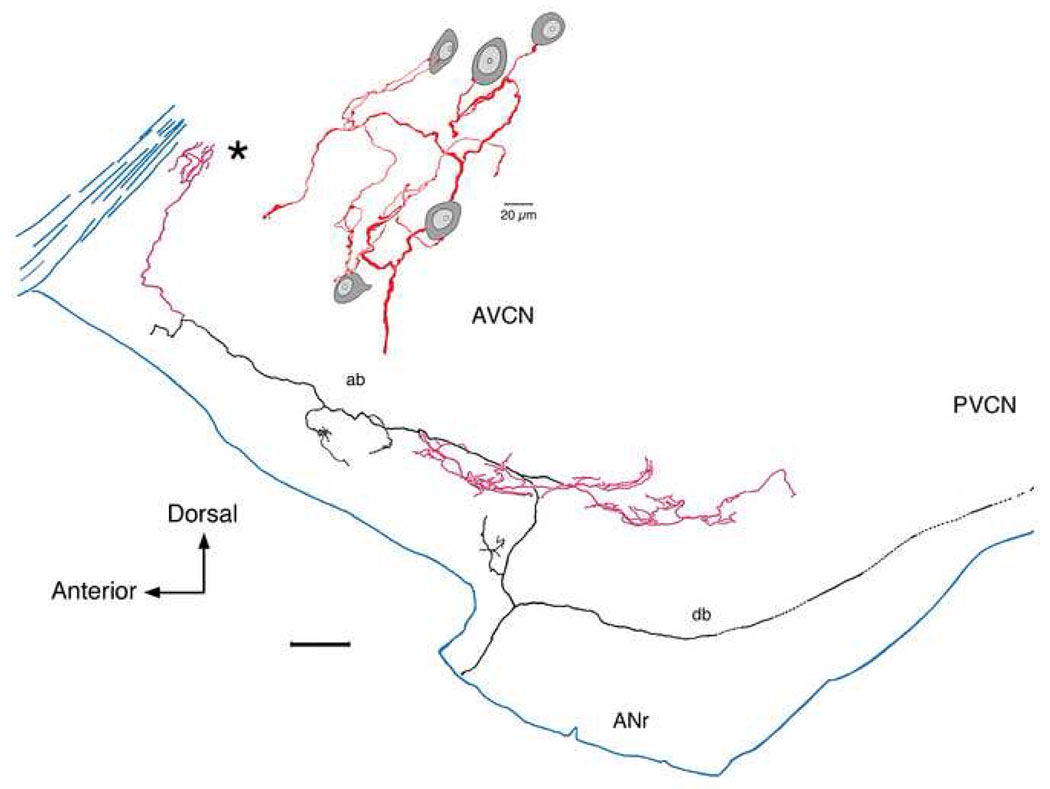
The ascending branches of low SR fibers were distinguishable from those of high SR fibers by the presence of several long, thin collateral branches that arborized extensively within the small cell cap (Fig. 1, Fig. 2, Fig. 3). The branches were typically 1–2 µm in diameter and tapered to 1 µm in diameter or less near their ends. They produced occasional en passant swellings and always terminated in a swelling, typically in the form of a simple small bouton. Although the sample size is small, it is noteworthy that these collaterals arose at relatively predictable locations along the ascending branch. One location appeared near the end of the ascending branch, sometimes emerging directly from the endbulb of Held. The anterior collateral was a feature of every low SR fiber that we examined. The other collateral occurred just as the ascending branch passed out of the region of the auditory nerve root and into the AVCN (Fig. 1, Fig. 2, Fig. 3). These collaterals ramified primarily along the dorsal or lateral region of the cap but occasionally were found in the medial zone. In the light microscope, some of the terminals appeared to be in close proximity to the somata of small cells but most appeared to be distributed in the neuropil.
Figure 2.
This figure presents three reconstructed low SR fibers in the cochlear nucleus in side view. The collaterals that innervate the small cell cap rostrally and laterally are shown in red. (A) CF=1.2 kHz, SR=1.0 s/s, Th=4 dB SPL; (B) CF=1.85 kHz, SR=0 s/s, Th=50 dB SPL; (C) CF=0.3 kHz, SR=0.1 s/s, Th=39 dB SPL. The distributed terminals from these collaterals have areal spread over the nucleus yet are also confined to a thin zone squeezed between the outermost GCD and the underlying magnocellular core. Abbreviations: ab, ascending branch; ANr, auditory nerve root; AVCN, anteroventral cochlear nucleus; db, descending branch; PVCN, posteroventral cochlear nucleus. Scale bar equals 0.5 mm.
Figure 3.
Lateral view of a low SR fiber as it collateralizes (red) in the rostral and lateral small cell cap (CF=0.45 kHz; SR=1.2 s/s; Th=34 dB SPL). The collateral in the rostral AVCN (*) is enlarged to show en passant and terminal swellings that lie in close contact with small cells of various shapes (oval or polygonal). This collateral shows how small cells received multiple inputs from collateral branches from a single auditory nerve fiber and how a single collateral can distribute divergent terminals to multiple small cells. This figure was modified from figure 15 of Fekete et al., 1984 and figure 1B of Ryugo and Rouiller, 1988. An electron micrograph of this fiber forming an axosomatic contact with a small cell is shown in figure 1 of Rouiller et al., 1986. The scale bar is 0.2 mm.
The highly arborized collaterals had a relatively broad area of distribution but within a restricted depth. That is, the collateral territory could extend across hundreds of micrometers. The two-dimensional shape of this territory ranged from circular to rectangular. No obvious topography of this projection field was observed with respect to fiber CF. The terminal swellings were not large, generally having a diameter of 1–2 µm (Fig. 4A, D). Clusters of terminals were constrained to the narrow zone between the superficial GCD and the underlying magnocellular core. This situation meant that terminal swellings could often be found in close proximity to each other (Fig. 1–Fig. 3). The collateral arrangement also meant that a single fiber could form multiple contacts onto a single cell and/or single contacts onto widely separated cells.
Cells of the Small Cell Cap
The cells of the small cell cap were distinguishable from the overlying members of the GCD on the basis of somatic size (Fig. 4). Granule cells, unipolar brush cells, chestnut cells, and Golgi cells reside within the GCD (Mugnaini et al., 1980a, b; Weedman et al., 1996). These cells have diameters less than 12 µm and represent microneurons with local circuit axons. The macroneurons that lie deep to the small cell cap are large by comparison, averaging between 25–30 µm in diameter. Larger globular bushy cells and multipolar cells (30–40 µm in diameter) were encountered more caudally in the VCN. The small cells of the SCC averaged between 12–18 µm in diameter and rarely exceeded 20 µm in their longest dimension (Fig. 4B, C, E, F). Small cells exhibited a slightly eccentric, clear, round nucleus with a prominent nuclear membrane (Fig. 4). These cells varied somewhat in size (mean=188.1 ± 65.3 µm2) and exhibited some variability in general shape. They ranged in appearance from fusiform to oval to roundish-with-angular corners (polygonal) although it should be stressed that these shapes graded from one to the other along a continuum. We used the ratio of short axis divided by long axis to estimate shape, where ratios near unity signified a circular shape and those having smaller values indicated an elongated shape. Small cells of different shapes and sizes showed no preference for location. In fact, a collateral from a single fiber could associate with multiple small cells each with a different appearance (Fig. 3).
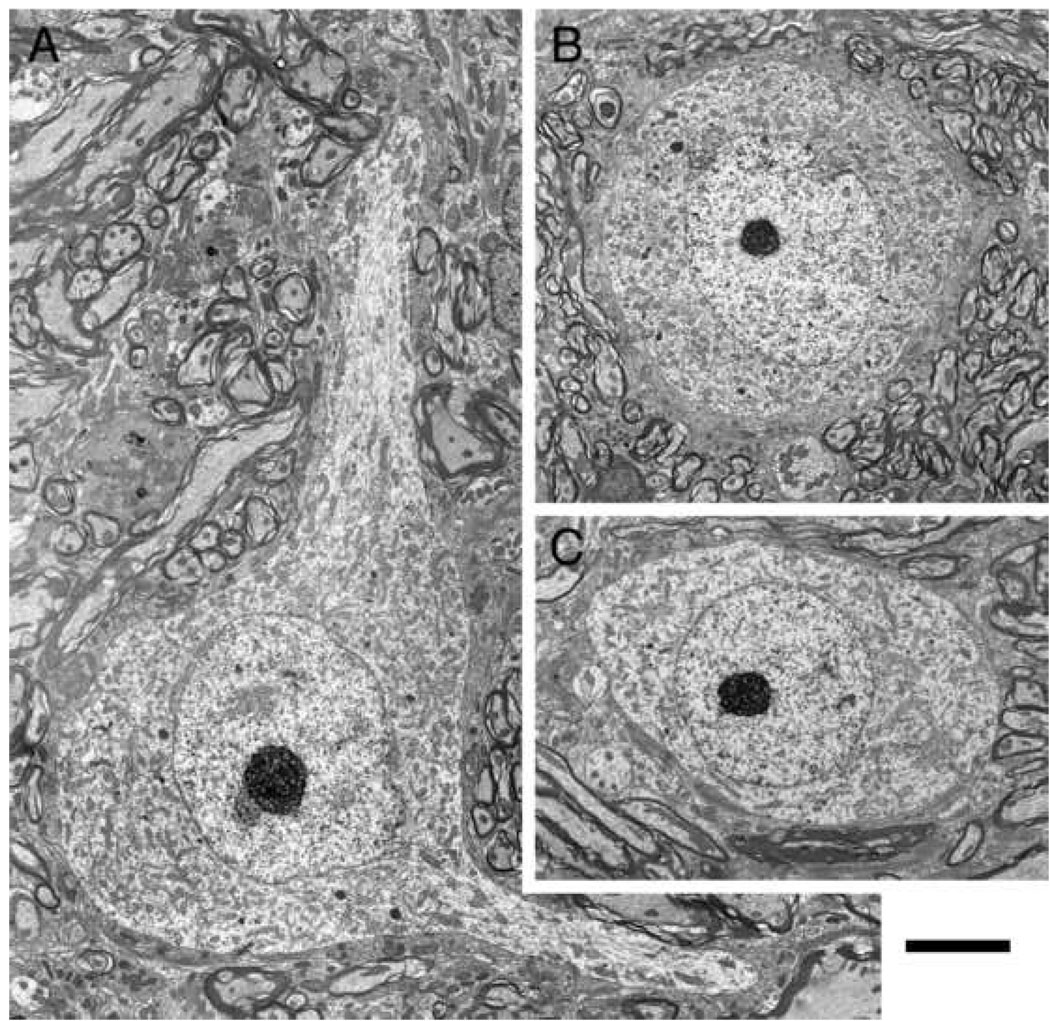
Examination of small cells with an electron microscope confirmed and extended the light microscopic observations (Fig. 5). Somatic shape was generally oval-to-polygonal with a round nucleus that exhibited small invaginations (Fig. 5). Chromatin collected along the nuclear envelope and gave the nucleus a distinct border. Within the nucleus, chromatin was uniformly but lightly dispersed. There was occasional clumping of the chromatin, but the nucleus remained more translucent than the cytoplasm. Astrocytic processes covered much of the somatic surface. These features tended to unify the population of small cells. Cell bodies appeared oval when there was no sign of emerging dendrites; such profiles exhibited relatively few axosomatic endings with a range of 6–12 terminals (Fig. 5B, C). In contrast, cell bodies tended to have a more polygonal somatic shape when dendrites were emerging (Fig. 5A). Because axosomatic terminals tended to accumulate around the dendrite-soma junction, the number of observed terminals depended on where the cell was examined. The features of somatic and nuclear size and shape, ratio of nucleus-to-cytoplasm, and mitochondrial volume fraction were not correlated.
Figure 5.
Electron micrographs of representative small cells of the peripheral cap. Cell bodies appear polygonal when dendrites emerge (A) but are oval-to-round when no dendrites are evident (B, C). The nucleus is pale compared to the cytoplasm. Somatic terminals are generally sparse but increase around the base of dendritic stalks. Scale bar equals 5 µm.
Labeled Endings and Targets
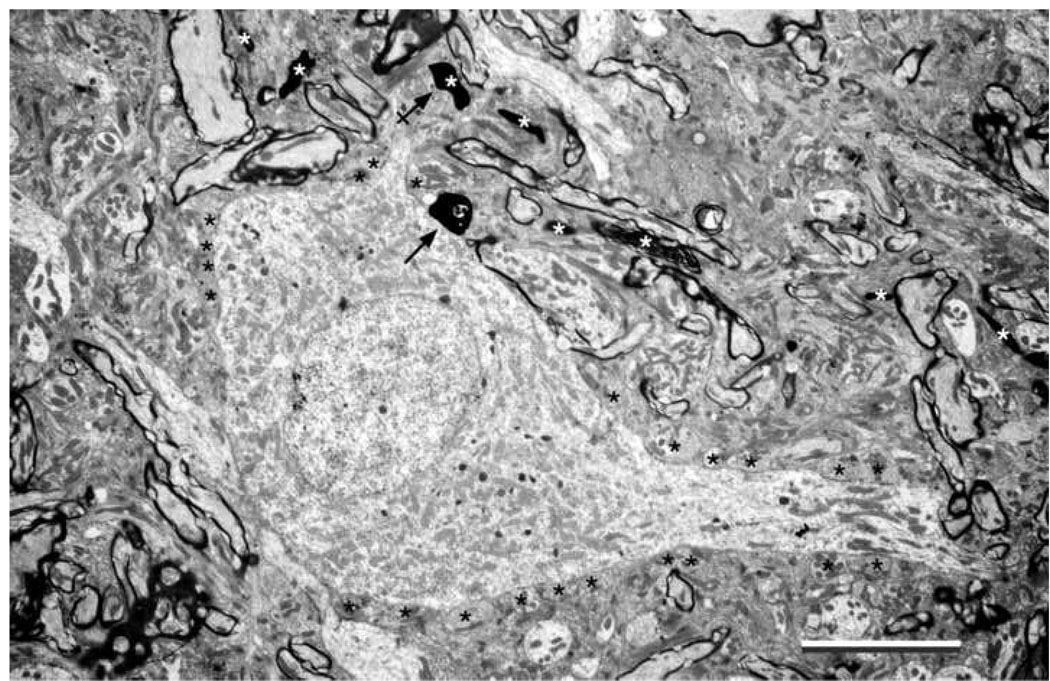
The HRP reaction product in the labeled fibers was so dark that much of the intracellular details of the ending was obscured. In the more lightly stained cases, the lumen of synaptic vesicles and parts of mitochondrial cristae were apparent. By increasing the brightness of the more darkly stained endings, vesicles could be revealed but other structures were “washed out” by the glare. The synaptic vesicles in these labeled terminals were distinctly round, but it was not possible to measure them with any confidence. There were several instances where a labeled terminal was found with electron microscopy making an axosomatic synapse against an oval small cell (e.g., Fig. 1, Rouiller et al., 1986) and a polygonal small cell (Fig. 6). These synapses formed asymmetric postsynaptic densities, an observation consistent with the presence of round synaptic vesicles. Because of the dense intracellular HRP-DAB reaction product, we used the following method to establish criteria for our interpretations: (a) the presence of a postsynaptic density (PSD) was a clear and practical indicator for a synapse because it was not obscured by the intracellular reaction product; (b) in some instances we would search through adjacent sections to confirm or deny the presence of a PSD associated with the specific terminal; (c) we could digitally “overexpose” the terminal so that the reaction product was lightened to reveal synaptic vesicles. In short, if we could observe synaptic vesicles and a PSD associated with a labeled terminal, we inferred the presence of a synapse.
Figure 6.
Electron micrograph of a small “polygonal” cell in the dorsal small cell cap that is innervated by a low SR fiber (CF=0.78 kHz; SR=6.33 s/s; Th=20 dB). The cytoplasmic features resemble those of the small cell shown in Figure 5A. The labeled terminals arise from a single collateral and make asymmetric synapses on the cell body (arrow) and one of its dendrites (arrow with cross). The PSDs were observed in deeper sections and the vesicles were revealed by “overexposing” the terminal. Unlabeled axosomatic terminals are labeled with black asterisks. Additional labeled terminals and their fiber of origin are indicated (white asterisks). The dendrites are marked by polyribosomes. Scale bar equals 5 µm.
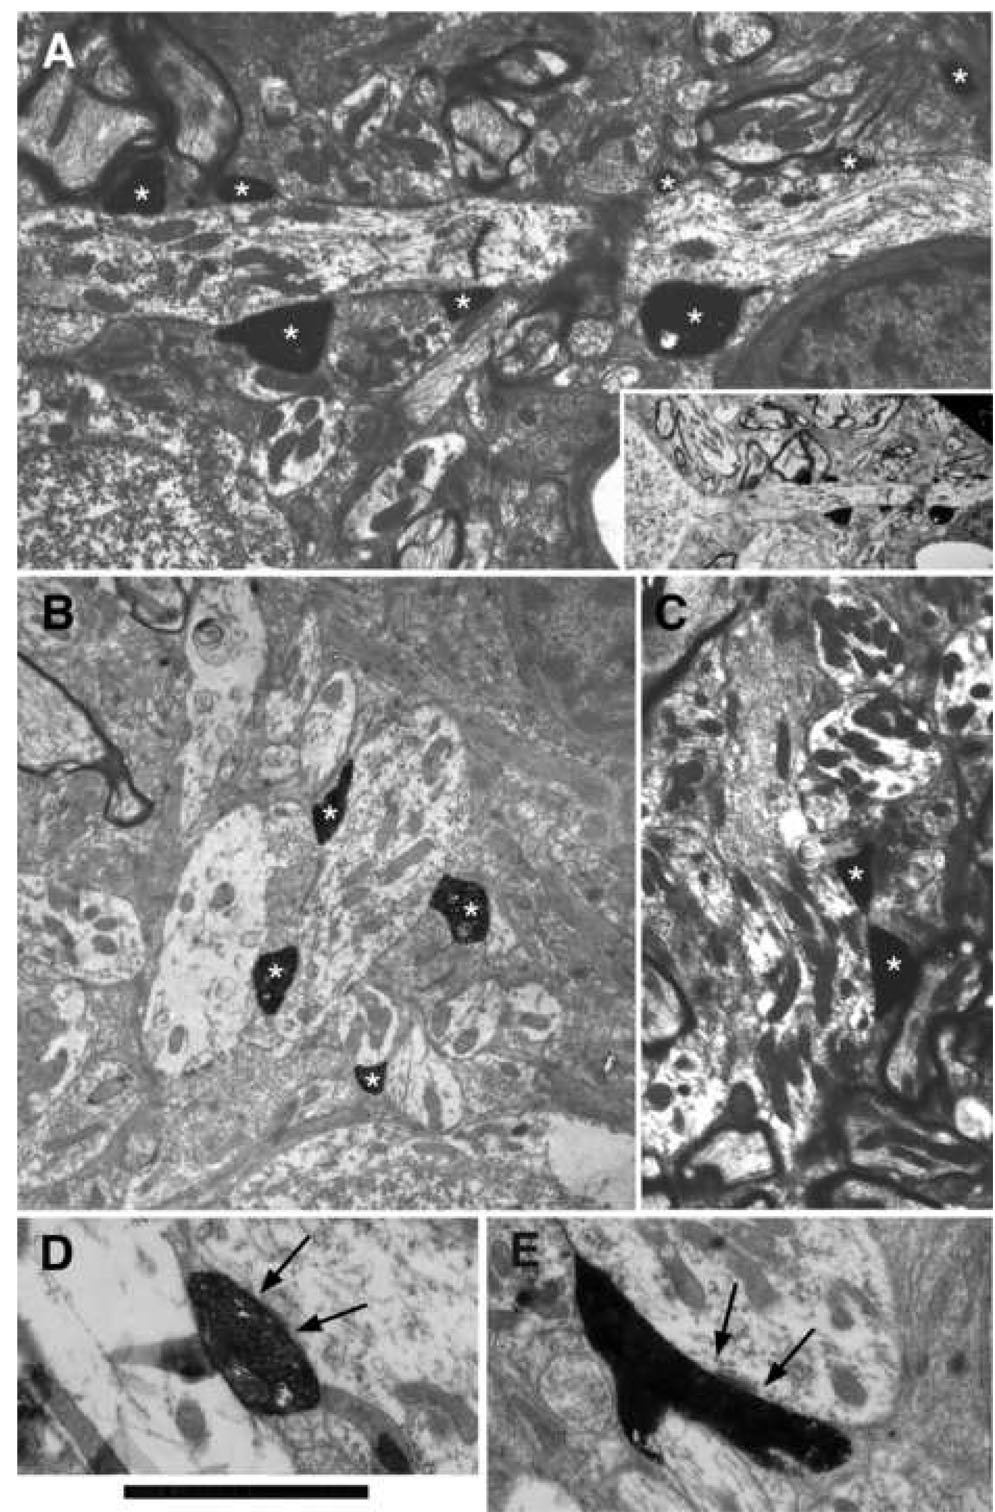
As evident from the light microscopic reconstructions of the fibers, most of the terminals were distributed in the neuropil. These endings were small, usually less than 2 micrometers in diameter. Electron microscopic observations confirmed that terminals in the neuropil formed asymmetric synapses with dendrites (Fig. 7). Moreover, multiple terminals from a single collateral could each make synapses onto the dendrite of a small cell. The target dendrites were characterized by an abundance of microtubules, a cisternal system, ribosomes and occasional spines. In some instances, the postsynaptic dendrites were observed to arise directly from a small cell (Fig. 7A). In others, a postsynaptic dendrite was followed back through serial sections to a small cell. The microtubules and polyribosomes gave the dendrites of small cells a darker complexion and as such, they were distinguishable from the neighboring pale dendrites (Fig. 7). The pale dendrites were not targets of terminals from low SR auditory nerve fibers, although they appeared in approximate equal frequency and had similar shapes and diameters. Although the sample size is small, there was perfect correlation of eight low SR auditory nerve fibers synapsing onto 18 dendrites with ribosomes, seven of which could be followed back to small cells. These observations revealed a potential “signature” for identifying the dendrites of small cells in the cap.
Figure 7.
Electron micrographs of HRP-labeled axodendritic terminals from low SR auditory nerve fibers (*). Panel 7A is from the fiber illustrated in Fig. 1. The inset shows that the dendrite in A arises from a small cell. Panels B, D, and E are from the fiber illustrated in Fig. 3. Panel C is part of the fiber illustrated in Fig. 6. All of the terminals contact dendrites that contain ribosomes. Dendrites of the small cell cap that lacked ribosomes were pale and never postsynaptic to the low SR auditory nerve fibers. Arrows in D and E indicate postsynaptic densities. Scale bar equals 5 µm for panels A–C and 3 µm for panels D–E.
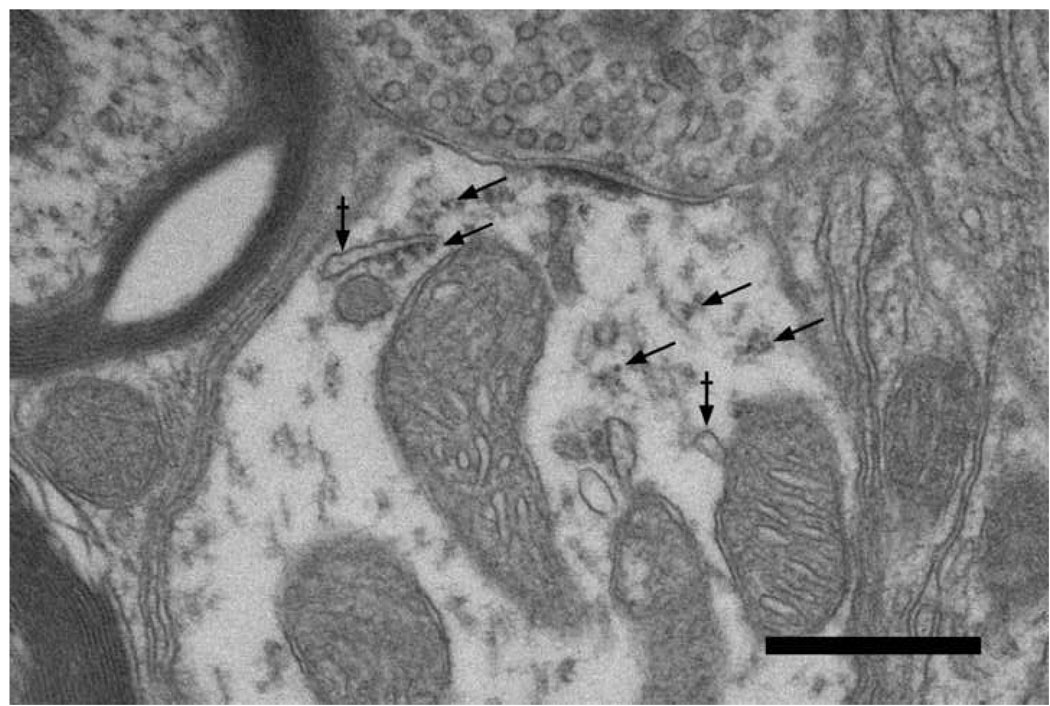
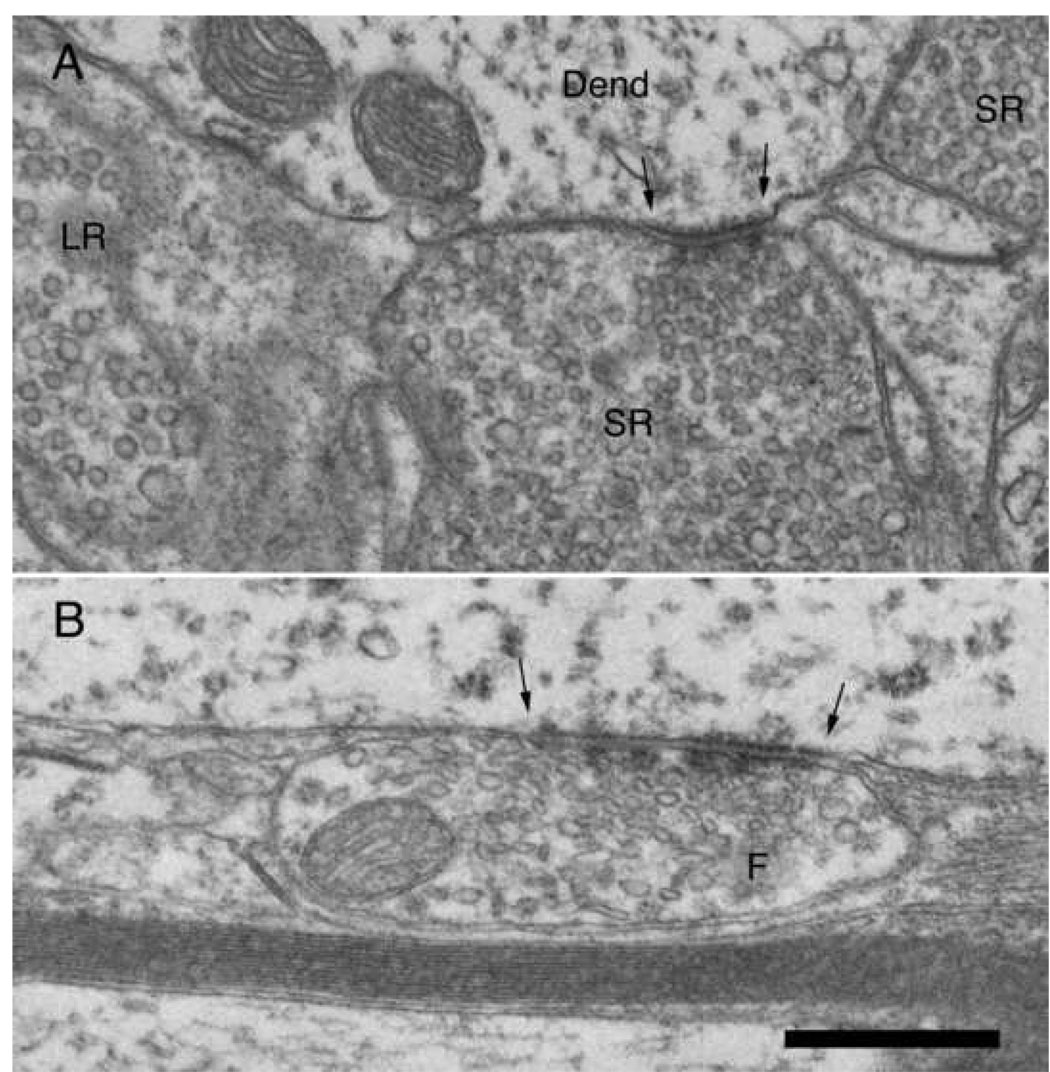
Electron micrographs from normal non-experimental tissue show these features more clearly (Fig. 8). Endings with large round synaptic vesicles terminated on dendrites containing free polysomes or ribosomes in conjunction with endoplasmic cisternae. These organelles were found in proximity to synapses. Moreover, before we could classify the synaptic vesicles in this terminal, they were subject to morphometric analysis where profile area and index of circularity were calculated (ImageJ). Terminals containing large round vesicles (mean area=2192 ± 420.3 nm2; circularity=0.897 ± 0.01) exhibited vesicle characteristics identical to those of endbulbs of Held and were found on dendrites containing ribosomes and on the somata of small cells. These observations argued that terminals with large round vesicles arose low SR fibers from the auditory nerve. The most common type of terminal contained small round vesicles (mean size=1546.3 ± 285.4 nm2; circularity=0.882 ± 0.01). The other type of terminal contained flattened or pleomorphic synaptic vesicles (mean size = 1440.1 ± 430.7 nm2; circularity = 0.829 ± 0.05). Both types of these non-primary terminals were found on the somata and dendrites of small cells (Fig. 9) as well as on dendrites of unknown origin.
Figure 8.
Electron micrograph of axodendritic synapse in the small cell cap. The terminal contains large, round synaptic vesicles and forms an asymmetric synapse onto a dendrite that contains microtubules, polysomes (arrows), and membranous cisternae (arrows with bar). The presynaptic characteristics are typical of auditory nerve fibers and the postsynaptic dendrite exhibits features typical of small cells of the cap. The positioning of protein synthetic organelles (arrows) beneath dendritic synapses suggests that local translation might play a role in synaptic modification. Scale bar equals 0.5 µm.
Figure 9.
Electron micrographs of terminals in the small cell cap. (A) Terminals containing large round (LR) and small round (SR) synaptic vesicles. The SR terminal forms a synapse (arrows) with a dendrite that does not contain ribosomes, implying that it does not originate from a small cell. (B) Axosomatic terminal containing flattened synaptic vesicles and forming a symmetric synapse (arrows) with a small cell in the cap zone. Scale bar equals 0.5 µm.
Discussion
The present results demonstrate that the high threshold, low SR population of myelinated auditory nerve fibers selectively synapse on the somata and dendrites of small cells in the peripheral cap of the cochlear nucleus. This cap of small cells is thin, sometimes a mere single cell thick, and lies along the rostral, medial, dorsal and lateral margins of the VCN (Osen, 1969). Specifically, the small cell cap is sandwiched between the microneurons of the GCD and the macroneurons of the VCN core (Cant, 1993).
The resident neurons are unified by their small size, and while they differ in shape, this difference is graded as they blend from oval to polygonal. At the light microscopic level, the cell nuclei are round and pale with prominent nucleoli. It seems that somatic shape is influenced by emerging dendrites: when no dendrites are evident in the section (or focal plane under a light microscope), the cell body is oval-to-round. A tangential section through this oval portion will appear fusiform. At the junction of dendrites, however, the cell body takes on a polygonal shape. The somata of these small cells have a significant covering by astrocytic processes with a sprinkling of axosomatic terminals. These terminals can have synaptic vesicles with round or pleomorphic shapes, and they tended to accumulate around the site where dendrites emerge.
These small cells are distinctive because their dendrites, with occasional spines, are characterized internally by mitochondria, abundant microtubules, polyribosomes, and membranous cisternae. Synapse-associated polyribosomes, either free or in association with membraneous cisterns, were reliably situated beneath or near postsynaptic densities. Moreover, these cells and their dendrites appear to be the exclusive recipient of auditory nerve input within the peripheral cap. The consistency of our observations unifies these members of the peripheral shell as a homogeneous population but does not necessarily eliminate the possibility that other types of small cells reside in the shell. The cap extends across a wide expanse of the cochlear nucleus and we were able to sample a relatively small part.
Polyribosomal complexes have been observed in association with a spine apparatus or tubular cisterns in other neural systems, and raise questions about their possible role in activity-dependent synaptic modification (Steward and Reeves, 1988; Steward, 1995; Steward and Schuman, 2001). The dendritic location of organelles for synthesizing proteins suggests compartments of cellular microdomains for differential and nonuniform functions. Considerable evidence has accumulated about the molecular composition and translational competence of this protein synthetic machinery but questions remain about its involvement in protein sorting, de novo synthesis, cytoskeletal construction, receptor trafficking, and synaptic plasticity (Wang and Tiedge, 2004; Sutton and Schuman, 2006). We demonstrate that the dendrites of small cells contain the molecular components necessary to initiate synthetic processes independent of the cell body. It remains to be determined how local modifications of synapses in this high threshold circuit would facilitate signal processing in feedback control of the inner ear.
The low SR, high threshold auditory nerve fibers give rise to two or three collaterals that ramify, sometimes extensively, within the small cell cap. The characteristic distribution of terminals of low SR fibers has been previously noted (Fekete et al., 1984; Ryugo and Rouiller, 1988; Ryugo et al., 1993) and meticulously mapped (Liberman, 1991). This report advances our knowledge of low SR fibers by providing detailed drawings of the collaterals, descriptions of the small cells and endings, and electron micrographs of the synapses. Moreover, we demonstrate that a single collateral can form synapses on cell bodies and dendrites of small cells, and that this projection is divergent within the small cell cap. The implication is that small cell input from a single low SR fiber would be strong to a single cell and widespread across multiple cells.
The relationship of collaterals of low SR auditory nerve fibers to the small cell cap has functional significance. The mean threshold at CF for these fibers was 28.5 ± 13.5 dB SPL, well above the average threshold for high SR units (near 0 db SPL, Kiang et al., 1965; Liberman, 1978). The activation of these fibers by loud sounds would not only signify that a large pool of auditory nerve fibers was excited but also would produce a spread of activity across the small cell cap. Single unit recordings from small cells of the cap have shown them to exhibit non-saturating rate-level functions to tones and noises, with dynamic ranges as great as 89 dB (Ghoshal and Kim, 1996, 1997). The recruitment of small cell activity would be consistent with the idea that cells of the cap are suited to encode the intensity of acoustic stimuli. Because of the expansive distribution of low SR auditory nerve terminals within the small cell cap (Fekete et al., 1984; Ryugo and Rouiller, 1988; Liberman 1991; Ryugo et al., 1993), convergence of terminals from different fibers (each with an average dynamic range of 40–50 dB) onto an single small cell, if different in threshold, could endow the cell with a wide dynamic range. This projection of the small cell cap to dendrites and cell bodies of neurons belonging to the medial olivocochlear efferent system forms one link of a high threshold feedback circuit to the inner ear (Ye et al., 2000).
The neuropil of the small cell cap is a complicated mixture of dendrites, axons, and terminals. As previously noted, most of the endings contained small round synaptic vesicles and a lesser but significant number contained flattened synaptic vesicles (Cant, 1993). Our observations are wholly consistent with this earlier report, although we found more axosomatic terminals. We conclude that low SR auditory nerve endings form synaptic contacts with small cells and their ribosome-filled dendrites in the cap zone; primary endings were not found to form synapses with other target types in this region. In contrast, the somata and dendrites of small cells received inputs from terminals containing all three types of synaptic vesicles, indicating complex influences of input-output functions. The nonprimary endings also formed synapses on dendrites characterized by a lack of ribosomes but we do not know the source of such dendrites.
The projections of the small cell cap join several additional pathways to medial olivocochlear neurons. Inputs from the PVCN (Warr, 1969; Robertson and Winter, 1988; Thompson and Thompson, 1991), inferior colliculus (Faye-Lund, 1986; Vetter et al., 1993), auditory cortex (Mulders and Robertson, 2000a) and aminergic systems (Thompson and Thomas, 1995; Woods and Azeredo, 1999; Mulders and Robertson, 2000b) emphasize the complex nature of the MOC system. Further studies will be required to better understand how these various pathways might be involved in gain-control, inner ear protection, and/or selective attention.
Acknowledgements
I want to thank former lab colleagues who contributed to the collection of some of the intracellularly labeled fibers used in this report: they include Donna Fekete, Charlie Liberman, Eric Rouiller and Seishiro Sento. I give special thanks to Tan Pongstaporn for his technical assistance with electron microscopy, and to Christa Baker and Michael Muniak for helpful comments on the manuscript. This work was supported by a grant from NIH/NIDCD RO1 DC000232.
Abbreviations
- AVCN
anteroventral cochlear nucleus
- CF
characteristic frequency
- DCN
dorsal cochlear nucleus
- GCD
granule cell domain
- HRP
horseradish peroxidase
- MOC
medial olivocochlear system
- PVCN
posteroventral cochlear nucleus
- SCC
small cell cap
- SR
spontaneous discharge rate
- Th
threshold
- VCN
ventral cochlear nucleus
Footnotes
Publisher's Disclaimer: This is a PDF file of an unedited manuscript that has been accepted for publication. As a service to our customers we are providing this early version of the manuscript. The manuscript will undergo copyediting, typesetting, and review of the resulting proof before it is published in its final citable form. Please note that during the production process errors may be discovered which could affect the content, and all legal disclaimers that apply to the journal pertain.
References
- Adams JC. Ascending projections to the inferior colliculus. J Comp Neurol. 1979;183:519–538. doi: 10.1002/cne.901830305. [DOI] [PubMed] [Google Scholar]
- Alibardi L. Ultrastructural and immunocytochemical characterization of commissural neurons in the ventral cochlear nucleus of the rat. Ann Anat. 1998;180:427–438. doi: 10.1016/S0940-9602(98)80103-9. [DOI] [PubMed] [Google Scholar]
- Alibardi L. Fine structure, synaptology and immunocytochemistry of large neurons in the rat dorsal cochlear nucleus connected to the inferior colliculus. J Hirnforsch. 1999;39:429–439. [PubMed] [Google Scholar]
- Alibardi L. Identification of tuberculo-ventral neurons in the polymorphic layer of the rat dorsal cochlear nucleus. Eur J Morphol. 2000;38:153–166. doi: 10.1076/0924-3860(200007)38:3;1-5;ft153. [DOI] [PubMed] [Google Scholar]
- Alibardi L. Fine structure and neurotransmitter cytochemistry of neurons in the rat ventral cochlear nucleus projecting to the ipsilateral dorsal cochlear nucleus. Ann Anat. 2001;183:459–469. doi: 10.1016/S0940-9602(01)80204-1. [DOI] [PubMed] [Google Scholar]
- Benson TE, Berglund AM, Brown MC. Synaptic input to cochlear nucleus dendrites that receive medial olivocochlear synapses. J Comp Neurol. 1996;365:27–41. doi: 10.1002/(SICI)1096-9861(19960129)365:1<27::AID-CNE3>3.0.CO;2-L. [DOI] [PubMed] [Google Scholar]
- Blackburn CC, Sachs MB. Classification of unit types in the anteroventral cochlear nucleus: PST histograms and regularity analysis. J Neurophysiol. 1989;62:1303–1329. doi: 10.1152/jn.1989.62.6.1303. [DOI] [PubMed] [Google Scholar]
- Bourk TR, Mielcarz JP, Norris BE. Tonotopic organization of the anteroventral cochlear nucleus of the cat. Hear Res. 1981;4:215–241. doi: 10.1016/0378-5955(81)90008-3. [DOI] [PubMed] [Google Scholar]
- Brawer JR, Morest DK, Kane EC. The neuronal architecture of the cochlear nucleus of the cat. J Comp Neurol. 1974;155:251–300. doi: 10.1002/cne.901550302. [DOI] [PubMed] [Google Scholar]
- Brown MC, Liberman MC, Benson TE, Ryugo DK. Brainstem branches from olivocochlear axons in cats and rodents. J Comp Neurol. 1988;278:591–603. doi: 10.1002/cne.902780410. [DOI] [PubMed] [Google Scholar]
- Cant NB. The synaptic organization of the ventral cochlear nucleus of the cat: The peripheral cap of small cells. In: Merchán MA, et al., editors. The Mammalian Cochlear Nuclei: Organization and Function. New York: Plenum Press; 1993. pp. 91–105. [Google Scholar]
- Doucet JR, Ryugo DK. Projections from the ventral cochlear nucleus to the dorsal cochlear nucleus in rats. J Comp Neurol. 1997;385:245–264. [PubMed] [Google Scholar]
- Evans EF, Nelson PG. The responses of single neurones in the cochlear nucleus of the cat as a function of their location and anesthetic state. Exp Brain Res. 1973;17:402–427. doi: 10.1007/BF00234103. [DOI] [PubMed] [Google Scholar]
- Faye-Lund H. Projection from the inferior colliculus to the superior olivary complex in the albino rat. Anat Embryol. 1986;175:35–52. doi: 10.1007/BF00315454. [DOI] [PubMed] [Google Scholar]
- Fekete DM, Rouiller EM, Liberman MC, Ryugo DK. The central projections of intracellularly labeled auditory nerve fibers in cats. J Comp Neurol. 1984;229:432–450. doi: 10.1002/cne.902290311. [DOI] [PubMed] [Google Scholar]
- Ghoshal S, Kim DO. Marginal shell of the anteroventral cochlear nucleus: intensity coding in single units in the unanesthetized, decerebrate cat. Neurosci Lett. 1996;205:71–74. doi: 10.1016/0304-3940(96)12386-7. [DOI] [PubMed] [Google Scholar]
- Ghoshal S, Kim DO. Marginal shell of the anteroventral cochlear nucleus: single-unit Response properties in the unanesthetized decerebrate cat. J Neurophysiol. 1997;77:2083–2097. doi: 10.1152/jn.1997.77.4.2083. [DOI] [PubMed] [Google Scholar]
- Glendenning KK, Brunso-Bechtold JK, Thompson GC, Masterton RB. Ascending auditory afferents to the nuclei of the lateral lemniscus. J Comp Neurol. 1981;197:673–703. doi: 10.1002/cne.901970409. [DOI] [PubMed] [Google Scholar]
- Kiang NY-S, Watanabe T, Thomas EC, Clark LF. Discharge Patterns of Single Fibers in the Cat's Auditory Nerve. Cambridge, MA: MIT Press; 1965. [Google Scholar]
- Liberman MC. Auditory-nerve response from cats raised in a low-noise chamber. J Acoust Soc Am. 1978;63:442–455. doi: 10.1121/1.381736. [DOI] [PubMed] [Google Scholar]
- Liberman MC. The cochlear frequency map for the cat: Labeling auditory-nerve fibers of known characteristic frequency. J Acoust Soc Am. 1982a;75:1441–1449. doi: 10.1121/1.388677. [DOI] [PubMed] [Google Scholar]
- Liberman MC. Single neuron labelling in the cat auditory nerve. Science. 1982b;216:1239–1241. doi: 10.1126/science.7079757. [DOI] [PubMed] [Google Scholar]
- Liberman MC. Central projections of auditory-nerve fibers of differing spontaneous rate. I. Anteroventral cochlear nucleus. J Comp Neurol. 1991;313:240–258. doi: 10.1002/cne.903130205. [DOI] [PubMed] [Google Scholar]
- Liberman MC. Central projections of auditory nerve fibers of differing spontaneous rate, II: Posteroventral and dorsal cochlear nuclei. J Comp Neurol. 1993;327:17–36. doi: 10.1002/cne.903270103. [DOI] [PubMed] [Google Scholar]
- Liberman MC, Brown MC. Physiology and anatomy of single olivocochlear neurons in the cat. Hear Res. 1986;24:17–36. doi: 10.1016/0378-5955(86)90003-1. [DOI] [PubMed] [Google Scholar]
- Lorente de Nó R. The Primary Acoustic Nuclei. New York: Raven Press; 1981. [Google Scholar]
- Manis PB. Responses to parallel fiber stimulation in the guinea pig dorsal cochlear nucleus in vitro. J Neurophysiol. 1989;61:149–161. doi: 10.1152/jn.1989.61.1.149. [DOI] [PubMed] [Google Scholar]
- Mulders WH, Robertson D. Evidence for direct cortical innervation of medial olivocochlear neurones in rats. Hear Res. 2000a;144:65–72. doi: 10.1016/s0378-5955(00)00046-0. [DOI] [PubMed] [Google Scholar]
- Mulders WH, Robertson D. Morphological relationships of peptidergic and noradrenergic nerve terminals to olivocochlear neurones in the rat. Hear Res. 2000b;144:53–64. doi: 10.1016/s0378-5955(00)00045-9. [DOI] [PubMed] [Google Scholar]
- Mugnaini E, Osen KK, Dahl AL, Friedrich VL, Jr, Korte G. Fine structure of granule cells and related interneurons (termed Golgi cells) in the cochlear nuclear complex of cat, rat, and mouse. J Neurocytol. 1980a;9:537–570. doi: 10.1007/BF01204841. [DOI] [PubMed] [Google Scholar]
- Mugnaini E, Warr WB, Osen KK. Distribution and light microscopic features of granule cells in the cochlear nuclei of cat, rat, and mouse. J Comp Neurol. 1980b;191:581–606. doi: 10.1002/cne.901910406. [DOI] [PubMed] [Google Scholar]
- Oertel D, Wu SH, Garb MW, Dizack C. Morphology and physiology of cells in slice preparations of the posteroventral cochlear nucleus of mice. J Comp Neurol. 1990;295:136–154. doi: 10.1002/cne.902950112. [DOI] [PubMed] [Google Scholar]
- Osen KK. Cytoarchitecture of the cochlear nuclei in the cat. J Comp Neurol. 1969;136:453–482. doi: 10.1002/cne.901360407. [DOI] [PubMed] [Google Scholar]
- Osen KK. Course and termination of the primary afferents in the cochlear nuclei of the cat. Arch ital Biol. 1970;108:21–51. [PubMed] [Google Scholar]
- Pfeiffer RR. Classification of response patterns of spike discharges for units in the cochlear nucleus: Tone burst stimulation. Exp Brain Res. 1966;1:220–235. doi: 10.1007/BF00234343. [DOI] [PubMed] [Google Scholar]
- Robertson D, Winter IM. Cochlear nucleus inputs to olivocochlear neurones revealed by combined anterograde and retrograde labelling in the guinea pig. Brain Res. 1988;462:47–55. doi: 10.1016/0006-8993(88)90583-5. [DOI] [PubMed] [Google Scholar]
- Roth GL, Aitken LM, Anderson RA, Merzenich MM. Some features of the spatial organization of the central nucleus of the inferior colliculus of the cat. J Comp Neurol. 1978;182:661–680. doi: 10.1002/cne.901820407. [DOI] [PubMed] [Google Scholar]
- Rouiller EM, Cronin-Schreiber R, Fekete DM, Ryugo DK. The central projections of intracellularly labeled auditory nerve fibers in cats: An analysis of terminal morphology. J Comp Neurol. 1986;249:261–278. doi: 10.1002/cne.902490210. [DOI] [PubMed] [Google Scholar]
- Ryugo DK, May SK. The projections of intracellularly labeled auditory nerve fibers to the dorsal cochlear nucleus of cats. J Comp Neurol. 1993;329:20–35. doi: 10.1002/cne.903290103. [DOI] [PubMed] [Google Scholar]
- Ryugo DK, Parks TN. Innervation of the cochlear nucleus in birds and mammals. Brain Res. Bull. 60:435–456. doi: 10.1016/s0361-9230(03)00049-2. (review) [DOI] [PubMed] [Google Scholar]
- Ryugo DK, Rouiller EM. Central projections of intracellularly labeled auditory nerve fibers in cats: morphological correlations with physiological properties. J Comp Neurol. 1988;271:130–142. doi: 10.1002/cne.902710113. [DOI] [PubMed] [Google Scholar]
- Ryugo DK, Willard FH. The dorsal cochlear nucleus of the mouse: A light microscopic analysis of neurons that project to the inferior colliculus. J Comp Neurol. 1985;242:381–396. doi: 10.1002/cne.902420307. [DOI] [PubMed] [Google Scholar]
- Ryugo DK, Wright DD, Pongstaporn T. Ultrastructural analysis of synaptic endings of auditory nerve fibers in cats: Correlations with spontaneous discharge rate. In: Merchan MM, et al., editors. The Mammalian Cochlear Nuclei: Organization and Function. New York: Plenum Press; 1993. pp. 65–74. [Google Scholar]
- Sando I. The anatomical interrelationships of the cochlear nerve fibers. Acta oto-laryng Stockh. 1965;59:417–436. [Google Scholar]
- Schofield BR. Projections from the cochlear nucleus to the superior paraolivary nucleus in guinea pigs. J Comp Neurol. 1995;360:135–149. doi: 10.1002/cne.903600110. [DOI] [PubMed] [Google Scholar]
- Schofield BR, Cant NB. Origins and targets of commissural connections between the cochlear nuclei in guinea pigs. J Comp Neurol. 1996a;375:128–146. doi: 10.1002/(SICI)1096-9861(19961104)375:1<128::AID-CNE8>3.0.CO;2-5. [DOI] [PubMed] [Google Scholar]
- Schofield BR, Cant NB. Projections from the ventral cochlear nucleus to the inferior colliculus and the contralateral cochlear nucleus in guinea pigs. Hear Res. 1996b;102:1–14. doi: 10.1016/s0378-5955(96)00121-9. [DOI] [PubMed] [Google Scholar]
- Sento S, Ryugo DK. Endbulbs of Held and spherical bushy cells in cats: Morphological correlates with physiological properties. J Comp Neurol. 1989;280:553–562. doi: 10.1002/cne.902800406. [DOI] [PubMed] [Google Scholar]
- Sokolich WG. Improved acoustic system for auditory research. J Acoust Soc Am Suppl. 1977;62:S12. [Google Scholar]
- Steward O. Targeting of mRNAs to subsynaptic microdomains in dendrites. Curr Opin Neurobiol. 1995;5:55–61. doi: 10.1016/0959-4388(95)80087-5. [DOI] [PubMed] [Google Scholar]
- Steward O, Reeves TM. Protein synthetic machinery beneath postsynaptic sites on CNS neurons: association between polyribosomes and other organelles at the synaptic site. J Neurosci. 1988;8:176–184. doi: 10.1523/JNEUROSCI.08-01-00176.1988. [DOI] [PMC free article] [PubMed] [Google Scholar]
- Steward O, Schuman EM. Protein synthesis at synaptic sites on dendrites. Annu Rev Neurosci. 2001;24:299–325. doi: 10.1146/annurev.neuro.24.1.299. [DOI] [PubMed] [Google Scholar]
- Sutton MA, Schuman EM. Dendritic protein synthesis, synaptic plasticity, and memory. Cell. 2006;127:49–58. doi: 10.1016/j.cell.2006.09.014. [DOI] [PubMed] [Google Scholar]
- Thompson AM, Thompson GC. Posteroventral cochlear nucleus projections to olivocochlear neurons. J Comp Neurol. 1991;303:267–285. doi: 10.1002/cne.903030209. [DOI] [PubMed] [Google Scholar]
- Thompson AM, Thompson GC. Light microscopic evidence of serotoninergic projections to olivocochlear neurons in the bush baby (Otolemur garnettii) Brain Res. 1995;695:263–266. doi: 10.1016/0006-8993(95)00863-l. [DOI] [PubMed] [Google Scholar]
- Vetter DE, Saldana E, Mugnaini E. Input from the inferior colliculus to medial olivocochlear neurons in the rat: a double label study with PHA-L and cholera toxin. Hear Res. 1993;70:173–186. doi: 10.1016/0378-5955(93)90156-u. [DOI] [PubMed] [Google Scholar]
- Wang H, Tiedge H. Translational control at the synapse. Neuroscientist. 2004;10:456–466. doi: 10.1177/1073858404265866. [DOI] [PubMed] [Google Scholar]
- Warr WB. Parallel ascending pathways from the cochlear nucleus: Neuroanatomical evidence of functional specialization. In: Neff WD, editor. Contributions to Sensory Physiology. vol. 7. New York: Academic Press; 1982. pp. 1–38. [Google Scholar]
- Warr WB. Fiber degeneration following lesions in the posteroventral cochlear nucleus of the cat. Exp Neurol. 1969;23:140–155. doi: 10.1016/0014-4886(69)90040-5. [DOI] [PubMed] [Google Scholar]
- Weedman DL, Pongstaporn T, Ryugo DK. Ultrastructural study of the granule cell domain of the cochlear nucleus in rats: Mossy fiber endings and their targets. J Comp Neurol. 1996;369:345–360. doi: 10.1002/(SICI)1096-9861(19960603)369:3<345::AID-CNE2>3.0.CO;2-5. [DOI] [PubMed] [Google Scholar]
- Weedman DL, Ryugo DK. Projections from auditory cortex to the cochlear nucleus in rats: Synapses on granule cell dendrites. J Comp Neurol. 1996;371:311–324. doi: 10.1002/(SICI)1096-9861(19960722)371:2<311::AID-CNE10>3.0.CO;2-V. [DOI] [PubMed] [Google Scholar]
- Woods CI, Azeredo WJ. Noradrenergic and serotonergic projections to the superior olive: potential for modulation of olivocochlear neurons. Brain Res. 1999;836:9–18. doi: 10.1016/s0006-8993(99)01541-3. [DOI] [PubMed] [Google Scholar]
- Ye Y, Machado DG, DO K. Projection of the marginal shell of the anteroventral cochlear nucleus to olivocochlear neurons in the cat. J Comp Neurol. 2000;420:127–138. [PubMed] [Google Scholar]
- Young ED, Brownell WE. Responses to tones and noise of single cells in dorsal cochlear nucleus of unanesthetized cats. J Neurophysiol. 1976;39:282–300. doi: 10.1152/jn.1976.39.2.282. [DOI] [PubMed] [Google Scholar]
- Young ED, Shofner WP, White JA, Robert J-M, Voigt HF. Response properties of cochlear nucleus neurons in relationship to physiological mechanisms. In: Edelman GM, et al., editors. Auditory Function: Neurobiological Bases of Hearing. New York: John Wiley & Sons; 1988. pp. 277–312. [Google Scholar]


