

Abstract
Red blood cells (RBCs) play a crucial role in health and disease, and structural and mechanical abnormalities of these cells have been associated with important disorders such as Sickle cell disease and hereditary cytoskeletal abnormalities. Although several experimental methods exist for analysis of RBC mechanical properties, optical methods stand out as they enable collecting mechanical and dynamic data from live cells without physical contact and without the need for exogenous contrast agents. In this report, we present quantitative phase microscopy techniques that enable imaging RBC membrane fluctuations with nanometer sensitivity at arbitrary time scales from milliseconds to hours. We further provide a theoretical framework for extraction of membrane mechanical and dynamical properties using time series of quantitative phase images. Finally, we present an experimental approach to extend quantitative phase imaging to 3-dimensional space using tomographic methods. By providing non-invasive methods for imaging mechanics of live cells, these novel techniques provide an opportunity for high-throughput analysis and study of RBC mechanical properties in health and disease.
Keywords: phase microscopy, quantitative microscopy, red blood cells, cell mechanics
Introduction
Optical microscopy has been a major tool for biological and biomedical research for centuries. Although other techniques such as electron microscopy offer significantly better spatial resolution, light microscopy occupies a central role in biomedical science because of its ease of use and the potential for noninvasive, live cell imaging. In particular, since the invention of the phase contrast microscope by Frederik (Frits) Zernike, for which he was awarded the Noble Prize in physics in 1953, this instrument and its related techniques have been a cornerstone of every cell biology laboratory. In spite of their enormous value as non-invasive investigational tools, however, traditional phase methods such as phase contrast and differential interference contrast (DIC) are inherently qualitative and lack subcellular specificity. At the same time, extrinsic contrast techniques such as fluorescence microscopy offer molecular specificity and high spatial resolution. Nevertheless, these methods generally require alteration or modification of cellular and molecular structure including cell permeabilization, chemical or immunostaining, or genetic modification, and are therefore less than ideal for characterization of live cells in their native physiological state.
Over the past several years, significant progress has been made in quantitative phase microscopy methods that promise to overcome limitation of traditional phase microscopy. In particular, full-field quantitative phase techniques that provide simultaneous information from a wide field of view offer an ideal experimental approach to characterize spatial and temporal behavior of the sample [1; 2; 3; 4; 5; 6; 7; 8]. Our own laboratory has developed multiple experimental methods and instrumentation that enable full-field quantitative imaging of live cells using intrinsic cellular contrast such as refractive index and light scattering. These novel methods that typically have nanometer sensitivity over millisecond time scales have broken new ground in important areas of cellular biology, including characterization of structural and mechanical properties of cells [8; 9; 10; 11; 12; 13; 14; 15; 16; 17], high-throughput particle tracking in live cells [18], nanoscale imaging of cell electromotility [19], and quantitative phase tomographic microscopy [20; 21]. In this report, we present an update on instrumentation and methods for imaging live red blood cell (RBC) mechanical and dynamical properties using field-based phase microscopy methods. These methods complement the existing techniques for the study of RBC dynamics such as micropipette aspiration [22; 23] and optical tweezers [24; 25], and for the first time provide the opportunity for high-throughput, real-time analysis of RBC mechanical properties in health and disease.
Methods and Results
Principles of Full-Field Phase Imaging
Bright-field, fluorescence and many other common microscopic techniques are based on detection and visualization of the intensity and color of light produced by interaction between the illumination field and the sample. Given that most biological samples are relatively transparent, exogenous agents such as chemical or fluorescent dyes are commonly used to provide contrast through a variety of “staining”methods. The optical phase shift associated with light passing through an otherwise transparent sample, however, contains valuable structural information about various cellular and intracellular compartments, and can be regarded as a powerful endogenous contrast agent. Phase contrast and DIC microscopy have been traditionally used to image boundaries of various phase objects within the sample, but these techniques are inherently qualitative in nature as the relationship between the irradiance and phase of the image field is generally nonlinear [26; 27].
Unlike phase contrast techniques that essentially image the boundaries of a phase object such as nuclei and nucleoli, full-field quantitative imaging methods are capable of imaging the absolute phase associated with cells and subcellular structures. Fundamental to essentially all current techniques is the use of interferometry to measure phase delays associated with passage of light through a given sample. Generally, coherent laser light is split into two arms, one of which interacts with the sample while the other serves as a reference beam. By interfering the undisturbed incident wave (E0) with the transmitted wave (ET), which is modified by the sample (Fig. 1a), quantitative images of the phase delay induced by the sample are created. The resulting images contain structural information about the sample, which can be used to reconstruct a quantitative microscopic image with nanometer sensitivity (Fig. 1b). Furthermore, for structurally homogeneous samples such as mature RBCs, the phase delay through the sample (Δϕ) is directly proportional to the thickness or height (h) of the phase object. Therefore, the quantitative phase map of the sample in the x-y plane, Δϕ(x,y), can be directly translated into a quantitative image of the sample thickness, h(x,y), which demonstrates the familiar RBC morphology (Fig. 1c). Note that the image shown in Fig. 1c is one representative snap-shot of one live red cell in the field of view and is obtained on a millisecond time scale with no specific sample preparation. The complete dataset is a quantitative image of all cells in the field of view as a function of time. This 4-dimensional dataset (x, y, h, and time) forms the basis for essentially all mechanical and dynamic studies described below.
Figure 1.

(a) when an incident illumination field E0 passes through an essentially transparent sample such as a cell, the phase of the wavefront at any given point in space is delayed by a factor that is directly proportional to the refractive index of the sample, n, and the optical path length, h. The interferogram obtained by interfering the incidence field E0 with the transmitted field ET is mathematically transformed to obtained a physical image of the refractive index variations in the x-y plane. (b) As shown in this NBS-1963A resolution target, the phase distribution is then expressed as surface height distribution with nanometer sensitivity in the z-direction. (c) In biological samples of uniform refractive index, the phase image, Δϕ(x,y), is directly proportion to the height profile, h(x,y), where the proportion constant, k, is a function of wavelength and refractive index. The scale bar on the right shows cell thickness in microns.
As demonstrated in Fig. 1, the phase sensitivity of interferometry is quite high, enabling determination of sample thickness with accuracy of 1 nm or less. On the other hand, interference signals are very susceptible to external noise from mechanical vibrations, thermal fluctuations and other sources, which may cause erroneous fluctuations in the path length difference between sample and reference beams. As described below, we have used a variety of experimental approaches to address this experimental challenge in development of full-field phase imaging microscopes.
Full-Field Phase Imaging Microscopes
Although interferometric methods for full-field cellular imaging have been known for more than a decade [1; 2], significant advances in instrumentation and methods have enabled dynamical imaging of live cells and tissues with nanometer sensitivity over millisecond time scale [8; 9; 10; 11; 12; 13; 15; 28; 29; 30; 31]. As described, fundamental to all methods is the principle that interferometry can be used to measure phase delays through a given sample, while the specific experimental approach to noise cancellation and stabilization of the signal may vary from instrument to instrument. The following brief summary describes the basic experimental approach to three of the most relevant techniques for study of RBC dynamics.
Fourier phase microscopy (FPM) combines phase contrast microscopy with phase shifting interferometry [32; 33] to retrieve quantitative phase images with high transverse resolution and sub-nanometer path-length stability [31]. Because of its common path geometry (i.e., sample and reference beams travel through the same optical path, thus minimizing the differential effect of external noise on either beam), FPM is highly stable and well suited for studies of cellular dynamics over extended periods of time. Hilbert phase microscopy (HPM), in contrast, is a single-shot full-field technique which provides spatially-resolved quantitative phase information at the millisecond scale [13; 29]. Tilting the reference beam with respect to the sample beam introduces a spatial phase modulation in the interferogram, which can be processed through a Hilbert transform to quantitatively determine the phase shift induced by the specimen. Due to its single-shot nature, the acquisition time of the HPM is limited only by the recording device, so nanometer level path-length shifts can be measured in milliseconds (or less), allowing ultrafast dynamical studies over short periods of time. Diffraction phase microscopy (DPM, Fig. 2) takes advantage of the common-path geometry of FPM and the single shot capability of HPM, allowing fast and stable quantitative phase imaging over milliseconds to hours [12]. In addition, DPM can be readily combined with fluorescence microscopy and other techniques, enabling multimodal microscopy [28; 34].
Figure 2.

DPM experimental setup. Collimated light from a 514 nm Argon laser is coupled to an inverted microscope (Olympus IX71) equipped with a high numerical aperture 40x objective. An amplitude grating generates multiple diffraction orders containing full spatial information about the sample image. The 0th order beam is low-pass filtered using a pinhole placed at the Fourier plane so that it becomes a plane wave after passing through lens L4. A common-path Mach-Zender interferometer is thus created with the 0th order as the reference beam and the 1st order as the sample beam (inset). Compared to conventional Mach-Zender interferometers, the two beams propagate through the same optical components, which essentially eliminates the phase noise without the need for active stabilization. Figure adapted from [28].
Spatial behavior of RBC membrane fluctuations
Using the stabilized HPM instrument, full-field images of RBC fluctuations are collected over time. Samples of freshly collected RBCs with their typical discocytic shape, as well as altered forms including echinocytes and spherocytes are studied. Panels a–c of Fig. 3 show typical phase images of RBCs in these three morphological groups, respectively. As a control for background thermal motion of the cells, RBCs fixed briefly in 40μM gluteraldehyde are studied in parallel (not shown). As detailed previously [9], the spatial (or static) behavior of the thermal fluctuations can be expressed in terms of mean squared displacements (MSD) as a function of spatial wave vector, Δu 2 (q). The MSD data for groups of 4–5 cells in each morphological category are summarized in Fig. 3d. As expected, gluteraldehyde fixed cells (green circles, curve 4) show significantly diminished fluctuations as they only exhibit non-specific background thermal motion. In contrast, untreated RBC groups exhibit larger motions which has a power law behavior with an exponent of 2 (q−2 line in Fig. 3d). As detailed previously [9], this dependence is an indication of cell membrane tension, which in the case of live RBCs is modulated by the confinement of the lipid bilayer by the underlying cytoskeletal network [35; 36]. Based on this theoretical model, the experimental data are used to extract the tension coefficient, σ, for each individual RBC. The average values obtained for the discocytes, echinocytes, and spherocytes are σ = (1.5 ± 0.2)·10−6 J / m2, σ = (4.05 ±1.1)·10−6 J / m2, and σ = (8.25 ± 1.6)·10−6 J / m2, respectively. The measured tension coefficient of RBCs is several times larger than that of giant unilamellar vesicles, suggesting a role for the membrane cytoskeleton or possibly other cellular substructures in determining tension of the live RBCs [9]. Furthermore, the cytoskeleton plays an important role in the transitions from the normal RBC shape to abnormal morphologies such as echinocyte and spherocyte [37]. Therefore, the consistent increase in tension for the discocyte-echinocyte-spherocyte transition is likely explained by changes in the cytoskeletal architecture and/or membrane-cytoskeleton associations during these transitions. Finally, as detailed previously, the tension coefficient (σ) and bending modulus (κ) of RBCs can be calculated as a function of root mean squared (rms) displacement, Δurms [9]. As shown in Fig. 3e, different RBC morphologies have a somewhat similar bending moduli, while the tension coefficient appears to steadily increase during the discocyte-echinocyte-spherocyte transition, consistent with a steady decrease in physiological deformability of RBCs during this transition.
Figure 3.
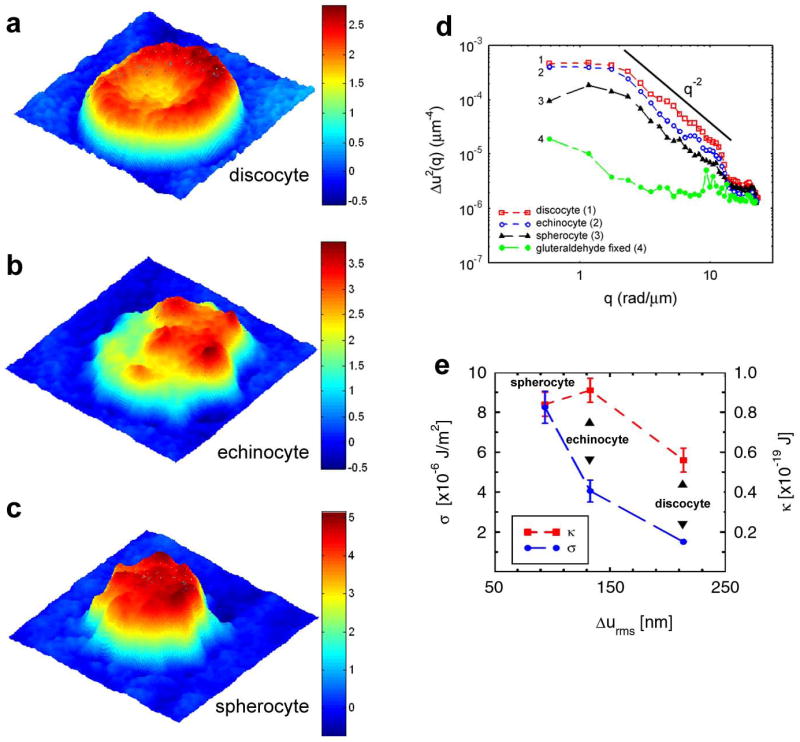
HPM images of representative discocytes (a), echinocytes (b), and spherocytes (c). The color bars show cell thickness in microns. (d) Mean squared displacements for the three RBC morphologies show power law behavior as demonstrated by q−2 line. Background thermal motions are an order of magnitude less than active cells motions as seen in curve 4 (green circles) for gluteraldehyde-fixed cells. (e) Tension coefficient (σ) and bending modulus (κ) for the three RBC morphologies show a significant increase in tension coefficient (blue circles) during the discocyte-echinocyte-spherocyte transition, while the bending modulus (red squares) is less affected by shape change. Figure adapted from [9].
Dynamic behavior of membrane fluctuations: Temporal and spatial correlations
The DPM instrument is used to measure the spatial and temporal coherence of RBC membrane motions [12, Popescu, 2007 #158; 28]. As described above, DPM relies on measuring the spatial interference fringes created by the superposition of an image field from the sample and a uniform reference beam (Fig. 2). The quantitative phase image is obtained from a single recorded interferogram, which enables studying rapid phenomena [29]. The physical profile of the RBC as a function of time, h(x,y,t), is obtained using the RBC refractive index information to translate phase delay into cell height, h (Fig. 4a). For high resolution imaging using a 100X oil immersion objective (NA = 1.3), the transverse resolution (x-y plane) is 200 nm and the overall optical path-length stability (z-axis resolution) is less than 1 nm. In a typical experiment, quantitative phase images are recorded from freshly isolated red cells for 4 seconds at a rate of 128 frames per second.
Figure 4.
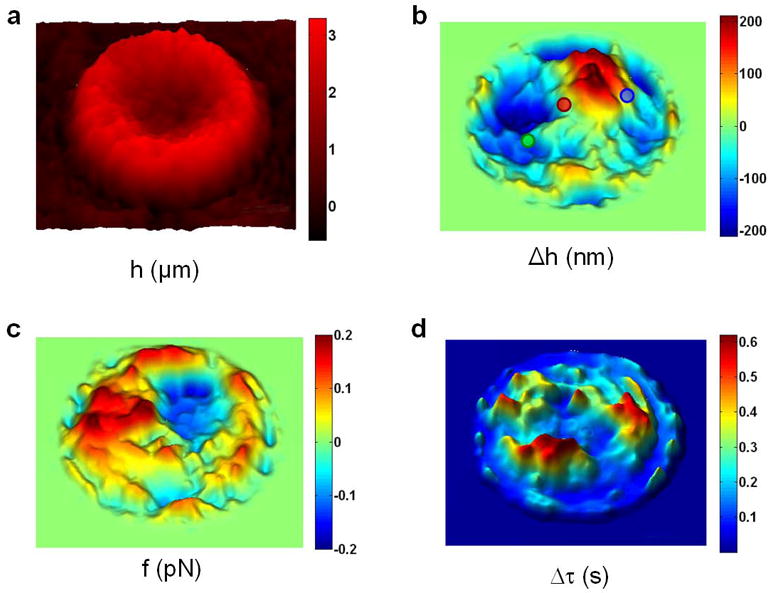
Dynamic images of RBCs provided by the DPM instrument. (a) Physical map of a normal RBC. (b) Instantaneous displacement map of the cells in panel a shows areas with relatively little displacement over time (red circle), while other areas show net positive (blue circle) or negative (green circle) displacement over the course of these measurement. (c) The instantaneous restoring force f and (d) the temporal (τ) coherence map reveal other spatially-resolved RBC dynamic quantities. The color bars show z-axis scale in respective units for each panel. Figure adapted from [17].
Fig. 4b shows the instantaneous membrane displacement map, Δh(x,y,t=0.5 sec), of the same RBC shown in Fig. 4a. Areas with a neutral Δh (such as red circle) show relatively little motion in the z-direction, while areas with positive (blue circle) or negative (green circle) Δh are highly dynamic in either direction. Approximating the membrane with a sheet of entropic springs, the equivalent elastic constant is measured as ke = kBT / 〈Δh2 〉, where kB is the Boltzmann constant and T the absolute temperature of the sample. Furthermore, the instantaneous restoring force may be calculated for each point on the image as f(x,y) = −ke Δh(x,y) (Fig. 4c). To our knowledge, this is the first demonstration of spatially-resolved RBC dynamic quantities.
The dynamic data obtained from RBCs can be further analyzed to calculate the membrane displacement autocorrelation function for every point on the cell [17]. The full width at half maximum (FWHM) of the autocorrelation function is then used to map the entire projected area of the cell as shown in Fig. 4d. This temporal coherence map is highly inhomogeneous and in some area reaches remarkably high values of up to 0.6 seconds. Note that all physical and dynamic data shown in Fig. 4 are calculated in a single experiment with no exogenous contrast and no cell contact.
In order to asses the spatial correlations associated with the membrane motions shown above, formalism of coherence in the space-frequency domain developed by Mandel and Wolf can be applied [17; 38; 39]. Thus, for each cell, one can calculate the cross-spectral density, W (ρ, ω), which is a measure of the spatial correlations between two points on a cell separated by a distance ρ at a particular frequency ω The function W provides the full information about spatio-temporal correlations of the membrane fluctuations. Using W as the weighting function, the transverse coherence length of the fluctuations, ρc(ω) can then be computed for each individual frequency (Fig. 5a). As demonstrated, the correlations at low frequencies develop over spatial regions of the order of the cell size. These long-range spatial correlations are presumed to be mediated by the cytoskeleton network.
Figure 5.
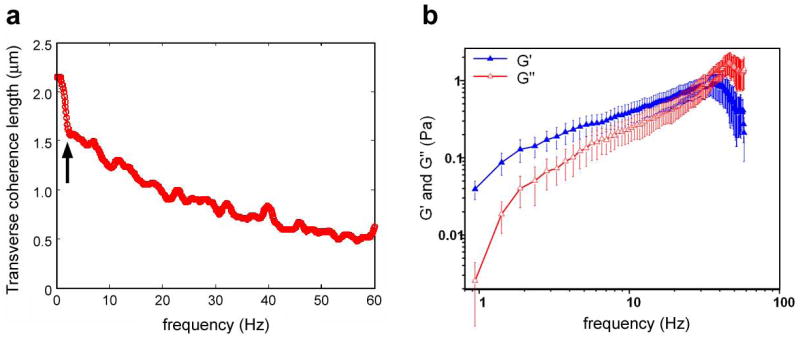
(a) Transverse coherence length of RBCs as a function of frequency. Note the sharp increase in coherence length below approximately 2 Hz (arrow), which may be related to active ATP-mediated motions in this regime. (b) Measured viscoelastic moduli of RBCs. Spatialy averaged loss (G″) and storage (G′) moduli are extracted as a function of frequency. Figure adapted from [17].
Interestingly, the transverse coherence length shows a relatively sharp increase below approximately 2 Hz (Fig. 5a, arrow). This behavior appears to support the previously observed phenomenon of ATP-mediated contributions to motion at low frequencies [40]. In addition, our previous measurements of membrane fluctuations over longer time scales (minutes) revealed dominant frequencies which may also suggest deterministic motions [10]. These results are collectively compatible with earlier measurements of ATP-dependent RBC motions by Korenstein and co-workers [40; 41]. However, direct studies of these specific and deterministic motions are necessary before definitive conclusions can be reached about their biochemical nature and cellular origin.
Finally, we propose that the above coherence properties can be interpreted as the result of the viscoelastic properties of the cell membrane. Thus, modeling the cell membrane as a continuous elastic sheet under the influence of surface tension and bending forces, we extract the storage (G′) and loss (G″) moduli associated with the RBC membrane [17]. The results for a group of 15 RBCs are summarized in Fig. 5b. The frequency behavior of these moduli is similar to that obtained in polymer solutions, which is consistent with the proposed hypothesis that the spectrin network of the membrane cytoskeleton is responsible for the overall shear resistance of the RBC membrane [42]. We have further postulated that the normal RBC membrane is a viscoelastic fluid [17], and studies currently underway aim to characterize changes in membrane viscoelastic properties for abnormal RBC morphologies and under various disease conditions.
Tomographic phase microscopy (TPM)
The information provided by the quantitative phase microscopes described above is an “optical depth,” which is determined by the line integral of the refractive index and the optical path length. Details of the axial (z-axis) sample structures are averaged due to this integration. For homogenous samples such as RBCs, this integral readily translates into cell thickness, thus enabling various mechanical and dynamical measurements detailed above. The assumption of structural homogeneity, however, is not valid for more complex samples such as nucleated cells or RBCs containing cytoplasmic inclusion (such as parasites). Under these circumstance, 3-dimensional quantitative phase images are necessary to adequately characterize the sample.
To obtain the 3-dimensional structure of a cell, refractive index and length must be disentangled. In order to accomplish this goal, we recently developed a tomographic phase microscopy (TPM) technique [20; 21]. TPM is analogous to the familiar medical technique of computed tomography (CT), which uses x-ray tissue absorption to image the interior structures of the body. In contrast to CT, TPM uses light waves rather than x-rays, and variations in refractive index rather than absorption to provide structural maps. Using an algorithm similar to CT, refractive index is separated from optical path length by analyzing quantitative phase data taken simultaneously over many angles of illumination. Combining the power of interferometric phase microscopy with tomographic reconstruction algorithms, 3-dimensional physical maps of cells are constructed with exquisite accuracy and detail (Fig. 6). Biological applications of TPM are still in the early stages of development, but the methodology provided by this technique provides a powerful new approach for non-invasive imaging of live cell structure and dynamics.
Figure 6.
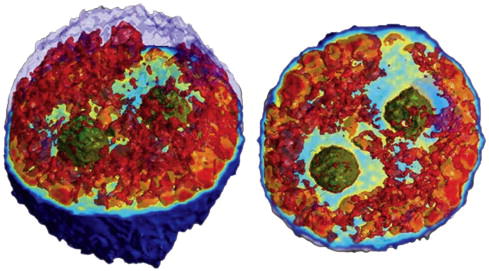
Tomographic phase image of a live HeLa cell shows successful deconvolution of refractive index and optical path length to reveal internal structures of the cell. In these two different views of a rendered 3-dimensional image, the outermost layer of the upper hemisphere of the cell is removed to enable visualization of the internal structures. In addition, nucleoli are pseudo-colored green and cytoplasmic structures with refractive index higher than 1.36 are pseudo-colored red to provide visual contrast. The complete data set is a refractive index map of the internal cell structures up to 4 significant figures with submicron resolution. Figure adapted from [20].
Discussion
RBC membrane fluctuations have been studied for nearly a century, as they offer a window into understanding the structure, dynamics, and function of this unique cell. Among the variety of experimental approaches available for study of cell mechanical properties [43], optical microscopic techniques stand out as they enable collecting mechanical and dynamical data without physical contact with the sample. Moreover, since optical techniques can be extended into wide area imaging mode, these methods are ideally suited for high-throughput dynamical studies of live cells. Nevertheless, this has proven to be an experimentally challenging task, as most biologically relevant membrane motions occur at the nanometer and millisecond scales.
Over the past several decades, multiple optical methods have been used to study RBC mechanical properties. Phase contrast microscopy was used to study spatially-resolved RBC fluctuations [44; 45]. However, the phase contrast method is qualitative by nature, thus preventing full-field quantitative measurements. Reflection interference contrast (RIC) microscopy was developed to quantify the thermally-induced fluctuations of the erythrocyte membrane, but RIC is quantitative only in certain limiting situations [46; 47]. Fluorescence interference contrast (FLIC) microscopy relies on inferring the position of fluorescent dye molecules attached to the membrane from the absolute fluorescence intensity, and requires exogenous fluorescent markers by nature [48; 49]. Point dark field microscopy has been used to demonstrate the effect of ATP on RBC membrane dynamics [40], but this technique only allows point measurements and is not suitable for studying spatial behavior of membrane fluctuations. In this report, we have presented several phase microscopy methods that enable full-field quantitative imaging of RBC dynamics with high sensitivity and at arbitrary time scales from milliseconds to hours.
Using FPM, which is a highly stable common-path interferometric method, we have measured spatially-resolved, low-frequency fluctuations across the RBC [31]. These relatively slow motions, which appear to be confined to specific subcellular domains, have not been described before, and their physiological mechanism is unclear at this time. HPM, in contrast, is a single-shot full-field technique which provides spatially-resolved quantitative phase information at the millisecond scale [13; 29]. Using a stabilized HPM system, we have quantified the nanoscale thermal fluctuations of live RBCs [9]. These measurements revealed a nonvanishing tension coefficient, which increases as cells transition from a normal discocytic shape to a spherical shape (Fig. 3). These findings are consistent with the common knowledge that discoid red cells have maximum mechanical flexibility, while more rigid forms such as spherocytes or elliptocytes exhibit less flexibility in microcirculation and are therefore more susceptible to mechanical damage. Furthermore, we have shown that the tension coefficient for RBC’s is significantly larger than giant unilamellar vesicles of comparable size, consistent with the cytoskeleton confinement model, in which the cytoskeleton hinders membrane fluctuations [9; 36].
DPM (Fig. 2) can be essentially considered a hybrid instrument that combines the common-path geometry of FPM and the single shot capability of HPM, allowing fast and stable quantitative phase imaging [12]. In addition, DPM can be readily combined with other microscopy methods, thus enabling multimodal microscopy [28; 34]. We have successfully used the DPM instrument to extract spatially resolved dynamical properties of live RBCs (Figs. 4–5). The results reveal significant properties of temporal and spatial coherence associated with RBCs. Furthermore, we show that these correlations can be accounted for by the viscoelastic properties of the cell, and we extract the loss and storage moduli. Compared with other methods of extracting cell viscoelastic properties such as pipette aspiration [50], electric field deformation [51], optical tweezers [52], dynamic scattering microscopy [34], and magnetic beam excitation [53], DPM measurements have the distinct advantage of being non-contact, non-invasive, and operate in the imaging mode.
Perhaps the most significant limitation of FPM, HPM, and DPM is the fact that they measure the line integral of the refractive index and the optical path length, thus effectively losing structural details in the z-direction. As discussed earlier, this is not a limitation for structurally homogenous samples such as RBCs, but it limits application on these techniques in more complicated cell types. Combination of DPM with light scattering in a method called dynamic scattering microscopy (DSM) enable measurement of cell membrane dynamical properties in all cell types, but unlike DPM, this method requires the use of exogenous microbeads [34]. In order to fundamentally overcome this limitation, however, we have recently developed instrumentation and methods for tomographic phase microscopy or TPM [20; 21]. The TPM method enables disentangling the refractive index information from optical path length, thus providing detailed structural information without exogenous contrast (Fig. 6). Work in progress aims to extend dynamical studies of cell structures to 3-dimension using TPM and its future generations.
In summary, we believe that novel field-based microscopy techniques will soon replace conventional phase contrast methods for biological imaging. In particular, we have demonstrated the feasibility and power of these new methods in characterizing RBC dynamics. Given they are fast, non-contact, non-invasive and require no specific cell preparation, we believe that these methods will for the first time provide an opportunity for high-throughput analysis and study of RBC mechanical properties in health and disease.
Acknowledgments
This work was carried out at the MIT Laser Biomedical Research Center with support from the National Institutes of Health (P41-RR02594) and the Hamamatsu Photonics, K.K.
This paper is based on a presentation given at the Red Cell Conference held at Harvard Medical School in Boston, Massachusetts, October 27–28, 2007.
Footnotes
Publisher's Disclaimer: This is a PDF file of an unedited manuscript that has been accepted for publication. As a service to our customers we are providing this early version of the manuscript. The manuscript will undergo copyediting, typesetting, and review of the resulting proof before it is published in its final citable form. Please note that during the production process errors may be discovered which could affect the content, and all legal disclaimers that apply to the journal pertain.
References
- 1.Dunn GA, Zicha D. Phase-shifting interference microscopy applied to the analysis of cell behaviour. Symp Soc Exp Biol. 1993;47:91–106. [PubMed] [Google Scholar]
- 2.Zicha D, Dunn GA. An Image-Processing System For Cell Behavior Studies In Subconfluent Cultures. J Microscopy. 1995;179:11–21. [Google Scholar]
- 3.Paganin D, Nugent KA. Noninterferometric phase imaging with partially coherent light. Phys Rev Lett. 1998;80:2586–2589. [Google Scholar]
- 4.Allman BE, McMahon PJ, Tiller JB, Nugent KA, Paganin D, Barty A, McNulty I, Frigo SP, Wang YX, Retsch CC. Noninterferometric quantitative phase imaging with soft x rays. J Opt Soc Am A-Opt Image Sci Vis. 2000;17:1732–1743. doi: 10.1364/josaa.17.001732. [DOI] [PubMed] [Google Scholar]
- 5.Bajt S, Barty A, Nugent KA, McCartney M, Wall M, Paganin D. Quantitative phase-sensitive imaging in a transmission electron microscope. Ultramicroscopy. 2000;83:67–73. doi: 10.1016/s0304-3991(99)00174-6. [DOI] [PubMed] [Google Scholar]
- 6.Mann CJ, Yu LF, Lo CM, Kim MK. High-resolution quantitative phase-contrast microscopy by digital holography. Opt Express. 2005;13:8693–8698. doi: 10.1364/opex.13.008693. [DOI] [PubMed] [Google Scholar]
- 7.Marquet P, Rappaz B, Magistretti PJ, Cuche E, Emery Y, Colomb T, Depeursinge C. Digital holographic microscopy: a noninvasive contrast imaging technique allowing quantitative visualization of living cells with subwavelength axial accuracy. Opt Lett. 2005;30:468–470. doi: 10.1364/ol.30.000468. [DOI] [PubMed] [Google Scholar]
- 8.Iwai H, Fang-Yen C, Popescu G, Wax A, Badizadegan K, Dasari RR, Feld MS. Quantitative phase imaging using actively stabilized phase-shifting low-coherence interferometry. Opt Lett. 2004;29:2399–401. doi: 10.1364/ol.29.002399. [DOI] [PubMed] [Google Scholar]
- 9.Popescu G, Ikeda T, Goda K, Best-Popescu CA, Laposata M, Manley S, Dasari RR, Badizadegan K, Feld MS. Optical measurement of cell membrane tension. Phys Rev Lett. 2006;97:218101. doi: 10.1103/PhysRevLett.97.218101. [DOI] [PubMed] [Google Scholar]
- 10.Popescu G, Badizadegan K, Dasari RR, Feld MS. Observation of dynamic subdomains in red blood cells. J Biomed Opt. 2006;11:059802. doi: 10.1117/1.2221867. [DOI] [PubMed] [Google Scholar]
- 11.Lue N, Popescu G, Ikeda T, Dasari RR, Badizadegan K, Feld MS. Live cell refractometry using microfluidic devices. Opt Lett. 2006;31:2759–61. doi: 10.1364/ol.31.002759. [DOI] [PubMed] [Google Scholar]
- 12.Popescu G, Ikeda T, Dasari RR, Feld MS. Diffraction phase microscopy for quantifying cell structure and dynamics. Opt Lett. 2006;31:775–7. doi: 10.1364/ol.31.000775. [DOI] [PubMed] [Google Scholar]
- 13.Popescu G, Ikeda T, Best CA, Badizadegan K, Dasari RR, Feld MS. Erythrocyte structure and dynamics quantified by Hilbert phase microscopy. J Biomed Opt. 2005;10:060503. doi: 10.1117/1.2149847. [DOI] [PubMed] [Google Scholar]
- 14.Fang-Yen C, Chu MC, Seung HS, Dasari RR, Feld MS. Phase-referenced probe interferometer for biological surface profiling and displacement measurements. Rev Sci Instrum. 2007;78:123703. doi: 10.1063/1.2823976. [DOI] [PubMed] [Google Scholar]
- 15.Lue N, Choi W, Popescu G, Ikeda T, Dasari RR, Badizadegan K, Feld MS. Quantitative phase imaging of live cells using fast Fourier phase microscopy. Appl Opt. 2007;46:1836–42. doi: 10.1364/ao.46.001836. [DOI] [PubMed] [Google Scholar]
- 16.Lue N, Bewersdorf J, Lessard MD, Badizadegan K, Dasari RR, Feld MS, Popescu G. Tissue refractometry using Hilbert phase microscopy. Opt Lett. 2007;32:3522–4. doi: 10.1364/ol.32.003522. [DOI] [PMC free article] [PubMed] [Google Scholar]
- 17.Popescu G, Park Y, Dasari RR, Badizadegan K, Feld MS. Coherence properties of red blood cell membrane motions. Phys Rev E Stat Nonlin Soft Matter Phys. 2007;76:031902. doi: 10.1103/PhysRevE.76.031902. [DOI] [PubMed] [Google Scholar]
- 18.Park Y, Popescu G, Badizadegan K, Dasari RR, Feld MS. Fresnel particle tracing in three dimensions using diffraction phase microscopy. Opt Lett. 2007;32:811–3. doi: 10.1364/ol.32.000811. [DOI] [PubMed] [Google Scholar]
- 19.Fang-Yen C, Oh S, Park Y, Choi W, Song S, Seung HS, Dasari RR, Feld MS. Imaging voltage-dependent cell motions with heterodyne Mach-Zehnder phase microscopy. Opt Lett. 2007;32:1572–4. doi: 10.1364/ol.32.001572. [DOI] [PubMed] [Google Scholar]
- 20.Choi W, Fang-Yen C, Badizadegan K, Oh S, Lue N, Dasari RR, Feld MS. Tomographic phase microscopy. Nat Methods. 2007;4:717–9. doi: 10.1038/nmeth1078. [DOI] [PubMed] [Google Scholar]
- 21.Choi W, Fang-Yen C, Badizadegan K, Dasari RR, Feld MS. Extended depth of focus in tomographic phase microscopy using a propagation algorithm. Opt Lett. 2008 doi: 10.1364/ol.33.000171. in press. [DOI] [PMC free article] [PubMed] [Google Scholar]
- 22.Chabanel A, Flamm M, Sung KL, Lee MM, Schachter D, Chien S. Influence of cholesterol content on red cell membrane viscoelasticity and fluidity. Biophys J. 1983;44:171–6. doi: 10.1016/S0006-3495(83)84288-X. [DOI] [PMC free article] [PubMed] [Google Scholar]
- 23.Nash GB, Gratzer WB. Structural determinants of the rigidity of the red cell membrane. Biorheology. 1993;30:397–407. doi: 10.3233/bir-1993-305-611. [DOI] [PubMed] [Google Scholar]
- 24.Sleep J, Wilson D, Simmons R, Gratzer W. Elasticity of the red cell membrane and its relation to hemolytic disorders: an optical tweezers study. Biophys J. 1999;77:3085–95. doi: 10.1016/S0006-3495(99)77139-0. [DOI] [PMC free article] [PubMed] [Google Scholar]
- 25.Mills JP, Qie L, Dao M, Lim CT, Suresh S. Nonlinear elastic and viscoelastic deformation of the human red blood cell with optical tweezers. Mech Chem Biosyst. 2004;1:169–80. [PubMed] [Google Scholar]
- 26.Zernike F. How I discovered phase contrast. Science. 1955;121:345–9. doi: 10.1126/science.121.3141.345. [DOI] [PubMed] [Google Scholar]
- 27.Smith FH. Microscopic interferometry. Research (London) 1955;8:385. [Google Scholar]
- 28.Park YK, Popescu G, Badizadegan K, Dasari RR, Feld MS. Diffraction phase and fluorescence microscopy. Opt Exp. 2006;14:8263. doi: 10.1364/oe.14.008263. [DOI] [PubMed] [Google Scholar]
- 29.Ikeda T, Popescu G, Dasari RR, Feld MS. Hilbert phase microscopy for investigating fast dynamics in transparent systems. Opt Lett. 2005;30:1165–7. doi: 10.1364/ol.30.001165. [DOI] [PubMed] [Google Scholar]
- 30.Ahn A, Yang C, Wax A, Popescu G, Fang-Yen C, Badizadegan K, Dasari RR, Feld MS. Harmonic phase-dispersion microscope with a Mach-Zehnder interferometer. Appl Opt. 2005;44:1188–90. doi: 10.1364/ao.44.001188. [DOI] [PubMed] [Google Scholar]
- 31.Popescu G, Deflores LP, Vaughan JC, Badizadegan K, Iwai H, Dasari RR, Feld MS. Fourier phase microscopy for investigation of biological structures and dynamics. Opt Lett. 2004;29:2503–5. doi: 10.1364/ol.29.002503. [DOI] [PubMed] [Google Scholar]
- 32.Kadono H, Ogusu M, Toyooka S. Phase shifting common path interferometer using a liquid-crystal phase modulator. Opt Commun. 1994;110:391–400. [Google Scholar]
- 33.Ng AY, See CW, Somekh MG. Quantitative optical microscope with enhanced resolution using a pixelated liquid crystal spatial light modulator. J Microsc. 2004;214:334–40. doi: 10.1111/j.0022-2720.2004.01323.x. [DOI] [PubMed] [Google Scholar]
- 34.Amin MS, Park Y, Lue N, Dasari RR, Badizadegan K, Feld MS, Popescu G. Microrheology of red blood cell membranes using dynamic scattering microscopy. Optics Express. 2007;15:17001–9. doi: 10.1364/oe.15.017001. [DOI] [PubMed] [Google Scholar]
- 35.Gov N, Zilman A, Safran S. Cytoskeleton confinement of red blood cell membrane fluctuations. Biophys J. 2003;84:486A–486A. [Google Scholar]
- 36.Gov N, Zilman AG, Safran S. Cytoskeleton confinement and tension of red blood cell membranes. Phys Rev Lett. 2003;90:228101. doi: 10.1103/PhysRevLett.90.228101. [DOI] [PubMed] [Google Scholar]
- 37.Lim HWG, Wortis M, Mukhopadhyay R. Stomatocyte-discocyte-echinocyte sequence of the human red blood cell: evidence for the bilayer- couple hypothesis from membrane mechanics. Proc Natl Acad Sci U S A. 2002;99:16766–9. doi: 10.1073/pnas.202617299. [DOI] [PMC free article] [PubMed] [Google Scholar]
- 38.Mandel L, Wolf E. Coherence Properties of Optical Fields. Reviews Of Modern Physics. 1965;37:231. [Google Scholar]
- 39.Mandel L, Wolf E. Optical coherence and quantum optics. Cambridge University Press; Cambridge: 1995. [Google Scholar]
- 40.Levin S, Korenstein R. Membrane fluctuations in erythrocytes are linked to MgATP-dependent dynamic assembly of the membrane skeleton. Biophys J. 1991;60:733–7. doi: 10.1016/S0006-3495(91)82104-X. [DOI] [PMC free article] [PubMed] [Google Scholar]
- 41.Tuvia S, Levin S, Bitler A, Korenstein R. Mechanical fluctuations of the membrane-skeleton are dependent on F-actin ATPase in human erythrocytes. J Cell Biol. 1998;141:1551–1561. doi: 10.1083/jcb.141.7.1551. [DOI] [PMC free article] [PubMed] [Google Scholar]
- 42.Popescu G, Dogariu A, Rajagopalan R. Spatially resolved microrheology using localized coherence volumes. Phys Rev E. 2002;65:041504. doi: 10.1103/PhysRevE.65.041504. [DOI] [PubMed] [Google Scholar]
- 43.Bao G, Suresh S. Cell and molecular mechanics of biological materials. Nature Mat. 2003;2:715–725. doi: 10.1038/nmat1001. [DOI] [PubMed] [Google Scholar]
- 44.Brochard F, Lennon JF. Frequency spectrum of the flicker phenomenon in erythrocytes. J Physique. 1975;36:1035–1047. [Google Scholar]
- 45.Zeman K, Engelhard H, Sackmann E. Bending undulations and elasticity of the erythrocyte membrane: effects of cell shape and membrane organization. Eur Biophys J. 1990;18:203–19. doi: 10.1007/BF00183373. [DOI] [PubMed] [Google Scholar]
- 46.Zilker A, Engelhardt H, Sackmann E. Dynamic Reflection Interference Contrast (Ric-) Microscopy - A New Method To Study Surface Excitations Of Cells And To Measure Membrane Bending Elastic-Moduli. J Physique. 1987;48:2139–2151. [Google Scholar]
- 47.Zilker A, Ziegler M, Sackmann E. Spectral-Analysis Of Erythrocyte Flickering In The 0.3–4-Mu-M-1 Regime By Microinterferometry Combined With Fast Image-Processing. Phys Rev A. 1992;46:7998–8002. doi: 10.1103/physreva.46.7998. [DOI] [PubMed] [Google Scholar]
- 48.Kaizuka Y, Groves JT. Hydrodynamic damping of membrane thermal fluctuations near surfaces imaged by fluorescence interference microscopy. Phys Rev Lett. 2006;96:118101. doi: 10.1103/PhysRevLett.96.118101. [DOI] [PubMed] [Google Scholar]
- 49.Lambacher A, Fromherz P. Luminescence of dye molecules on oxidized silicon and fluorescence interference contrast microscopy of biomembranes. J Opt Soc Am B. 2002:1435–53. [Google Scholar]
- 50.Discher DE, Mohandas N, Evans EA. Molecular maps of red cell deformation: hidden elasticity and in situ connectivity. Science. 1994;266:1032–5. doi: 10.1126/science.7973655. [DOI] [PubMed] [Google Scholar]
- 51.Engelhardt H, Gaub H, Sackmann E. Viscoelastic properties of erythrocyte membranes in high-frequency electric fields. Nature. 1984;307:378–80. doi: 10.1038/307378a0. [DOI] [PubMed] [Google Scholar]
- 52.Dao M, Lim CT, Suresh S. Mechanics of the human red blood cell deformed by optical tweezers. Journal of the Mechanics and Physics of Solids. 2003;51:2259–2280. [Google Scholar]
- 53.Deng LH, Trepat X, Butler JP, Millet E, Morgan KG, Weitz DA, Fredberg JJ. Fast and slow dynamics of the cytoskeleton. Nature Materials. 2006;5:636–640. doi: 10.1038/nmat1685. [DOI] [PubMed] [Google Scholar]