

Abstract
Ser/Thr protein phosphatase 5 (PP5) regulates several signaling-cascades that suppress growth and/or facilitate apoptosis in response to genomic stress. The expression of PP5 is responsive to hypoxia inducible factor-1 (HIF-1) and estrogen, which have both been linked to the progression of human breast cancer. Still, it is not clear if PP5 plays a role in the development of human cancer. Here, immunostaining of breast cancer tissue-microarrays (TMAs) revealed a positive correlation between PP5 overexpression and ductal carcinoma in situ (DCIS; P value 0.0028), invasive ductal carcinoma (IDC; P value 0.012) and IDC with metastases at the time of diagnosis (P value 0.0001). In a mouse xenograft model, the constitutive overexpression of PP5 was associated with an increase in the rate of tumor growth. In a MCF-7 cell culture model overexpression correlated with both an increase in the rate of proliferation and protection from cell death induced by oxidative stress, UVC-irradiation, adriamycin, and vinblastine. PP5 overexpression had no apparent effect on the sensitivity of MCF-7 cells to taxol or rapamycin. Western analysis of extracts from cells over-expressing PP5 revealed a decrease in the phosphorylation of known substrates for PP5. Together, these studies indicate that elevated levels of PP5 protein occur in human breast cancer and suggest that PP5 overexpression may aid tumor progression.
Keywords: phosphatase, PP5, UVC, adriamycin, vinblastine, oxidative stress, MCF, 7 cells, cancer
1. Introduction
The reversible phosphorylation of proteins plays a key role in the regulation of many signaling networks that control cell growth, differentiation, senescence and programmed cell death (apoptosis) [1]. Protein phosphorylation occurs principally on serine, threonine and tyrosine residues, and >500 kinases that catalyze the phosphorylation of proteins have been identified in the human genome [2]. Protein dephosphorylation is catalyzed by protein phosphatases, and in humans there are three major types of protein phosphatases: tyrosine phosphatases (PTPases), serine/threonine phosphatases (PPases) and “dual specificity” phosphatases (DSPases). To date, the aberrant actions of several ‘key” protein kinases have been shown to promote or facilitate the development of human cancers, and in the last decade drugs to alter the actions of these kinases (i.e. trastuzumab, imatinib, bevacizumab, gefitinib and cetuximab) have been developed into new treatment options for the medical management of human cancers. In contrast, although ser/thr protein phosphatases have also been implicated in the regulation of many signal transduction cascades that control growth [3–6], relatively little is known about the roles played by individual phosphatases in the development or progression of human cancer.
In the last decade, serine/threonine phosphatase type 5 (PP5) has emerged as a potentially key regulator of cell growth. PP5 is found in association with several proteins that influence intracellular signaling cascades initiated by hormones (i.e. glucocorticoids) or cellular stress (i.e. hypoxia, oxidative stress and DNA-damage). In glucocorticoid signaling, the association of PP5 with the glucocorticoid receptor (GR)-heat shock protein-90 (Hsp-90) complex occurs in cells that have not encountered stress [7–9], and PP5 suppresses a GR-dependent signaling cascade leading to the phosphorylation of the p53 tumor suppressor protein [10–12]. Thus, PP5 appears to prevent the aberrant activation of basal p53 in cells that have not encountered genomic stress. In response to genomic stress, PP5 associates with several stress-induced protein complexes. The molecular events controlling the intracellular translocation of PP5 are not yet clear. Still, in response to either prolonged hypoxia or acute oxidative stress, PP5 binds to ASK1 (apoptosis signal-regulating kinase 1) [13, 14]. This interaction prevents the sustained activation of JNK (c-Jun-N-terminal kinase) and apoptosis by suppressing ASK1 dependent activation of MKK4 (Map-Kinase-Kinase-4) [13–15]. In response to DNA damage, PP5 binds to DNA-PKcs (DNA-dependent ser/thr protein kinase) [16], ATM (ataxia-telangiectasia mutated kinase) [17], and ATR (ATM/rad 3 related kinase) [18]. The interaction of PP5 with DNA-PKcs results in the dephosphorylation of a functional site on DNA-PKcs (thr2609), suggesting PP5 acts as a negative regulator of DNA-PKcs [16]. In contrast, in ATM- and ATR-signaling PP5 appears to function as a positive regulator, for the suppression of PP5 expression prevents ATM/ATR-mediated G-1 growth arrest [17]. PP5 has also been reported to negatively regulate Raf-1, with PP5 mediated dephosphorylation of Ser338 inhibiting Raf-1 activity and down stream signaling to MEK [19, 20]. Together, these studies suggest that PP5 is a potentially important regulator of signaling networks that allow a cell to respond appropriately to growth factors and stress.
In humans PP5 is expressed in most, if not all, tissues. Studies into the mechanisms controlling the expression of PP5 indicate that it is transcriptionally responsive to 17 β-estradiol (E2) [21, 22] and the activation of hypoxia inducible factor-1 (HIF-1), which have both been associated with the aggressive development of human breast cancer [23, 24]. In culture, the constitutive over expression of PP5 allows estrogen-dependent MCF-7 cells to grow in estrogen depleted media [21]. Here, PP5 protein levels are compared in samples of human tumor tissue and breast epithelium from non-malignant tissue, revealing a positive correlation between PP5 expression and human breast cancer. The consequences of sustained PP5 overexpression in a normal estrogen environment were also assessed using a xenograft mouse model, and the effects of PP5 overexpression on cellular responses to stress are studied in human breast adenocarcinoma (MCF-7) cell lines that constitutively express high levels of PP5.
2. Materials and methods
2.1 Materials
Tissue culture medium was purchased from Gibco™ (Invitrogen Corporation). t-butyl-hydroperoxide, and monoclonal anti-actin antibodies (AC-40) were purchased from Sigma. Adriamycin (doxorubicin) was purchased from Calbiochem. Antibodies recognizing p38, c-Jun and proteins phosphorylated at specific sites [c-Jun at Ser63; SEK1/MKK4 at Thr261; p38 MAPK (Thr180/Tyr182), p44/p42-MAPK/ERK1/2 (Thr202/Tyr204), JNK (Thr183/Tyr185)] and anti Poly (ADP-ribose) polymerase (PARP) antibody were purchased from Cell Signaling (Beverly, MA). Rabbit polyclonal antibodies recognizing PP5 were generated against a synthetic 15-amino acid peptide identical to a C-terminal region of PP5 [10, 11]. Rabbit polyclonal antibodies recognizing GFP and PP5 monoclonal antibodies were purchased from BD-Biosciences-Clontech.
2.2 Cell Culture
Human MCF-7 breast carcinoma cell lines were obtained from the American Type Tissue Collection. MCF-7 cells were cultured in Dulbecco’s modified Eagle’s medium containing L-Glutamine (DMEM) supplemented with 10% bovine-serum, streptomycin (0.1μg/ml) and penicillin (100 units/ml). All cell cultures were routinely passed when 85–90% confluent unless indicated otherwise.
2.3 Transient Transfections
Cell transfection assays were conducted as described previously [10, 11]. Briefly, cells were plated at a density of 5 × 10⁵ cells/60-mm tissue culture dish and incubated overnight in DMEM supplemented with 10% FCS. After ~24 hours the cells were transfected with 2.0 μg of plasmid DNA using Lipofectamine (Invitrogen).
2.4 Construction of Stable Cell Lines Over-Expressing PP5
MCF-7-PP5h1 cells in which the expression of human PP5 is regulated by tetracycline-responsive promoter and operator system were developed by stable transfection of MCF-7 Tet-Off cells (Clontech, Palo Alto, CA) with a pBI-derived plasmid encoding full length human PP5. Tetracycline-inducible PP5 expression in MCF-7-PP5h1 cells has been characterized previously [21]. MCF-7 cell lines that constitutively express a PP5 c-terminal EGFP fusion-protein (i.e. MCF-7-PP5s and MCF-7-PP5j) were generated by subcloning human PP5 into the pEGFP-N1 expression vector (Clontech) and transfecting into MCF-7 cells. EGFP-control cell lines were produced by transfecting MCF-7 cells with the pEGFP-N1 plasmid. Plasmid uptake was facilitated by electroporation (Gene Pulser II, Bio Rad Labs) as follows: 1 × 10⁶ cells were suspended in 160 μls of DMEM medium with 10 μgs of plasmid in 4 mm gap cuvettes and subjected to a modified long-duration procedure (max μF cap, 500V, repeated pulses for a total time of 10 msecs). Transfected cells were incubated for 48 hours in 100 mm plates until they were 80–90% confluent. Stably transfected cells were generated by selection with 0.6 mg/mL of Geneticin™. Several clones expressing PP5-EGFP or EGFP produced via separate transfections were isolated and then propagated. PP5 levels in the cell lines were characterized by western and FACS analysis.
2.5 Western Blotting
Cells grown in 60 mm plates were washed twice with ice-cold phosphate-buffered saline (PBS) and then lysed by scraping in 250 μl of lysis buffer [0.25M Tris-HCl/0.2% SDS, pH 6.8, 20% glycerol, 4% SDS, 1mM NaF, 10 mM β-glycerol phosphate, and 1μl/ml protease inhibitor cocktail (Sigma)]. Lysates were clarified by centrifugation at 13,000 × g for 5 min, and an aliquot of the supernatant was removed for protein determination. Protein concentrations were determined using a Bio-Rad Dc protein assay, using bovine serum albumin (BSA) for standards. The remaining supernatant was added to an equal volume of 2x sample buffer (120 mM Tris-HCl, pH 7.4, 200 mM dithiothreitol, 20% glycerol, 4% SDS, and 0.02% bromphenol blue). Typically, 25–30 μg of protein was then separated by electrophoresis on 10% SDS-polyacrylamide gels. Proteins were then electrophoretically transferred to Immobilon-P (Millipore Corporation) and placed in blocking buffer [Tris-HCl, pH 7.4,150 mM NaCl and 5% nonfat milk or 5% BSA with Tween-20 (TBS-T)] for 1 hour. Immunoblotting was performed with the indicated primary antibody using either goat anti-mouse (Pharmingen, San Diego, CA) or goat anti-rabbit secondary (Promega, Madison, WI) antibodies. Antibody association was detected employing Super Signal West Dura (Pierce) Western blotting detection reagents following the protocols of the manufacturer. Quantification of the signal was achieved using a Fuji-LAS-1000 imaging system.
2.6 Monitoring Tumor Growth in vivo
Cells (Control, MCF-7-PP5s or MCF-7-PP5j) were grown to 80–90% confluence, detached from the dish with 2 mM EDTA, and washed with cold PBS. Aliquots were then counted using a hemacytometer and each cell line was resuspended in ice-cold HBSS to a final concentration of 1.2 × 10⁷ cells/ml. The cell suspensions (100 μl) were injected into exposed axillary mammary fat pads of anaesthetized (Ketamine 80 mg/kg, Xylazine 14 mg/kg) 4–5 weeks old, female athymic mice. Tumor size was measured weekly by taking orthogonal measurements and was expressed as mean tumor diameter. Mean tumor diameter was calculated by taking the square root of the product of orthogonal measurements as described previously [25]. Animals were maintained under the guidelines of the National Institute of Health and the University of South Alabama. All protocols were approved by the Institutional Animal Care and Use Committee (IACUC). Food and water were provided ad libitum.
2.7 UVC Treatment
Cells were plated at 3 × 10⁵ cells per 60 mm dish and grown overnight. The dishes were washed with PBS. The PBS was removed and the plates were exposed to the indicated amount of UVC by placing the plates in a Class II A/B3 Biological Safety Cabinet (Forma Scientific) with a 60w UV light. UVC exposure was measured using a Multi-Sense 100 UV monitor equipped with an MP-125UV-C sensor (UVP, Cambridge, UK).
2.8 Confocal Image Analysis
Samples were fixed in methanol and examined using a Leica TCS SP2 system equipped with Argon and Krypton lasers. Confocal images were visualized with a 63 × oil objective and twenty optical sections were analyzed per cell.
2.9 Tissue Microarrays (TMAs)
Tissue microarray slides were obtained from the Cooperative Breast Cancer Tissue Resource (CBCTR; National Cancer Institute). Each TMA contains 252 normal breast and breast cancer cores and 36 additional controls. The cores appearing on each TMA block include: 1) node-negative breast cancer (64 cores), 2) node-positive breast cancer (64 cores), 3) metastatic breast cancer (64 cores), 4) ductal carcinoma in situ [DCIS; 20 cores (10 from individuals without an invasive disease component and 10 from individuals with invasive disease represented elsewhere on the TMA)], 5) normal Breast tissue (40 cores; 20 from individuals without breast cancer and 20 cores of normal adjacent tissue from individuals with breast cancer represented elsewhere on the TMA). The 36 control cores appearing on each TMA block include normal non-breast tissue (16 cores; 4 from each of the following tissue types: kidney, endometrium, prostate and appendix) and human cell lines (20 cores; 5 cores from each of the following cell lines: HT-29, PC-3, MCF-7 and T-47D).
2.10 Immunohistochemistry
To visualize PP5 in fixed tissue, after deparaffinization and rehydration endogenous peroxidase activity was blocked by placing the samples in methanol containing 0.3% hydrogen peroxide for 30 minutes. For antigen recovery, the tissue sections were placed in a coplin jar containing citrate buffer (pH 6.0), and the jar was placed in a steamer and heated (95°C) for 20 minutes. Prior to incubation with the primary antibody the samples were subjected to a 20-minute cool off period. Then the tissue sections were loaded onto a Dako autostainer, where it was incubated with PP5 monoclonal antibody (BD Biosciences), washed and visualized. Visualization was achieved using the LSAB+ (LASB, HRP; labeled streptavidin-biotin, horseradish peroxidase) visualization system from DakoCytomation (Carpinterias, CA). The cells were then counterstained with Mayer’s Hematoxylin.
2.11 Fluorescence Activated Cell Sorting (FACS) and Analysis of Cell Growth
FACS analysis was achieved using Vantage SE flow cytometer (Becton Dickinson Immunocytometry Systems, BDIS, San Jose, CA) employing pulse processing (FL2-width and FL2-area) to gate out cell doublets and ModFitLT cell cycle analysis software (Verity Software House, Topsham, ME). Propidium Iodine (PI) fluorescence was excited at 488 nm with an argon laser (Spectra Physics, Sunnyvale, CA) and fluorescence emission was collected with a 582/42 BP filter in front to the FL2 detector. Detection of GFP (green fluorescence; FL1) for cell sorting was measured using a 530/30 nm band pass filter. Multivariate data acquisition and analysis was performed with BDIS Cell Quest software.
2.12 Cell Proliferation
Cell numbers were routinely determined by counting the number of cells using a Coulter Counter™ (Z1). For these experiments the indicated types of cells were plated at an equal density in 60 mm tissue culture plates, with the number of plates used sufficient for duplicate or triplicate measurements at each time point, including time zero plates (to detect inconsistencies in initial plating density). At the times indicated, the cells were detached from the dish by brief treatment with trypsin, and the number of cells were counted using a Z1 coulter Counter. The survival of cells was also assessed using a metabolic assay, ViaLight Plus cell proliferation kit (Cambrex), according to the instructions provided by the manufacturer.
2.13 Statistical Methods
To evaluate whether the frequency of specimens with the elevated levels of PP5 increased during breast carcinogenesis, the Fisher’s exact test was employed, grouping the results as normal, invasive cancer, invasive node negative, invasive node positive, and invasive with distant metastases. P values of less than 0.05 were regarded as statistically significant.
3. Results
3.1 Elevated PP5 Protein Levels in Human Breast Cancer
Western analysis comparing PP5 protein levels in samples of freshly isolated human tumors (diagnosed as invasive ductal carcinomas with metastatic lesions at the time of diagnosis) and samples of ductal epithelial tissue (obtained from patients undergoing breast reduction surgery and demonstrating no indication of disease) revealed elevated levels of PP5 in the tumors. Similarly, analysis of same-patient samples (comparing infiltrating ductal carcinomas from breast and normal adjacent breast epithelium) revealed an increase in PP5 protein levels in the tumor tissue (supplied as supplemental data, Fig. 1S). These initial observations suggest that PP5 levels may be elevated in human breast cancer. To determine if the expression of PP5 indeed correlates with the development of human breast cancer, tissue micro-arrays (TMAs) were obtained from the Cooperative Breast Cancer Tissue Resource (CBCTR; National Cancer Institute). For these studies Breast Tissue Progression TMAs were employed, which were designed by NCI statisticians to provide high statistical power for studies of stage specific markers of breast cancer. Each array consists of 288 cores (0.6 mm) taken from paraffin-embedded specimens that represent 212 breast cancer and 40 normal breast specimens (20 cores from individuals without breast cancer and 20 cores of normal adjacent tissue from individuals with breast cancer), along with 36 controls (normal non-breast cancer and human cell lines). All of the invasive cases are primary breast cancers with a principal histology of ductal carcinoma, and the TMAs contain samples representing three stages of invasive breast cancer: node-negative, node-positive and metastatic disease. To address issues related to possible tissue heterogeneity, four cores were taken from each specimen block, with one core per specimen appearing in each of the four replicate array blocks. For each case tumor size, TMN stage, number of positive nodes, grade, age at diagnosis and race was known. In addition for many samples, ER, PR, HER-2 status was also known. Here, each array was stained using the monoclonal antibody to PP5. The samples were then independently scored for intensity of PP5 staining by two pathologists (0 = background/no staining, 1 = staining, 2 = strong staining, and 3 = intense PP5 staining). Representative immuno-stained samples are shown in Figure 1. The 0.6 mm cores afforded some histological information, which allowed confirmation of the diagnosis reported on the key. In the few instances in which normal adjacent tissue was present in an area that was keyed as tumor, the additional normal tissue was scored and the data were included with the normal tissue controls for statistical analysis.
Figure 1. Analysis of human tissue to detect PP5 protein.
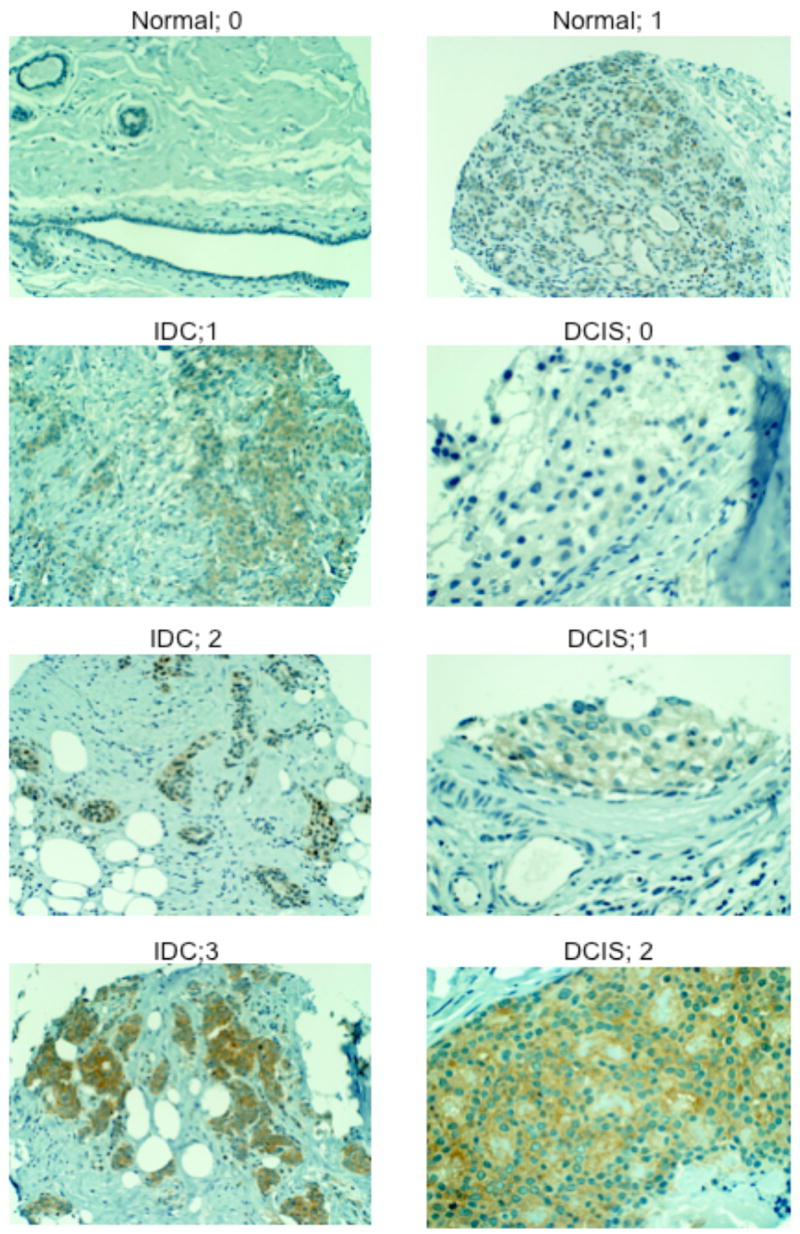
Representative immunostaining of TMAs illustrating primary human breast cancer and normal breast tissue employing the anti-PP5 monoclonal antibody. The data shown are representative >280 samples appearing on each TMAs and the scoring (0, 1, 2, 3) is indicated. The cells were counter stained with Mayer’s Hematoxylin, and the TMAs are described in more detail under Methods. IDC; invasive ductal carcinoma. DCIS; ductal carcinoma in situ.
For the normal breast and normal adjacent tissues samples tested, 77% were scored as 0, and 23% were scored as 1. No samples of normal breast tissue were scored as 2 or 3. In comparison, 58.3% of the invasive tumor samples stained positive for PP5 (62% of the positive staining tumors were scored as 1, 26% as 2 and 12% as 3). Fisher’s exact analysis of the data indicated a statistically significant difference in PP5 staining in normal vs ductal carcinoma in situ (DCIS) and normal vs invasive ductal carcinoma (IDC), with the strongest correlation between PP5 staining and IDC with distal metastases at the time of diagnosis (Table 1). Analyses failed to reveal a statistically significant correlation between PP5 expression and ER, HER-2, age, tumor grade or tumor size. Sub-analysis of samples scored as over-expressing PP5 also failed to reveal a correlation between PP5 expression and HER-2, ER, or PR expression. Together, these studies revealed a positive correlation between high levels of PP5 and human breast cancer.
Table 1.
Fisher’s exact test for PP5-staining; two sided
| P-Value (S = significant) | |
|---|---|
| Normal vs IDC | 0.012 (S) |
| Normal vs DCIS | 0.0028 (S) |
| Normal vs IDC with distal metastasis at the time of diagnosis | 0.0001 (S) |
| Sub-analysis | |
| IDC vs HER- 2 | 0.394 |
| IDC vs ER | 0.7 |
| IDC vs PR | 0.447 |
IDC, invasive ductal carcinoma; DCIS ductal carcinoma in situ; ER, estrogen receptor; PR, progesterone receptor; HER-2, HER-2/neu proto-oncogene; S, statistically significant. TMAs were obtained from the CBCTR and PP5 was visualized using a monoclonal antibody that recognizes PP5 (see Methods for additional detail).
3.2 Growth Effects of Constitutive PP5 Overexpression in MCF-7 Cells
Although a number of studies have investigated cellular events altered by the suppression of PP5 expression [10–12, 14, 16, 18, 20, 21] little is known about the consequences of overexpression. Therefore, we developed PP5-expression vectors for use in transient transfection studies and for the generation of stable cell lines that over-express PP5 in trans. In one system, to help monitor PP5-expression an EGFP-tag was added to the C-terminus of PP5, creating a PP5-EGFP fusion protein. The EGFP-tag was added to the C-terminal because structural and modeling [26–28] studies indicate that the N-terminal TPR-domains mediate the interaction of PP5 with protein complexes containing substrates [7, 28–30]. Such studies also indicate that the C-terminal J-helix, which is displaced from its contacts within an N-terminal inhibitory by “TPR- mediated docking” [28], is connected to the catalytic domain by a flexible loop [26]. Thus, when associated with proteins, such as HSP-90, it was predicted that the addition of the EGFP-tag to this region would minimize the potential for artifacts produced by the addition of the EGFP-tag. A catalytically inactive form of PP5 can be created by mutating His304, or other key amino acids that form the active sight [26]. However, the overexpression of inactive PP5, or even the TPR-domain of PP5, produces a dominant negative effect [7, 30]. Therefore, as an additional control we also employed a second expression system (PP5-tet-off). In this system the constitutive expression of exogenous PP5 is induced by the removal of tetracycline from the culture medium [21]. To characterize these expression systems, PP5 protein levels were measured following transfection, using western analysis to monitor levels of PP5 protein and FACS-analysis (fluorescence activated cell sorting) to measure PP5-EGFP and EGFP. As seen in Figure 2, FACS-analysis of MCF-7 cells 24 hours after transfection with expression plasmids encoding either a PP5-EGFP fusion protein or EGFP alone revealed similar fluorescence profiles (Fig. 2; compare A and B). This indicates that both proteins are efficiently expressed in MCF-7 cells.
Figure 2. Expression levels of PP5, PP5-EGFP and EGFP in MCF-7 cells.
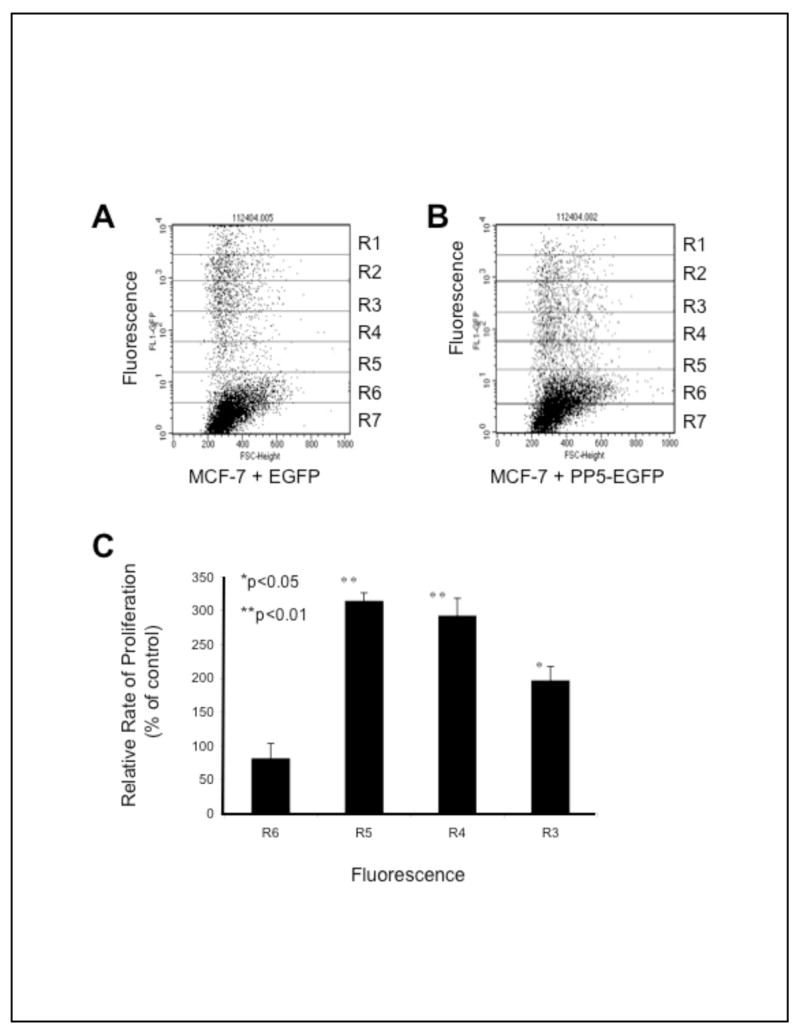
A) Fluorescence activated cell sorting (FACS) analysis of MCF-7 cells 24 hours after transfection with pEGFP. B) FACS analysis of MCF-7 cells 24 hours after transfection with pPP5-EGFP. MCF-7 cells in log phase growth were transfected with the expression plasmids encoding EGFP or a PP5-EGFP fusion protein. After 24 hours the cell cultures were processed for FACS analysis as described in Methods. For A and B the data shown are histograms of 10,000 cells illustrating the intensity of GFP-fluorescence (y-axis) plotted against size/forward scatter (FSC-height; x-axis). Gates were set to exclude necrotic cells and cell debris. The GFP-florescence intensity was divided arbitrarily into seven equal regions (R1–R7) with R1 representing the cells with the greatest intensity. For each experiment duplicate samples were processed to obtain cell cycle profiles within each gated region using propidium iodide staining. The experiments shown are representative of 3 separate experiments that produced similar results. C) Comparison of the relative growth rate and the amount of PP5-EGFP expression. MCF-7 cells were transfected with expression plasmids encoding EGFP or PP5-EGFP. After 24 hours, cells expressing PP5-EGFP or EGFP alone were sorted based on fluorescence intensity into seven fractions (R1-R-7; as indicated above) and plated (100 cells/well) into 96-well plates. After six days cell numbers were determined using a metabolic proliferation (ViaLight Plus) assay. The data are plotted as growth rate vs fluorescence, with the proliferation rate of PP5-EGFP expressing cells plotted as the % of controls (i.e. the rate of proliferation for cells expressing EGFP alone). The proliferation rate assays were measured in triplicate and plotted as the mean +/− SD.
To test the effect of PP5 expression on the rate of cell growth, MCF-7 cells transfected with expression vectors encoding PP5-EGFP, or EGFP as a control, were sorted into seven groups based on fluorescence using a flow cytometer. The groups were arbitrarily designated R1 to R7 (shown in Fig. 2), with R1 representing the highest level of florescence that could be achieved and R7 representing background fluorescence (i.e. cells that were not transfected or cells that failed to express the protein encoded in the plasmids). Cells from each group were then seeded at equal density in 96 well plates and cell proliferation was quantitated at the times indicated. As seen in Figure 2C, when compared to the controls, even a modest increase in PP5 expression is associated with an increased rate of proliferation. However, at very high levels, (i.e. R1 and R2) the cells failed to proliferate and were dead ~24–72 hours after transfection.
Fluorescence microscopic examination of the transfected cells revealed fluorescence in both the cytoplasm and nucleus of cells expressing the EGFP-tag alone. In contrast, in cells over-expressing PP5-EGFP fluorescence was observed predominately in the cytoplasm, which is consistent with the cellular distribution of endogenous PP5 determined by immunostaining of MCF-7 cells [30]. Thus, with modest overexpression the PP5-EGFP fusion protein was distributed within the cells with a pattern similar to that of native PP5. When PP5-EGFP was expressed at very high levels (e.g. R1–R2), intense fluorescence was observed in both the cytosol and nucleus. Still, as noted above these cells died in <72 hours, and at very high levels the over-expressed proteins may affect processes other then those normally acted upon by PP5.
Next more than 10 stable MCF-7 cell lines were generated and analyzed by FACS and Western analysis. Using the tet-off expression system several cell lines in which PP5-expression was induced ~1.5–2 fold upon tetracycline removal were obtained, and one (designated as MCF-7-PP5h1) was chosen for further study. Higher levels of PP5-EGFP were produced by the stronger CMV promoter employed in the EGFP-fusion expression system, and two lines (MCF-7-PP5s and MCF-7-PP5j) that overexpressed PP5-EGFP at higher levels (Figure 3A) were also chosen for further studies. Fluorescent images showing the cytoplasmic expression of PP5-EGFP and the nuclear and cytoplasmic expression of EGFP in representative MCF-7 cell lines are shown in Figure 3B. Again cells over-expressing either PP5 or PP5-EGFP proliferate faster then controls (Figure 3C).
Figure 3. Expression of PP5 and PP5-EGFP in MCF-7 cells.
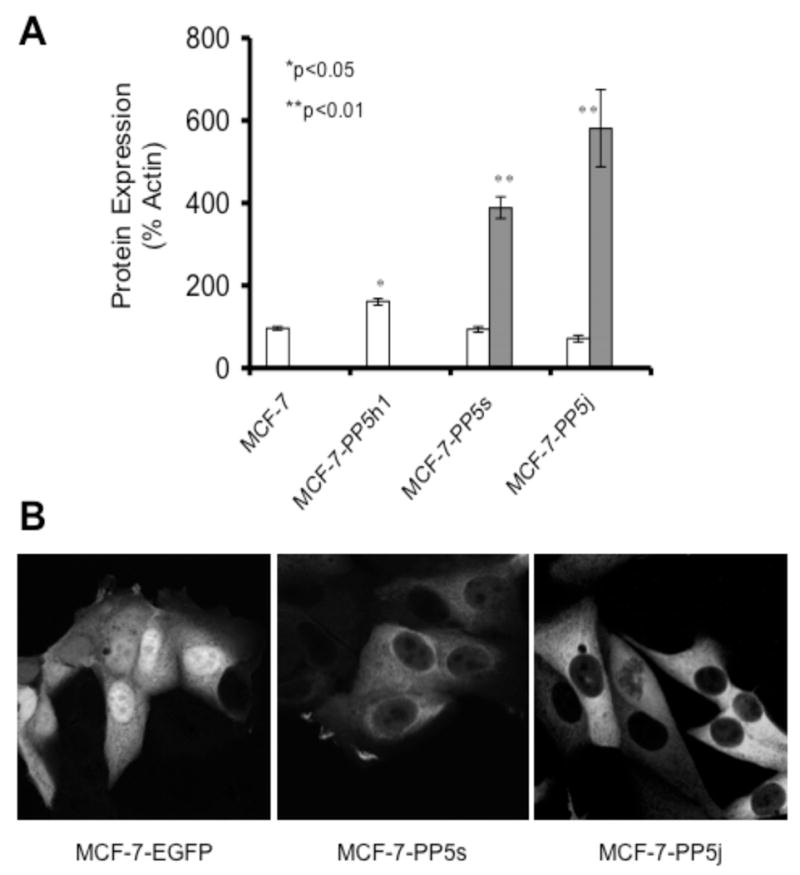
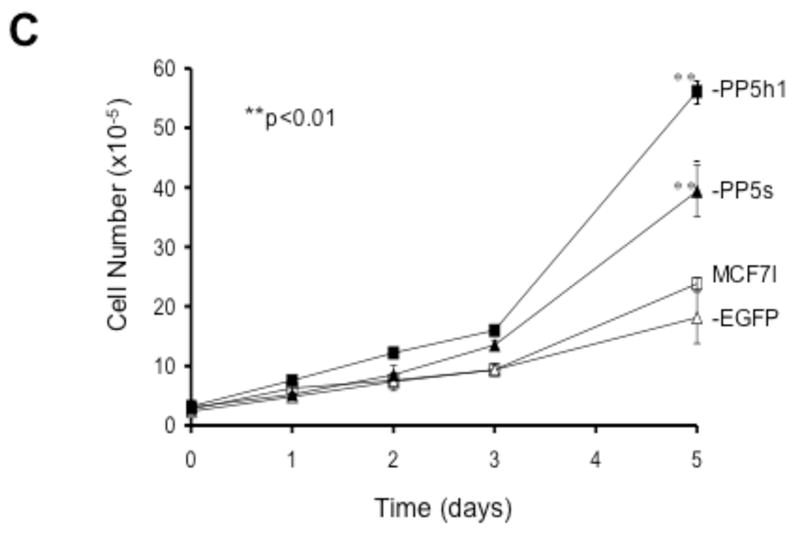
A) Western analysis illustrating the amount of PP5 and PP5-EGFP protein levels in MCF-7 cells and stable MCF-7 cell lines constitutively over-expressing PP5 (MCF-7-PP5h1) or PP5-EGFP (MCF-7-PP5s, MCF-7-PP5j). Open bars indicate the amount of native PP5 (migrates on SDS-PAGE at the same rate as a ~56 KD marker). Filled bars indicate PP5-EGFP, which migrates more slowly (see insert in figure 4). The level of expression is based on the quantitated levels of protein detected by Western analysis. PP5 was detected using a polyclonal antibody to PP5 [10]. The data shown represent the average protein levels of the indicated protein obtained from measuring protein each day over the course of 3 days during which the cells were in exponential growth. For MCF-7-PP5h1 cells, the induction of PP5 was induced by the removal of tetracycline from the media two days prior to the start of the experiment. The data are plotted as a percentage of controls (MCF-7 cells in log phase growth) and are normalized to actin measured on the same membrane to account for any inconsistency in loading or protein transfer. The data shown (mean +/−SEM) are representative of at least 3 similar experiments. B) Fluorescent images taken of representative cells from cell lines expressing EGFP alone (MCF-7-EGFP) or PP5-EGFP (MCF-7-PP5s, MCF-7-PP5j). C) Growth curves showing the proliferation rate of stable MCF-7 cells over-expressing PP5 (MCF-7-PP5h1; filled squares) PP5-EGFP (MCF-7-PP5s; filled triangles) EGFP (MCF-7-EGFP; open triangles) and the parental MCF-7 cells with “normal” levels of PP5 (MCF-7: open squares). For each cell line replicate plates of cells were plated at equal density at day 0. At the times indicated, the number of cells in replicate plates was determined using a Coulter Counter. The data shown are plotted as the mean +/− SD of 3 or more independent experiments each conducted in duplicate. For MCF-7-PP5h1 cells, the expression of PP5 was induced by the removal of tetracycline from the media two days prior to the beginning of the experiment to allow for full induction of PP5 expression.
3.2 Constitutive Overexpression of PP5 Aids Tumor Growth in Mice
The ability of forced PP5 overexpression to facilitate proliferation in MCF-7 cell cultures suggest that aberrant PP5 expression may contribute to the development of cancer. To investigate the possibility that PP5 may play a role in tumor growth, we next studied the affect of constitutive elevated PP5 expression on the formation and growth rate of MCF-7 tumors using a mouse xenograft model. For these studies MCF-7 cell lines that over express different amounts of PP5 were injected into the axillary mammary fat pads of 4–5 week old, female athymic mice. Three groups of mice were used in two separate experiments, with a total of 12 mice per group. Group one animals were used to test the effect of moderate PP5 over expression (similar to levels designated as 2+ in the TMAs). Animals in this group were injected with the cell line MCF-7-PP5s, which over expresses PP5-EGFP at a level that is ~3–4 times the level of PP5 observed in the parental MCF-7 cells (Figure 3). Group two animals were injected with the cell line MCF-7-PP5j, which expressed slightly higher levels of PP5 (yet still maintained cytoplasmic fluorescence). The third group served as a control. The animals in the control group were injected with MCF-7 cells expressing EGFP alone (EGFP-CTL).
A comparison of tumor development in mice injected with MCF-7 cells expressing varying amounts of PP5 is shown in Figure 4. For group 1, tumors were produced in 9 of 12 mice. In the mice that produced tumors, the tumors were apparent after ~2 weeks, and by day 35 the mean tumor diameter was 1.75+/− 0.37 mm, which is significantly different from controls (P <0.01). In the group two animals tumors were produced in 10 of 12 animals, were apparent by ~2 weeks and had a mean tumor diameter of 3.75 +/−0.68 (P<0.002 vs controls) after 35 days. For control mice, 5 of 12 had detectable tumors by day 35. However, the tumors were not detectable until day ~24, and the mean diameters (0.52+/−0.26 mm) were consistently smaller than the tumors in mice injected with cells overexpressing PP5.
Figure 4. Constitutive over expression of PP5 enhances tumor growth in vivo.
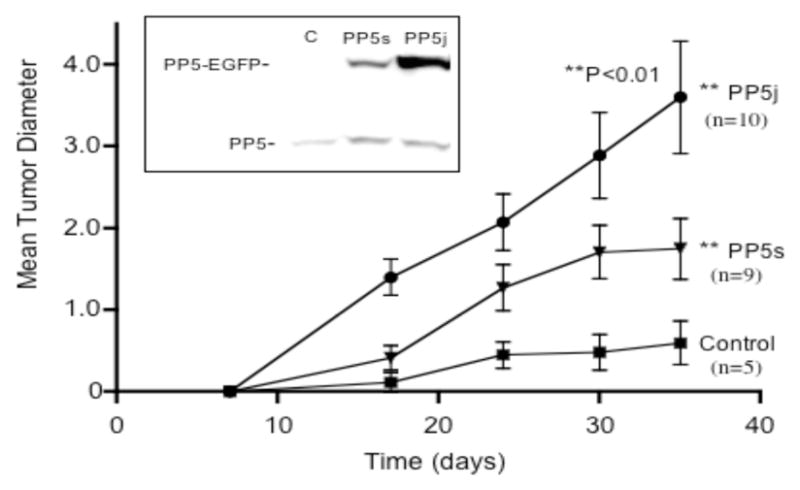
MCF-7 cells which overexpressed PP5-EGFP (MCF-7-PP5s and MCF-7-PP5j) or EGFP alone (control) were injected into the axillary mammary fat pads of 4–5 week old, female athymic mice as described in methods. Tumor size was then assessed at the times indicated, starting ~7 days after injection. The data shown represents two experiments, with a total of 12 mice injected with each cell line. The number of animals that produced tumors is shown to the right of each line, and the data is plotted as the mean diameter (+/− SEM) of the tumors observed. Insert: Western analysis of PP5 and PP5-EGFP fusion protein in the three cell lines detected with an antibody that recognizes PP5 (C, control MCF-7; PP5s, MCF-7-PP5, PP5j, MCF-7-PP5j).
3.3 Constitutive Overexpression of PP5 Protects MCF-7 Cells from Oxidative Stress, UVC-irradiation, Adriamycin, and Vinblastine Induced Death
Previous studies have shown that the suppression of PP5 expression can enhance signaling cascades that induce apoptosis in response to DNA damage, oxidative stress, and UV-irradiation [4, 10, 13, 14, 16, 18]. To determine if PP5 over expression has the opposite effect (i.e. protects cells from genomic stress-induced death) we treated MCF-7 cells overexpressing PP5 with several agents that activate signaling networks known to be influenced by PP5. As seen in Figure 5, in MCF-7-PP5h1 cells with normal levels of PP5 t-butyl hydroperoxide produces a dose-dependent decrease in cell viability, with 50 μM and 100 μM t-butyl hydroperoxide killing ~39 and ~90% of the cells, respectively, in 24 hours. In contrast, when PP5 expression is induced by the removal of tetracycline from the media ~48 hours prior to treatment, even a modest increase in PP5 protein levels increased 24 hour survival, with 50 μM and 100 μM t-butyl hydroperoxide killing 0 and 51% of the treated cells, respectively. Both in the presence and absence of tetracycline, pretreatment (16 hrs) with n-acetyl-L cysteine (30 mM) suppressed H2O2 induced death. In addition, the withdrawal of serum from the media, which induces ROS productions at lower levels [31, 32], did not affect cell survival (Table 2). Both DAPI staining, which revealed fragmented nuclei (not shown), and PARP cleavage assays (Figure 5A insert) are consistent with t-butyl hydroperoxide induced death occurring via apoptosis.
Figure 5. Constitutive overexpression of PP5 protects MCF-7 cells from stress-induced death.
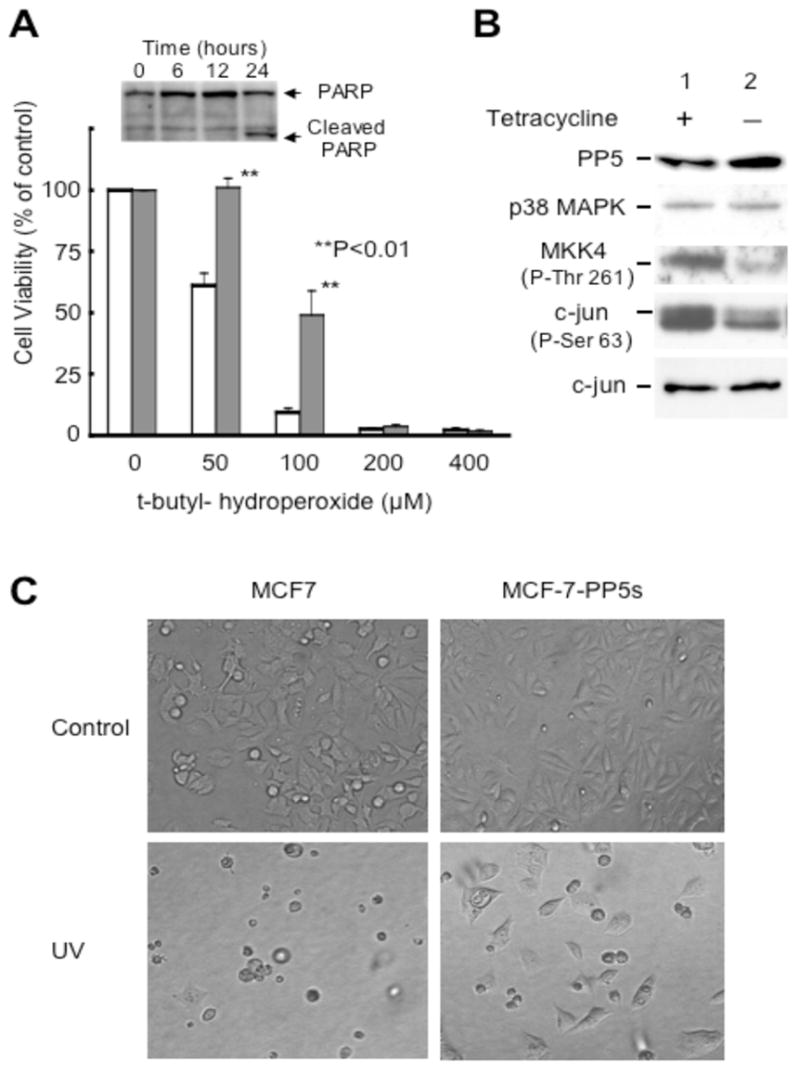
A) MCF-7-PP5h1 were plated in 96 well plates and grown in the presence (normal levels of PP5; open bars) or absence of tetracycline (to induce PP5 expression; filled bars). After 48 hours, the indicated concentration of t-butyl-hydroperoxide was added and the cells were incubated for 24 hours at 37°C. Viable cells were then measured using a metabolic assay as above. The data shown represent the mean +/− SEM of three independent experiments each conducted in triplicate. Insert: immunoblot showing cleavage of poly ADP ribose polymerase (PARP) in cells with normal levels of PP5 at the indicated times following treatment with 200 μM hydrogen peroxide. B) Western blot showing the correlation between an increase in PP5 levels in MCF-7-PP5h1 cells and the suppression of t-butyl hydroperoxide (25 μM) induced phosphorylation of MKK4 (Thr262) and cJun (Ser63). Lane 1, normal expression of PP5 in MCF-7-PP5h1. Lane 2, increased expression of PP5 induced by the removal of tetracycline from the media [21]. Western blots were conducted as described in Methods, and the data shown are representative of 3 independent experiments. C) Phase contrast pictures of MCF-7 control cells (left panels) and MCF-7 cells constitutively overexpressing PP5-EGFP fusion protein (MCF-7-PP5s) 48 hours after UVC (30 mJ) exposure. Controls were not exposed to UVC. The pictures shown are representative of >4 separate experiments and the quantitative survival data are shown in Table 2.
Table 2.
Effect of PP5 over expression on MCF-7 cell survival following treatment with agents that induce apoptosis in MCF-7 cells.
| Treatment: | UVC (30 mJ) | Adriamycin (1.7 μM) | Vinblastine (20 nM) | Taxol (50 nM) | Rapamycin (200 nM) | Serum Starvation | Rapamycin (200 nM) plus Serum Starvation |
|---|---|---|---|---|---|---|---|
| Duration of treatment: | |||||||
| 24 hours | 48 hours | 72 hours | |||||
| Percentage of cell survival; treated/control (mean +/− SD): | |||||||
| Cell line: | |||||||
| MCF-7-EGFP | 28.2 ± 1.8 | 42.8 ± 5.9 | 33.4 ± 0.8 | 30 ± 0 | 64.5 ± 6.7 | 45.9 ± 2.8 | 40.0 ± 5.4 |
| MCF-7-PP5s | 47.3 ± 4.8 | 60.6 ± 9.9 | 38.8 ± 0.7 | 36.5 ± 6.4 | 59.5 ± 12.8 | 42.8 ± 10.2 | 36.4 ± 8.3 |
| p-value | p< 0.003 | p< 0.05 | p< 0.02 | p< 0.5 | p< 0.7 | p< 0.7 | p< 0.7 |
| MCF-7 | 33.3 ± 3.2 | 40.5 ± 3.2 | 31.6 ± 0.9 | 39.4 ± 3.7 | ND | ND | ND |
| MCF-7-PP5h1 | 48.8 ± 3.1 | 49.0 ± 2.8 | 39.7 ± 0.4 | 36.8 ± 2.0 | ND | ND | ND |
| p-value | p< 0.004 | p< 0.002 | p< 0.007 | p< 0.3 | ND | ND | ND |
Replicate plates of the indicated cell lines were produced by plating cells at equal density. After 24 hours, the cells were treated with the agents shown, and at the times indicated the number of cells in duplicate plates was determined by cell counting using a Coulter Counter. The data shown are the mean of 4 experiments +/− SD. P-values were determined by using the Students t-test (unpaired, two-tailed), and each P-value represents a comparison of treated PP5 over-expressing cells to treated control cells (MCF-7PP5s vs MCF-7-EFGP; MCF-7 vs MCF-7-PP5h1). P values of less than 0.05 were regarded as significant and are indicated by bold font.
The effect of PP5 overexpression on UVC-stress was measured by exposing MCF-7, MCF-7-PP5h1, MCF-7-PP5s and MCF-7-EGFP cells to increasing amounts of UVC and counting viable cells over a 72 hr period. With MCF-7 cells UVC-irradiation induces an apoptotic response [33], and 24 hours after exposure to a lethal dose of UVC (30 mJ) the survival of both control cell lines (MCF-7 and MCF-7-EGFP) was dramatically reduced (Table 2). By 72 hours MCF-7 cells expressing normal levels of PP5 that were exposed to 30 mJ UVC were essentially all dead. Exposure of PP5 over-expressing cells to UVC also resulted in a decrease in survival. However, both cell lines over-expressing PP5 had a statistically significant difference in survival by 24 hours (Table 2). After 48 hours the survival difference between cells with normal levels of PP5 and those over-expressing PP5 was visually obvious (Figure 5C). In the controls, few to no cells remain attached to the plate, and the floating cells are rounded and blebbing. In contrast, cultures of PP5 overexpressing MCF-7 cells contained many viable cells that remain attached to the dish.
The effects of PP5 expression on cell survival following treatment with adriamycin (doxorubicin), was investigated next. The molecular actions of adriamycin toxicity are complex. Adriamycin 1) intercalates with DNA, directly affecting transcription, 2) forms a tripartite complex with topoisomerase II and DNA, resulting in double-strand breaks, and 3) by virtue of its quinone group also generate free radicals [34]. A key part of its antitumor activity appears to result from its ability to trigger a strong DNA-damage response that actives p53 and results in apoptosis (for rev. see [34]). However adriamycin induced apoptosis is suppressed by the induction of the G1-cyclin kinase inhibitor protein, p21Waf1/cip1, which induces G1-growth arrest [35, 36]. Because the suppression of PP5 was associated both the activation of p53 and the induction of p21Waf1/cip1 expression, without spontaneously inducing apoptosis [11], preliminary time-course and dose-response experiments were conducted to identify the LD50 and LD100 (concentration needed to kill 50% and 100% of the treated cells, respectively) in MCF-7 cells. Similar studies were also conducted using vinblastine, taxol, and rapamycin. Then the effects of PP5 overexpression on survival were tested by treating MCF-7, MCF-7-EGFP, MCF-7-PP5h1 and MCF-7-PP5s with each compound at a level that kills ~50, 70 or 100 % of the control cells at the times indicated. Differences in cell survival were determined by counting the number of cells in each dish at the times indicated using a Coulter Counter. When compared to control cell lines, both cell lines over-expressing PP5 were less sensitive to adriamycin or vinblastine, while no difference in survival was observed when cells were treated with taxol, rapamycin, or the combination of serum withdrawal and rapamycin (Table 2). Remarkably, the overexpression of PP5 provided partial protection from 48 hour treatment with 1.0 μg/ml (1.7 μM) adriamycin, a dose that kills >50 % of the controls in 24 hours, >95% of controls in 48 hours (Fig. 6A) and is ~5 times the amount needed to induce nearly 100 % death in MCF-7 cells that are exposed to this drug for 72 hours. At a lower concentration (0.2 μg/ml) both cells with normal and elevated levels of PP5 are rapidly growth arrested by adriamycin (Fig. 6B). However, when the drug was removed after 72 hour, by day 6 the control cells showed marked membranes blebbing. By day 10 the controls were essentially all dead. In contrast, after the initial growth arrest, the cells with elevated PP5 did not die. Rather, the MCF-7-PP5h1 cells remained viable, and by day 6–7 the cultures contained proliferating cells. A statistically significant difference was achieved by day 7 at which time the MCF-7-PP5h1 cell over-expressing PP5 entered into log phase growth (Figure 6B). By day 10 the MCF-7-PP5h1 cell cultures were confluent, while only a few control cells remained attached to the dish. Western analysis of adriamycin treated cells revealed that the over expression of PP5 had no apparent effect on adriamycin induced p21Waf1/cip1 expression, which was markedly induced in all of the treated cells (data not shown).
Figure 6. Overexpression of PP5 suppresses adriamycin-induced death in MCF-7 cells.
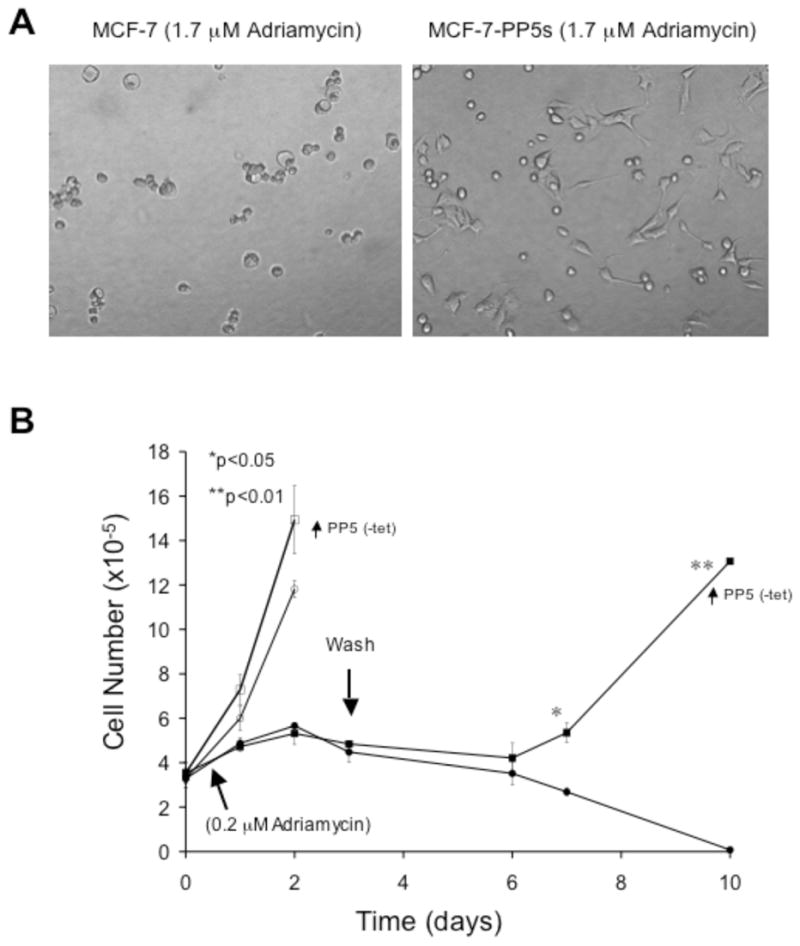
A) Phase contrast pictures of MCF-7 cells and cells over-expressing PP5-EGFP (MCF-7-PP5s) 48 hours after treatment with 1.0 μg/ml adriamycin (1.7μM). The pictures shown are representative of 4 separate experiments and the quantitative 24-hour survival data are shown in Table 2. B) Growth curves of MCF-7 cells. MCF-7-PP5h1 cells cultured in the presence (+tet; normal PP5) or absences of tetracycline (-tet; increased PP5) for 48 hrs. Replicate plates were seeded at equal density, and after 24 hours the plates were treated with 0.2 μg/mL adriamycin (filled symbols) or solvent alone (open symbols). After three days the cells treated with adriamycin were washed and given fresh media (indicted by an arrow). The number of cells in replicate plates was determined at the times indicated by cell counting with a Coulter Counter. The data shown are plotted as the mean (+/−SD) of replicate dishes from a single experiment and are representative of 4 separate experiments that produced similar results. The overexpression of PP5 in MCF-7-PP5h1 cells was induced by the removal of tetracycline (-tet) from the media as described above (Fig. 5).
4.0 Discussion
Previous studies have shown that the suppression of PP5 expression with siRNA or antisense oligonuclotides results in the augmentation or prolongation of signaling cascades that are activated by agents that produce genomic stress [10–12, 14, 16, 18, 20, 21]. Still, the physiological/pathological roles played by PP5 are not well understood. In the present study elevated levels of PP5 protein were detected in specimens of human breast cancer [ductal carcinoma in situ (DCIS) and invasive ductal carcinoma (IDC) of the breast], with the strongest correlation observed between high levels of PP5 and IDC in patients with metastatic disease at the time of diagnosis (P<0.0001). A correlation between PP5-overexpression and accelerated tumor growth was also observed in a xenograft mouse model for tumor development. These findings indicate that PP5 overexpression correlates with the development of human breast cancer, and suggest that PP5 may aid tumor growth. To our knowledge this is the first report of a functional positive correlation between elevated levels of PP5 and the development of human breast cancer. In rats, however, PP5 mRNA levels were reported as markedly elevated in highly malignant ascites hepatomas [37], and in yeast the homologue of PP5 (PPT1) is expressed at elevated levels in proliferating cells [38]. Recently, a proteomic analysis of mantle-cell lymphoma by protein microarray also revealed elevated PP5 expression [39], which may implicate PP5 overexpression in other cancers.
At the molecular level, the relationship between PP5 expression and tumor growth is not yet clear. The human PP5-promoter contains a functional estrogen response element, and in some estrogen responsive cells 17-β-estradiol induces PP5 expression [21]. The overexpression of PP5 has been reported to suppress ER-mediated transcription [40]. Still the suppression of PP5 expression with antisense oligonucleotides does not affect estradiol-induced expression of classic ER-responsive genes (e.g. c-myc or cyclin D1) [21]. Together, these observations suggest that PP5 may act as a feedback inhibitor of ER-signaling. Here we observed that the constitutive overexpression of PP5 results in an increase in the growth rate of MCF-7 cells both in cell culture and in mouse xenograft tumors when estrogen levels are normal. However, the analysis of the human TMA data failed to reveal a correlation between high levels of PP5 and estrogen receptor expression (Table 1). In addition in our previous studies we have shown that in a low estrogen environment (subcutaneous injections in male NCR (Taconic) nude mice) the overexpression of PP5 alone is not sufficient to produce xenograft tumors [22]. Therefore, although PP5 may play a role in a feedback mechanism that regulates the actions of ERs, the ability of PP5 to aid tumor growth may be down stream or independent from its actions on ERs.
Studies with siRNA and antisense oligonucleotides indicate that a decrease in PP5 expression can also result in G1-growth arrest [10, 11], DNA-damage checkpoint control failure [18], prolonged activation of ASK1-signaling [13, 14], altered DNA-PKcs signaling [16], and a GR/p53-dependent increase in p21Waf1/cip1 expression [10, 11]. These observations led us to test the hypothesis that the overexpression of PP5 may provide cells with protection from stress-induced growth arrest/death. In the present studies, dose-response cell survival experiments were conducted using t-butyl hydroperoxide, UVC-irradiation, adriamycin, and other antitumor drugs that induce growth arrest or apoptosis in MCF-7 cells via signaling networks that PP5 is known to influence [15, 33, 41–44]. The data obtained indicates that the overexpression of PP5 provides protection from UVC-irradiation, adriamycin and vinblastine. In contrast, no apparent protection was observed following treatment with taxol, rapamycin, serum starvation or concomitant serum starvation and rapamycin treatment (Table 2). All of the reagents that PP5 overexpression provides protection from are known to induce oxidative stress, DNA-damage, or both. They also lead to the activation of ASK1, DNA-PKcs, p53 and/or apoptosis. Since PP5 has been shown to act as a suppressor of ASK1 [13, 14, 45, 46], p53 [10, 12], and DNA-PKcs [16], the observed increase in cell survival associated with PP5 overexpression is consistent with the concept that PP5 acts to suppress established signaling cascades (i.e. ASK1-, p53- and/or DNA-PK-induced) that normally trigger an apoptotic response. In support of previous studies examining the relationship between PP5 and ASK1-signaling networks [13, 14], a modest increase in PP5 expression was associated with the suppression of MKK4 and c-Jun phosphorylation (Figure 5B), which in response to hypoxia or H2O2 are maintained in a hyperphosphorylated when PP5 proteins levels are suppressed [14]. However, PP5 has also been implicated in the regulation of Raf-1 signaling [20], and it is also possible that PP5 affects yet another currently unrecognized growth-control mechanisms. Therefore, at this time the increase in MCF-7 tumor size observed in the xenograft model of PP5 overexpression cannot be assigned to the suppression of a single pathway.
Previous studies have also implicated PP5 in the antiproliferative effects of rapamycin, with rapamycin producing a decrease in PP5 activity that subsequently leads to an increase in ASK1-mediated apoptosis [45]. At first glance, because PP5 overexpression in MCF-7 cells did not provide resistance to treatment with rapamycin, or the combination of rapamycin and serum withdrawal, our data appears inconsistent with the initial observation. However, the role for PP5 in rapamycin mediated activation of ASK1 and apoptosis was only observed in p53−/− cells, and MCF-7 cells are p53-wildtype. Thus, the different observations are not in conflict. Rather, both studies support the hypothesis proposed by Huang et al. [45, 46] suggesting p53 acts to suppress rapamycin-induced activation of ASK1 [45, 46]. Finally it should be noted that although the overexpression of PP5 allowed MCF-7 cells to withstand higher doses of UVC, t-butyl hydroperoxide, and adriamycin, we did not observe an increase in MCF-7 cell sensitivity to these agents when the expression of PP5 was suppressed. In addition the suppression of PP5 expression with siRNA in the absence of DNA-damage/stress does not result in cell death [10, 11, 14]. Thus, although the overexpression of PP5 may aid cell survival in the presence of stress, the suppression of PP5 without the concomitant activation of a stress-induced response does not trigger apoptosis.
Figure 1S. Western analysis of PP5 protein levels in human tissue. A) Western analysis comparing PP5 protein levels in normal breast ductal epithelial tissue from five different patients with no indication of disease, and six breast cancer tumor samples diagnosed as invasive ductal carcinoma (IDC). Lanes marked C were loaded with A549 cell extracts (control). Each lane was loaded with 30 μg of homogenate, and PP5 was detected using a polyclonal antibody recognizing PP5 generated in rabbits. The lower band represents IgG, which despite the claims of the manufacturer is recognized by the secondary antibody used in these experiments. B) Comparison of PP5 protein levels in tumor (infiltrating ductal carcinoma) and normal adjacent tissue from the same patient. PP5 protein was detected using a monoclonal antibody recognizing PP5, and the data shown are representative of three samples from different patients diagnosed with invasive ductal carcinoma (IDC). The secondary anti-mouse antibody used in these experiments does not cross-react with human IgG.
Supplementary Material
Acknowledgments
We thank Sandra Chapman, Ray Hester, and Sylvia Mayo for their technical assistance. This work was supported in part by a grant from the National Institutes of Health (NCI grant CA-60750; P20 MD-002314). This investigation was conducted in a facility constructed with support from Research Facilities Improvement Program Grant (C06 RR11174) from the National Center for Research Resources.
Abbreviations
- DCIS
ductal carcinoma in situ
- IDC
invasive ductal carcinoma
- FACS
fluorescence activated cell sorting
- ASK1
apoptosis signal regulating kinase 1
- HIF-1
hypoxia inducible factor 1
- MKK4
Map-kinase kinase-4
- DNA-PKcs
DNA-dependent ser/thr protein kinase
- ATM
ataxia-telangiectasia mutated-kinase
- ATR
ATM/rad 3 related kinase
- GR
glucocorticoid receptor
- ER
estrogen receptor
- PR
progesterone receptor
- JNK
c-jun N-terminal kinase
References
- 1.Cohen P. The role of protein phosphorylation in human health and disease. The Sir Hans Krebs Medal Lecture. Eur J Biochem. 2001;268:5001–5010. doi: 10.1046/j.0014-2956.2001.02473.x. [DOI] [PubMed] [Google Scholar]
- 2.Manning G, Whyte DB, Martinez R, Hunter T, Sudarsanam S. The protein kinase complement of the human genome. Science. 2002;298:1912–1934. doi: 10.1126/science.1075762. [DOI] [PubMed] [Google Scholar]
- 3.Cohen PT. Novel protein serine/threonine phosphatases: variety is the spice of life. Trends Biochem Sci. 1997;22:245–251. doi: 10.1016/s0968-0004(97)01060-8. [DOI] [PubMed] [Google Scholar]
- 4.Gallego M, Virshup DM. Protein serine/threonine phosphatases: life, death, and sleeping. Curr Opin Cell Biol. 2005;17:197–202. doi: 10.1016/j.ceb.2005.01.002. [DOI] [PubMed] [Google Scholar]
- 5.Honkanen RE, Golden T. Regulators of serine/threonine protein phosphatases at the dawn of a clinical era? Curr Med Chem. 2002;9:2055–2075. doi: 10.2174/0929867023368836. [DOI] [PubMed] [Google Scholar]
- 6.Shenolikar S, Nairn AC. Protein phosphatases: recent progress. Adv Second Messenger Phosphoprotein Res. 1991;23:1–121. [PubMed] [Google Scholar]
- 7.Chen MS, Silverstein AM, Pratt WB, Chinkers M. The tetratricopeptide repeat domain of protein phosphatase 5 mediates binding to glucocorticoid receptor heterocomplexes and acts as a dominant negative mutant. J Biol Chem. 1996;271:32315–32320. doi: 10.1074/jbc.271.50.32315. [DOI] [PubMed] [Google Scholar]
- 8.Silverstein AM, Galigniana MD, Chen MS, Owens-Grillo JK, Chinkers M, Pratt WB. Protein phosphatase 5 is a major component of glucocorticoid receptor. hsp90 complexes with properties of an FK506-binding immunophilin. J Biol Chem. 1997;272:16224–16230. doi: 10.1074/jbc.272.26.16224. [DOI] [PubMed] [Google Scholar]
- 9.Davies TH, Ning YM, Sanchez ER. Differential control of glucocorticoid receptor hormone-binding function by tetratricopeptide repeat (TPR) proteins and the immunosuppressive ligand FK506. Biochemistry. 2005;44:2030–2038. doi: 10.1021/bi048503v. [DOI] [PubMed] [Google Scholar]
- 10.Zuo Z, Dean NM, Honkanen RE. Serine/threonine protein phosphatase type 5 acts upstream of p53 to regulate the induction of p21(WAF1/Cip1) and mediate growth arrest. J Biol Chem. 1998;273:12250–12258. doi: 10.1074/jbc.273.20.12250. [DOI] [PubMed] [Google Scholar]
- 11.Zuo Z, Urban G, Scammell JG, Dean NM, McLean TK, Aragon I, Honkanen RE. Ser/Thr protein phosphatase type 5 (PP5) is a negative regulator of glucocorticoid receptor-mediated growth arrest. Biochemistry. 1999;38:8849–8857. doi: 10.1021/bi990842e. [DOI] [PubMed] [Google Scholar]
- 12.Urban G, Golden T, Aragon IV, Cowsert L, Cooper SR, Dean NM, Honkanen RE. Identification of a functional link for the p53 tumor suppressor protein in dexamethasone-induced growth suppression. J Biol Chem. 2003;278:9747–9753. doi: 10.1074/jbc.M210993200. [DOI] [PubMed] [Google Scholar]
- 13.Morita K, Saitoh M, Tobiume K, Matsuura H, Enomoto S, Nishitoh H, Ichijo H. Negative feedback regulation of ASK1 by protein phosphatase 5 (PP5) in response to oxidative stress. Embo J. 2001;20:6028–6036. doi: 10.1093/emboj/20.21.6028. [DOI] [PMC free article] [PubMed] [Google Scholar]
- 14.Zhou G, Golden T, Aragon IV, Honkanen RE. Ser/Thr protein phosphatase 5 inactivates hypoxia-induced activation of an apoptosis signal-regulating kinase 1/MKK-4/JNK signaling cascade. J Biol Chem. 2004;279:46595–46605. doi: 10.1074/jbc.M408320200. [DOI] [PubMed] [Google Scholar]
- 15.Matsuzawa A, Nishitoh H, Tobiume K, Takeda K, Ichijo H. Physiological roles of ASK1-mediated signal transduction in oxidative stress- and endoplasmic reticulum stress-induced apoptosis: advanced findings from ASK1 knockout mice. Antioxid Redox Signal. 2002;4:415–425. doi: 10.1089/15230860260196218. [DOI] [PubMed] [Google Scholar]
- 16.Wechsler T, Chen BP, Harper R, Morotomi-Yano K, Huang BC, Meek K, Cleaver JE, Chen DJ, Wabl M. DNA-PKcs function regulated specifically by protein phosphatase 5. Proc Natl Acad Sci U S A. 2004;101:1247–1252. doi: 10.1073/pnas.0307765100. [DOI] [PMC free article] [PubMed] [Google Scholar]
- 17.Ali A, Zhang J, Bao S, Liu I, Otterness D, Dean NM, Abraham RT, Wang XF. Requirement of protein phosphatase 5 in DNA-damage-induced ATM activation. Genes Dev. 2004;18:249–254. doi: 10.1101/gad.1176004. [DOI] [PMC free article] [PubMed] [Google Scholar]
- 18.Zhang J, Bao S, Furumai R, Kucera KS, Ali A, Dean NM, Wang XF. Protein phosphatase 5 is required for ATR-mediated checkpoint activation. Mol Cell Biol. 2005;25:9910–9919. doi: 10.1128/MCB.25.22.9910-9919.2005. [DOI] [PMC free article] [PubMed] [Google Scholar]
- 19.Shah BH, Catt KJ. Protein phosphatase 5 as a negative key regulator of Raf-1 activation. Trends Endocrinol Metab. 2006;17:382–384. doi: 10.1016/j.tem.2006.10.013. [DOI] [PubMed] [Google Scholar]
- 20.von Kriegsheim A, Pitt A, Grindlay GJ, Kolch W, Dhillon AS. Regulation of the Raf-MEK-ERK pathway by protein phosphatase 5. Nat Cell Biol. 2006;8:1011–1016. doi: 10.1038/ncb1465. [DOI] [PubMed] [Google Scholar]
- 21.Urban G, Golden T, Aragon IV, Scammell JG, Dean NM, Honkanen RE. Identification of an estrogen-inducible phosphatase (PP5) that converts MCF-7 human breast carcinoma cells into an estrogen-independent phenotype when expressed constitutively. J Biol Chem. 2001;276:27638–27646. doi: 10.1074/jbc.M103512200. [DOI] [PubMed] [Google Scholar]
- 22.Golden T, Aragon IV, Zhou G, Cooper SR, Dean NM, Honkanen RE. Constitutive over expression of serine/threonine protein phosphatase 5 (PP5) augments estrogen-dependent tumor growth in mice. Cancer Lett. 2004;215:95–100. doi: 10.1016/j.canlet.2004.03.027. [DOI] [PubMed] [Google Scholar]
- 23.Bos R, Zhong H, Hanrahan CF, Mommers EC, Semenza GL, Pinedo HM, Abeloff MD, Simons JW, van Diest PJ, van der Wall E. Levels of hypoxia-inducible factor-1 alpha during breast carcinogenesis. J Natl Cancer Inst. 2001;93:309–314. doi: 10.1093/jnci/93.4.309. [DOI] [PubMed] [Google Scholar]
- 24.Bos R, van der Groep P, Greijer AE, Shvarts A, Meijer S, Pinedo HM, Semenza GL, van Diest PJ, van der Wall E. Levels of hypoxia-inducible factor-1alpha independently predict prognosis in patients with lymph node negative breast carcinoma. Cancer. 2003;97:1573–1581. doi: 10.1002/cncr.11246. [DOI] [PubMed] [Google Scholar]
- 25.Samant RS, Seraj MJ, Saunders MM, Sakamaki TS, Shevde LA, Harms JF, Leonard TO, Goldberg SF, Budgeon L, Meehan WJ, Winter CR, Christensen ND, Verderame MF, Donahue HJ, Welch DR. Analysis of mechanisms underlying BRMS1 suppression of metastasis. Clin Exp Metastasis. 2000;18:683–693. doi: 10.1023/a:1013124725690. [DOI] [PubMed] [Google Scholar]
- 26.Swingle MR, Honkanen RE, Ciszak EM. Structural basis for the catalytic activity of human serine/threonine protein phosphatase-5. J Biol Chem. 2004;279:33992–33999. doi: 10.1074/jbc.M402855200. [DOI] [PubMed] [Google Scholar]
- 27.Cliff MJ, Harris R, Barford D, Ladbury JE, Williams MA. Conformational diversity in the TPR domain-mediated interaction of protein phosphatase 5 with Hsp90. Structure. 2006;14:415–426. doi: 10.1016/j.str.2005.12.009. [DOI] [PubMed] [Google Scholar]
- 28.Yang J, Roe SM, Cliff MJ, Williams MA, Ladbury JE, Cohen PT, Barford D. Molecular basis for TPR domain-mediated regulation of protein phosphatase 5. Embo J. 2005;24:1–10. doi: 10.1038/sj.emboj.7600496. [DOI] [PMC free article] [PubMed] [Google Scholar]
- 29.Das AK, Cohen PW, Barford D. The structure of the tetratricopeptide repeats of protein phosphatase 5: implications for TPR-mediated protein-protein interactions. Embo J. 1998;17:1192–1199. doi: 10.1093/emboj/17.5.1192. [DOI] [PMC free article] [PubMed] [Google Scholar]
- 30.Chinkers M. Protein phosphatase 5 in signal transduction. Trends Endocrinol Metab. 2001;12:28–32. doi: 10.1016/s1043-2760(00)00335-0. [DOI] [PubMed] [Google Scholar]
- 31.Lee SB, Bae IH, Bae YS, Um HD. Link between mitochondria and NADPH oxidase 1 isozyme for the sustained production of reactive oxygen species and cell death. J Biol Chem. 2006;281:36228–36235. doi: 10.1074/jbc.M606702200. [DOI] [PubMed] [Google Scholar]
- 32.Scherz-Shouval R, Shvets E, Fass E, Shorer H, Gil L, Elazar Z. Reactive oxygen species are essential for autophagy and specifically regulate the activity of Atg4. Embo J. 2007;26:1749–1760. doi: 10.1038/sj.emboj.7601623. [DOI] [PMC free article] [PubMed] [Google Scholar]
- 33.Ferguson HA, Marietta PM, Van Den Berg CL. UV-induced apoptosis is mediated independent of caspase-9 in MCF-7 cells: a model for cytochrome c resistance. J Biol Chem. 2003;278:45793–45800. doi: 10.1074/jbc.M307979200. [DOI] [PubMed] [Google Scholar]
- 34.Burton LL, Lazo JS, Parker KL. Goodman and Gilman’s The Pharmacological Basis of Therapeutics. McGraw-Hill; 2006. pp. 1358–1360. [Google Scholar]
- 35.Tang JJ, Shen C, Lu YJ. Requirement for pre-existing of p21 to prevent doxorubicin-induced apoptosis through inhibition of caspase-3 activation. Mol Cell Biochem. 2006;291:139–144. doi: 10.1007/s11010-006-9206-7. [DOI] [PubMed] [Google Scholar]
- 36.Bar-On O, Shapira M, Hershko DD. Differential effects of doxorubicin treatment on cell cycle arrest and Skp2 expression in breast cancer cells. Anticancer Drugs. 2007;18:1113–1121. doi: 10.1097/CAD.0b013e3282ef4571. [DOI] [PubMed] [Google Scholar]
- 37.Shirato H, Shima H, Nakagama H, Fukuda H, Watanabe Y, Ogawa K, Matsuda Y, Kikuchi K. Expression in hepatomas and chromosomal localization of rat protein phosphatase 5 gene. Int J Oncol. 2000;17:909–912. doi: 10.3892/ijo.17.5.909. [DOI] [PubMed] [Google Scholar]
- 38.Jeong JY, Johns J, Sinclair C, Park JM, Rossie S. Characterization of Saccharomyces cerevisiae protein Ser/Thr phosphatase T1 and comparison to its mammalian homolog PP5. BMC Cell Biol. 2003;4:3. doi: 10.1186/1471-2121-4-3. [DOI] [PMC free article] [PubMed] [Google Scholar]
- 39.Ghobrial IM, McCormick DJ, Kaufmann SH, Leontovich AA, Loegering DA, Dai NT, Krajnik KL, Stenson MJ, Melhem MF, Novak AJ, Ansell SM, Witzig TE. Proteomic analysis of mantle-cell lymphoma by protein microarray. Blood. 2005;105:3722–3730. doi: 10.1182/blood-2004-10-3999. [DOI] [PMC free article] [PubMed] [Google Scholar]
- 40.Ikeda K, Ogawa S, Tsukui T, Horie-Inoue K, Ouchi Y, Kato S, Muramatsu M, Inoue S. Protein phosphatase 5 is a negative regulator of estrogen receptor-mediated transcription. Mol Endocrinol. 2004;18:1131–1143. doi: 10.1210/me.2003-0308. [DOI] [PubMed] [Google Scholar]
- 41.Bean LJ, Stark GR. Phosphorylation of serines 15 and 37 is necessary for efficient accumulation of p53 following irradiation with UV. Oncogene. 2001;20:1076–1084. doi: 10.1038/sj.onc.1204204. [DOI] [PubMed] [Google Scholar]
- 42.Ryan KM, Phillips AC, Vousden KH. Regulation and function of the p53 tumor suppressor protein. Curr Opin Cell Biol. 2001;13:332–337. doi: 10.1016/s0955-0674(00)00216-7. [DOI] [PubMed] [Google Scholar]
- 43.Fernandes N, Sun Y, Chen S, Paul P, Shaw RJ, Cantley LC, Price BD. DNA damage-induced association of ATM with its target proteins requires a protein interaction domain in the N terminus of ATM. J Biol Chem. 2005;280:15158–15164. doi: 10.1074/jbc.M412065200. [DOI] [PubMed] [Google Scholar]
- 44.Machino T, Hashimoto S, Maruoka S, Gon Y, Hayashi S, Mizumura K, Nishitoh H, Ichijo H, Horie T. Apoptosis signal-regulating kinase 1-mediated signaling pathway regulates hydrogen peroxide-induced apoptosis in human pulmonary vascular endothelial cells. Crit Care Med. 2003;31:2776–2781. doi: 10.1097/01.CCM.0000098027.49562.29. [DOI] [PubMed] [Google Scholar]
- 45.Huang S, Shu L, Easton J, Harwood FC, Germain GS, Ichijo H, Houghton PJ. Inhibition of mammalian target of rapamycin activates apoptosis signal-regulating kinase 1 signaling by suppressing protein phosphatase 5 activity. J Biol Chem. 2004;279:36490–36496. doi: 10.1074/jbc.M401208200. [DOI] [PubMed] [Google Scholar]
- 46.Huang S, Shu L, Dilling MB, Easton J, Harwood FC, Ichijo H, Houghton PJ. Sustained activation of the JNK cascade and rapamycin-induced apoptosis are suppressed by p53/p21(Cip1) Mol Cell. 2003;11:1491–1501. doi: 10.1016/s1097-2765(03)00180-1. [DOI] [PubMed] [Google Scholar]
Associated Data
This section collects any data citations, data availability statements, or supplementary materials included in this article.