Abstract
A physical map of the 31-megabase Aspergillus nidulans genome is reported, in which 94% of 5,134 cosmids are assigned to 49 contiguous segments. The physical map is the result of a two-way ordering process, in which clones and probes were ordered simultaneously on a binary DNA/DNA hybridization matrix. Compression by elimination of redundant clones resulted in a minimal map, which is a chromosome walk. Repetitive DNA is nonrandomly dispersed in the A. nidulans genome, reminiscent of heterochromatic banding patterns of higher eukaryotes. We hypothesize gene clusters may arise by horizontal transfer and spread by transposition to explain the nonrandom pattern of repeats along chromosomes.
The ascomycetous fungus Aspergillus nidulans is one of the simplest multicellular eukaryotes. Its estimated 31-megabase genome (1) with low repetitive DNA content (2), distributed among eight chromosomes, is sufficiently complex to direct multicellular development (3, 4). With its sophisticated forward and reverse genetics (5, 6), A. nidulans has been used to address fundamental questions in cell and molecular biology (7–10) and has become a model system for the study of pathogenic and biotechnologically useful relatives (11, 12). One of the major questions in genomics is the organization of repeated DNA sequences in a genome because this organization has implications for functional organization of genomes, development, chromosome structure and function, recombination, and genome evolution. Small eukaryotic genomes provide excellent models for the development of novel mapping technologies for larger genomes. For example, the A. nidulans genome is entirely covered (tiled) by 775 nonoverlapping cosmids (averaging ≈40-kb inserts) and the human genome, with 3,000 yeast artificial chromosomes [averaging ≈1,001-kb inserts, (13)]. Here we present a physical mapping strategy that produces a portrait of how repeated DNA sequences are distributed in small eukaryotic genomes.
MATERIALS AND METHODS
Libraries.
Two independent libraries were constructed in the Lambda-based cosmid vector pLORIST2 and the pBR-based cosmid vector pWE15 (1).
Physical Mapping Strategy.
For the physical mapping experiment, pulsed field gel electrophoresis isolated chromosomes were radiolabeled and used, one by one, to probe the two genomic libraries (5,134 clones stamped onto seven high-density gridded 5 × 3.5-inch nylon membranes containing 864 clones each) to show the chromosomal affiliations of each clone (1). With this information, clones were sorted into subsets (S for specific to one chromosome, R for repeated hybridization to several, but not all, chromosomes, and O for octochromosomal). Octochromosomal (O) clones hybridized to all eight A. nidulans chromosomes. The numbers of S, R, and O clones in the genomic library were 3,307 (64.4%), 1,769 (34.4%), and 58 (1.1%), respectively. Then, only S clones were radiolabeled and used to probe the genomic library of 5,134 clones (on seven identical membranes) (14). Eight S clones, one from each chromosome, were used as probes simultaneously because chromosome specificity for each target clone was already known. Only S clones not hybridizing to previously used probes were selected as probes so that S clones were nonoverlapping (15, 16). This random mechanism of probe selection is referred to as sampling without replacement (15, 16).
Availability of Physical Mapping Data.
The entire four-step process of creating and compressing physical maps described in Fig. 1 has been automated in the computer, and physical mapping data are available to the public in the Fungal Genome Database (FGDB). Files containing the complete information used in this study may be retrieved by anonymous ftp from fungus.genetics.uga.edu or the FGDB web site (http://fungus.genetics.uga.edu:5080). Alternatively, data may be requested by mail or e-mail to arnold@bscr.uga.edu.
Figure 1.
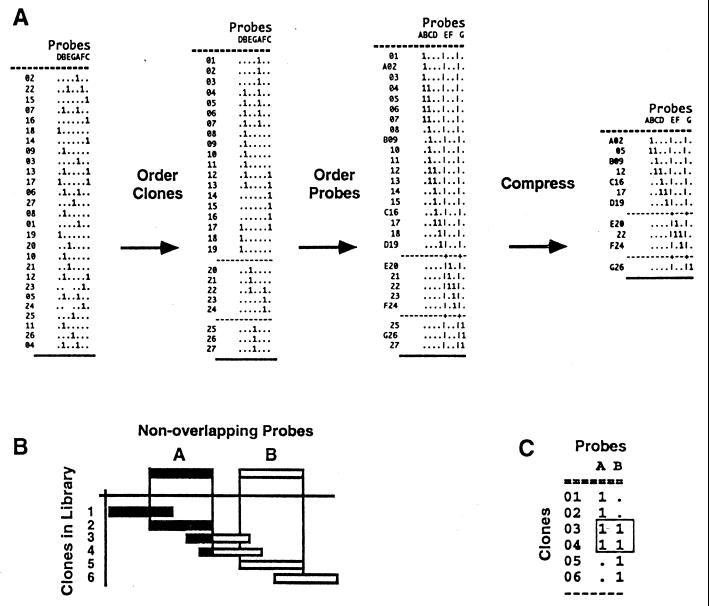
The two-way complementary ordering process and compression of a binary clone/probe hybridization matrix. A schematic representation of the ordering process of DNA/DNA hybridization data into a physical map. All clones present in the library are indexed by rows (in the example clones are indicated by numbers), and nonoverlapping probes are listed across the columns (in the example probes are indicated by letters). The S, R, and O designations were appended to the clone names (17). Probes are clones selected from the chromosome-specific clone collection (846 probes) and hybridized to filters containing the entire library. In the binary matrix, presence or absence of hybridization of each clone to each probe is indicated by 1 or “.”, respectively. Clones were ordered by simulated annealing (18) or random cost (14) algorithms, and contigs are represented by blocks of linked clones separated by lines that indicate contig boundaries. To order nonoverlapping probes, the clone/probe hybridization matrix was transposed and reordered in the computer. For both algorithms the number of differences between successive clones (probes) down the rows (columns) is computed and summed to form the total linking distance D. This total linking distance is minimized by randomly permuting the rows (or columns) and has been shown to produce the right ordering of clones for a large number of probes (17). This two-way ordering process establishes complementary minimal and redundant orders of probe and clone collections, respectively. Compression of physical maps by elimination of redundant clones results in a minimal map that retains all of the probes and one overlapping clone linking a pair of probes. A schematic of the ordering concept of nonoverlapping probes by overlapping clones is shown in B and the binary information that orders probes in C.
Testing the Nonrandomness of Repeats Along Chromosomes.
The null hypothesis is that S, R, and O clones are randomly distributed along the minimal maps. The alternative hypothesis is that the pattern of S, R, and O clones along a compressed map is nonrandom with the status of the next clone (S, R, or O) dependent only on the status of the current clone in walking along a chromosome. More precisely, the alternative hypothesis is that the pattern of S, R, and O clones in a compressed map is the realization of a stationary first-order Markov chain (19), in which the probability of the next clone being S, R, or O in a walk from left to right along the physical map depends only on whether or not the current clone in the walk is S, R, or O. The probabilities (Pij) that the current clone of type i (= S, R, or O) is proceeded by the next clone of type j (= S, R, or O) is called the transition matrix and describes the Markov chain (19). Under the alternative hypothesis we assume that all chromosomes represent independent realizations of the same Markov chain (i.e., have the same transition matrix) with the exception of chromosome V. A priori chromosome V is unusual in several respects—it has a small number of contigs (i.e., two) and contains the major rDNA cluster and thus is known to have a nonrandom distribution of repeats. A chi-squared test of the null hypothesis against the alternative hypothesis of a stationary Markov chain was performed as well as a homogeneity chi-squared test of the Markov chain across all chromosomes except chromosome V (19).
RESULTS
The primary clone collection (1) used to reconstruct the A. nidulans genome contained 5,134 clones (N) with an average insert size of 40 kb (L). The estimated genome size is 31 megabases (G), based on pulse field gel electrophoresis (see Table 1), suggesting that the library would contain approximately a total of 6.6 (= a) copies of the genome (a = LN/G), whereas 775 clones would represent one copy of the genome (N/a).
Table 1.
The physical map approximates the electrophoretic karyotype
| Fungal Genome Database
| ||||
|---|---|---|---|---|
| Chromosome | Coverage % | Physical sizes in Mb
|
Diff., % (Exp./PFE) | |
| Physical map* | PFE | |||
| I | 100 | 4.19 | 3.8 | +10.3 |
| II | 80 | 3.35 | 4.2 | −20.2 |
| III | 100 | 3.60 | 3.5 | +2.8 |
| IV | 96 | 2.79 | 2.9 | −3.8 |
| V | 81 | 3.09 | 3.8 | −18.6 |
| VI | 80 | 2.80 | 3.5 | −20.0 |
| VII | 100 | 4.24 | 4.5 | −5.8 |
| VIII | 88 | 4.39 | 5.0 | −17.6 |
| Total | 91 | 28.45 | 31.2 | −8.8 |
| 27.0† | ||||
PFE, pulsed field electrophoresis. Mb, Megabase.
Fungal Genome Database, version 124b.
The DNA reassociation kinetics from ref. 2.
The in vitro reconstruction of a chromosome, by permuting clones and probes in a binary clone/probe hybridization matrix, is described in Fig. 1. The rationale of nonoverlapping probes (tiles) ordered by overlapping clones on transposed matrices is shown in Fig. 1 B and C. The two-way ordered clone/probe hybridization matrix describes the redundant clone order down the rows and the minimal probe order across the columns. Because probes were selected from the clone list, probe names appear in the same order in the redundant and minimal display. In the minimal order probes are nonoverlapping and separated by gaps. In the redundant map, nonoverlapping probes appear in the same order but are linked by overlapping clones. Thus, the clone order can be compressed by deleting all redundant information. No unique mapping information is lost in the compression process, and a minimal collection of clones that represents the entire chromosome is determined.
Although it is important to start with a highly redundant library to find overlaps, that does not necessarily mean that the final map should maintain all of the initial information. Compression of a redundant map to a minimal map has several advantages. First, because probes are selected from the chromosome-specific clone list, it is unlikely that R clones that overlap with two flanking probes belong to another chromosome even if they strongly cross-hybridize with another chromosome. Thus, ambiguity in assignment of R and O clones to a chromosome is sidestepped, and only those R and O clones anchored on both sides by S clones are selected to complete the chromosome walk. Second, the major source of mapping errors is related to cross-hybridization that is complicated by the high level of redundancy of the libraries used to determine overlaps. In addition, redundant maps impose severe limitations on data processing capacity and storage. As a result, redundant maps are not as user friendly and are not as easily integrated with other mapping data (e.g., expressed sequence tags and genetic maps). Third, the compressed map is the appropriate context to estimate physical distances. Probes are nonoverlapping tiles (i.e., probes) laid down along the chromosome, and coverage of the chromosome by tiles progresses depending in part on the insert size (average of 40 kb). The gap size between two probes can be estimated based on the number of clones that hybridize to each pair of neighboring probes simultaneously along the physical map. In the present map, the gaps averaged ≈10 kb. Thus, each probe was associated with ≈50 kb of unique DNA sequence information, on average. Finally, compression of a redundant clone collection to a minimal map is a powerful molecular tool for isolating genes by various methods, such as complementation, walking, screening, or negative genetic selection (20) because the success rate is increased by at least 3-fold.
To demonstrate this increase in efficiency in isolating genes with the physical map, the Metzenberg and Kang (21) pooling scheme for finding a complementing clone among the 54 96-well plates holding the A. nidulans library might be used. Their procedure begins with pooling the DNA from 96 clones on each of the 54 microtiter plates for complementation, and then eight additional pools within a positive plate can be created to find a particular clone complementing a gene by transformation. If the minimum tilings of 1,438 clones were used, only 15 plates would be made followed by the eight additional pools within a positive plate to find a complementing clone. This strategy decreases the required pool size from 62 pools in a full library to 23 pools in a library containing the minimal map.
This physical mapping strategy is a major breakthrough for several reasons, both biological and technical. The technology can be applied to many organisms important in industry, agriculture, and medicine (5). The strategy provides: (i) automatically a portrait of how repeated sequences are distributed along each chromosome; (ii) a minimal map, which is a chromosome walk, thereby permitting efficient integration with other genetic data without interference from repeated or extraneous DNA sequences; (iii) a physical scale in kb for the physical map; and (iv) a physical map of each chromosome ordered in parallel at a rate of 16 probings per week by one technician versus two probings per week with each chromosome ordered sequentially one after the other (22).
The present map represents at least 91% of the A. nidulans genome by comparison of the minimal maps to pulsed field gel electrophoresis estimates of chromosome size (Table 1). The ordered clone/probe hybridization matrices that describe all eight chromosomes contain 4,941 (94%) of all clones assembled into 49 contigs.
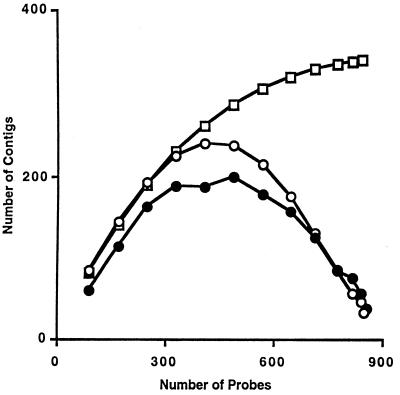
The observed and predicted numbers (15, 16) of anchored contigs (hybridized at least once to a probe) as a function of the number of nonoverlapping probes during the mapping experiment were in agreement with those predicted under sampling without replacement, in which nonoverlapping probes are chosen randomly (Fig. 2). For comparison predicted contig assembly dynamics were calculated according to Arratia et al. (23) for sampling with replacement and were 6-fold slower. The resolution of the current physical map was 29 kb, and the probe density was determined to be 1.4 (probe ends/cosmid).
Figure 2.
Contig assembly dynamics. Predicted number of contigs for sampling with (□) and without replacement (○) are compared with the observed values (•) for the genome reconstruction.
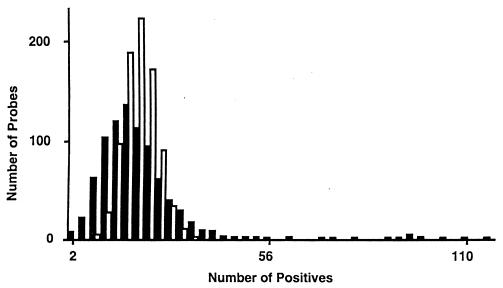
In Fig. 3 the distribution of hybridization signals was shown to assess randomness of probe hybridization. Although some probes hybridized too often and others hybridized too rarely, the distributions of hybridization frequencies revealed that on average each probe hybridized to 20 +/− 0.4 clones (Fig. 3). In addition, this tight distribution strongly indicated that the insert size was uniform throughout the library, suggesting that physical distance estimates (in kilobases) on compressed maps were precise.
Figure 3.
Distribution of expected (empty bars) and observed (filled bars) probe hybridization frequencies in the binary hybridization matrix.
If it were assumed that the cosmid library contained a total of 6.6 genome equivalents, then 6.6 clones should have hybridized to each probe on average. Because 61% of the clones contain multiple hybridization signals to other locations along a chromosome because of repeats or false positives, this assumption provided the major explanation for each probe hybridizing to 20 clones on average. Removing those clones with multiple hybridization signals (because of false positives or DNA repeats) from the physical map, each probe hybridized on average to 11 clones, which is closer to the expected 6.6 clones.
A close correlation (r = 0.97) between observed and expected contig size distributions was found (data not shown), and accentuated departures of the observed sizes relative to the predicted sizes would have indicated the presence of gaps (holes of missing DNA information or parts of the chromosome).
Direct comparisons with the genetic map, by creating links between both maps through loci whose positions are known on both maps, revealed agreement in 83% of the cases. Over 90% of the genes on the physical map were positioned by functional complementation with the cosmid library used here for physical mapping (1). From 53 loci, nine loci cannot be reconciled on both maps. Loci that showed the same physical and genetic locations were: uvsF, creA, pyrG, stuA, pabaA, yA, cysB, adC, adD, phytochrome, rodA, amdSI, bimB, areA, bimD, T1(IV, VIII), frA1, pyroA, apsA, nudC, cysC, sepB, facA, orlA, nimP, npeA, alcAR, nimO, wetA, gatA, alcC, benA, blem, benA, niaD, brlA, cbxC, oxpA, uaY, aldA, riboB, trpC, palB, and nirA. Loci that appeared out of order in their physical and genetic locations were: hxA, apsB, palF, tubA, qutCHDBGEAR, abaA, fwA, ivoB, and facB. Even though many of the problems associated with the occurrence of repeated DNA sequences were solved, the current strategy did not address the inconsistencies created by the occurrence of repeats within individual chromosomes (as indicated by three or more probes hybridizating to an individual clone) and hence the correct placement of some clones containing genes. In addition, the genetic map varied in its reliability.
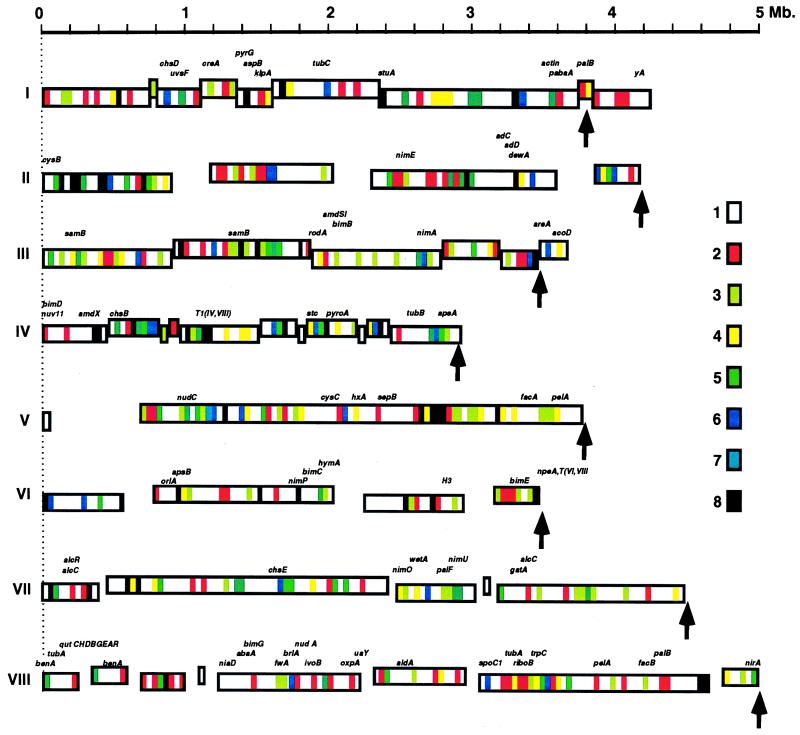
The distribution of repeated DNA sequences along the reconstructed chromosomes are shown in Fig. 4 and was obtained by determining the relative distribution of S, R, and O clones along the minimal tiling of each chromosome. Physical distances can be determined with reliability on compressed maps, and a size comparison between estimated physical sizes of chromosomes from pulsed field gel electrophoresis also was made (Fig. 4). Both estimates differed on average by 8.8% (Table 1), suggesting we have nearly covered the entire genome. Repeats appeared to be nonrandomly distributed along the chromosome and are present in 35.5% of the clones. Repeats that were common to all eight chromosomes, possibly indicative of redundant functional (e.g., replication origins, spindle attachment, etc.) or structural features, were clustered on average into two clearly defined regions (Fig. 4 and Web address http://fungus.genetics.uga.edu:5080).
Figure 4.
Distribution of repeated DNA sequences in the A. nidulans genome is nonrandom. Physical maps of individual chromosomes are listed across the rows and contigs represented by rectangles that correspond to their estimated sizes (in megabases). Contig rectangles are vertically offset to allow them to be easily distinguished. Arrows indicate the predicted chromosomal size from pulsed field gel electrophoresis. Gaps are indicated by empty spaces between contigs and were evenly distributed because we cannot determine, at this time, the exact position of contigs along the chromosomes. The individual sizes of gaps are unknown. Chromosomal regions containing repeated DNA sequences that are shared by eight or fewer chromosomes are indicated by the color-coded boxes.
It is clear from Fig. 4 that the R clones are dispersed along the whole chromosome but are nonrandom in their distribution (χ2 = 81.07, df = 29, P < 0.005; see Materials and Methods); therefore, the alternative hypothesis of a Markov chain describing the occurrence of S, R, and O clones along a chromosome at the 0.005 level is accepted. Although chromosome V is known to have a nonrandomly distributed, tandemly arrayed rDNA cluster, its physical map in Fig. 4 appears to have a random distribution of S, R, and O clones along its length. The resulting homogeneity chi-squared statistic testing for the same Markov chain describing all chromosomes (but that of V; see Materials and Methods) was 36.83 on 36 df, which is consistent with all chromosome maps (but that of V) being described by the same transition matrix:
 |
From the transition matrix describing the nonrandom distribution of S, R, and O clones along a chromosome it was more likely to see an S → S transition, but when an S → R transition took place, it was very likely (0.90) in the next step to switch back to S. The S and R clones were alternating, and this transition matrix could be used as a null hypothesis for physical mapping experiments of other fungi, in which it is a hypothesized that common evolutionary processes generate the repeat organization. There were some regions that were enriched for S clones, and there were other regions that were not as enriched. This nonrandom pattern, that was present throughout the genome, may suggest the presence of heterochromatic domains similar to cytological banding patterns observed in some other eukaryotes. Furthermore, nonrandom dispersal of repeated regions between regions enriched in chromosome-specific DNA sequences may account for the clustering of a significant proportion of A. nidulans genes in secondary metabolism (24, 25) and development (26, 27).
DISCUSSION
One possible mechanism by which clusters may arise and be maintained is by horizontal transfer (28). Under the selfish operon model (28) loosely aggregated genes carrying out a common biological function tend to shrink into tightly defined clusters (chromosome-specific DNA sequences) under horizontal transmission, and clustering of genes is predicted to be restricted to nonessential genes, such as those involved in secondary metabolism. When a gene cluster first colonizes a genome by any kind of horizontal transfer, it will need to be inserted into regions that are devoid of essential genes. One example is the spoC1 nonessential developmental gene cluster (27) that is flanked by repeated sequences (29), and another is the dispensable ST cluster (stc), involved in secondary metabolism (25), also embedded in a repetitive DNA region on chromosome IV (Fig. 4). Two testable predictions of the selfish operon hypothesis are that: (i) genes are clustered in regions enriched for chromosome-specific DNA in the white areas of Fig. 4 and (ii) a substantial fraction of these genes show similarities to genes only explainable by horizontal transfer (30–32). The exchange of cytoplasmic DNA across taxonomic boundaries is well documented in plants and animals (33), and there are recent reports strongly suggesting horizontal transfer in fungi as well (30–32).
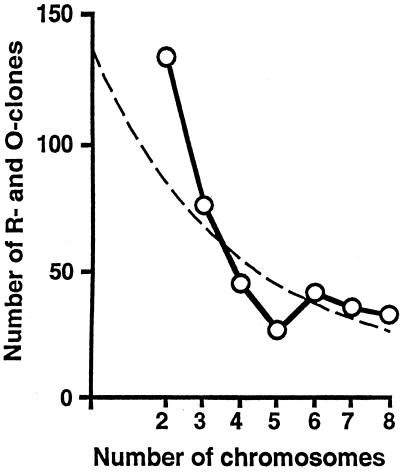
The final observation is that repeats that appear on two chromosomes occur twice as often as repeats that are shared between three chromosomes. The distribution of repeats across chromosomes is exponential-like (Fig. 5). A model of genome evolution also must explain this observation. The dispersion of repeated DNA sequences in the genome is the result of the action of at least two distinct processes: (i) repeats may be created as the result of chromosome rearrangement during DNA replication (inversions, translocations, duplications, etc.) or are introduced through horizontal interactions (e.g., retroviral infections) and (ii) repeats are dispersed throughout the genome as the result of translocations or movement of transposable elements (34). Characterization of the repeats and the observed distribution of repeats between chromosomes can be used to distinguish these two hypotheses: (i) recombinational origin for the repeat structure from recombination within chromosome rearrangements, or (ii) a selfish gene cluster hypothesis invoking horizontal transfer and transposition. For example, a mosaic structure to a gene or chromosome has been interpreted as evidence for horizontal transfer (35, 36). We propose that one explanation of the banding pattern is a model in which: (i) gene clusters arise by horizontal transfer of selfish gene clusters, and (ii) repeats are dispersed throughout the genome as the result of movement of transposable elements. The physical mapping strategy described here has provided a cost-effective alternative to genomic sequencing for examining genome organization and evolution. In the future, large-scale genomic sequencing will reveal how genes are organized and what repeats live in the A. nidulans genome.
Figure 5.
Repeats shared by two, three, or more chromosomes decrease in an exponential-like fashion. Distribution of R and O clones that hybridize to two, three, and up to eight chromosomes is shown. The data points are (2, 133), (3, 76), (4, 45), (5, 26), (6, 41), (7, 35), and (8, 32). Dashed line shows the fitted exponential curve for comparison (r = 0.808).
Acknowledgments
We thank R. Aramayo, M. E. Case, A. J. Clutterbuck, S. Covert, M. T. G. Cushion, R. Fundyga, D. M. Geiser, and B. Jasny for critical reviews of the manuscript. We also thank E.S. Lander, S. Slaugenhaupt, and D. Grothues for valuable discussions before publication. This work was supported by grants from the National Institutes of Health (GM 37886), National Science Foundation (BIR-9422896 and MCB-9630910), University of Georgia Research Foundation, and Georgia Research Alliance (GCOMM94.AD.E and GCOMM95.500).
References
- 1.Brody H, Griffith J, Cuticchia A J, Arnold J, Timberlake W E. Nucleic Acids Res. 1991;19:3105–3109. doi: 10.1093/nar/19.11.3105. [DOI] [PMC free article] [PubMed] [Google Scholar]
- 2.Timberlake W E. Science. 1978;202:773–775. doi: 10.1126/science.362530. [DOI] [PubMed] [Google Scholar]
- 3.Clutterbuck A J. Genetics. 1969;63:317–327. doi: 10.1093/genetics/63.2.317. [DOI] [PMC free article] [PubMed] [Google Scholar]
- 4.Timberlake W E. Curr Opin Genet Dev. 1991;1:351–357. doi: 10.1016/s0959-437x(05)80299-0. [DOI] [PubMed] [Google Scholar]
- 5.Clutterbuck A J, Timberlake W E. In: Development: The Molecular Genetic Approach. Russo V E A, editor. Berlin: Springer; 1992. pp. 103–119. [Google Scholar]
- 6.Timberlake W E, Marshall M A. Science. 1989;244:1313–1317. doi: 10.1126/science.2525275. [DOI] [PubMed] [Google Scholar]
- 7.Prade R A, Timberlake W E. EMBO J. 1993;12:2439–2447. doi: 10.1002/j.1460-2075.1993.tb05898.x. [DOI] [PMC free article] [PubMed] [Google Scholar]
- 8.Aramayo R, Timberlake W E. EMBO J. 1993;12:2039–2048. doi: 10.1002/j.1460-2075.1993.tb05853.x. [DOI] [PMC free article] [PubMed] [Google Scholar]
- 9.Geiser D M, Arnold M L, Timberlake W E. Proc Natl Acad Sci USA. 1994;91:2349–2352. doi: 10.1073/pnas.91.6.2349. [DOI] [PMC free article] [PubMed] [Google Scholar]
- 10.Morris R N. Cell. 1976;8:357–363. doi: 10.1016/0092-8674(76)90147-1. [DOI] [PubMed] [Google Scholar]
- 11.Smith J M, Davies J E, Holden D W. Mol Microbiol. 1993;9:1071–1077. doi: 10.1111/j.1365-2958.1993.tb01236.x. [DOI] [PubMed] [Google Scholar]
- 12.Dean R A, Timberlake W E. Plant Cell. 1989;1:265–273. doi: 10.1105/tpc.1.3.265. [DOI] [PMC free article] [PubMed] [Google Scholar]
- 13.Hudson T J, Stein L D, Gerety S S, Ma J, Castle A B, et al. Science. 1995;270:1945–1954. doi: 10.1126/science.270.5244.1945. [DOI] [PubMed] [Google Scholar]
- 14.Wang Y, Prade R A, Griffith J, Timberlake W E, Arnold J. Proc Natl Acad Sci USA. 1994;91:11095–11098. doi: 10.1073/pnas.91.23.11094. [DOI] [PMC free article] [PubMed] [Google Scholar]
- 15.Zhang M Q, Marr T G. Proc Natl Acad Sci USA. 1993;90:600–604. doi: 10.1073/pnas.90.2.600. [DOI] [PMC free article] [PubMed] [Google Scholar]
- 16.Palazzolo M J, Sawyer S A, Martin C H, Smoller D A, Hartl D I. Proc Natl Acad Sci USA. 1991;88:8034–8038. doi: 10.1073/pnas.88.18.8034. [DOI] [PMC free article] [PubMed] [Google Scholar]
- 17.Xiong M, Chen H J, Prade R A, Wang Y, Griffith J, Timberlake W E, Arnold J. Genetics. 1996;142:267–284. doi: 10.1093/genetics/142.1.267. [DOI] [PMC free article] [PubMed] [Google Scholar]
- 18.Cuticchia A J, Arnold J, Timberlake W E. Genetics. 1992;132:591–601. doi: 10.1093/genetics/132.2.591. [DOI] [PMC free article] [PubMed] [Google Scholar]
- 19.Basawa I V, Rao B L S P. Statistical Inference For Stochastic Processes. New York: Academic; 1980. pp. 62–63. [Google Scholar]
- 20.Hensel M, Shea J E, Gleeson C, Jones M D, Dalton E, Holden D W. Science. 1995;269:400–403. doi: 10.1126/science.7618105. [DOI] [PubMed] [Google Scholar]
- 21.Metzenberg R L, Kang S. Fungal Genet Newslett. 1987;34:44–45. [Google Scholar]
- 22.Mizukami T, Chang W I, Garkavtseve I, Kaplan N, Lombardi D, Matsumoto T, Niwa O, Kounosu A, Yanagida U, Marr T G, Beach D. Cell. 1993;73:121–132. doi: 10.1016/0092-8674(93)90165-m. [DOI] [PubMed] [Google Scholar]
- 23.Arratia R, Lander E S, Tavare S, Waterman M S. Genomics. 1991;11:806–827. doi: 10.1016/0888-7543(91)90004-x. [DOI] [PubMed] [Google Scholar]
- 24.Geever R F, Huiet L, Baum J A, Tyler B M, Patel V B, Rutledge B J, Case M E, Giles N H. J Mol Biol. 1989;207:15–34. doi: 10.1016/0022-2836(89)90438-5. [DOI] [PubMed] [Google Scholar]
- 25.Brown D W, Yu I-H, Kelkar H S, Fernandes M, Nesbitt T C, Keller N P, Adams T H, Leonard T J. Proc Natl Acad Sci USA. 1996;93:1418–1422. doi: 10.1073/pnas.93.4.1418. [DOI] [PMC free article] [PubMed] [Google Scholar]
- 26.Aramayo R, Adams T H, Timberlake W E. Genetics. 1989;122:65–71. doi: 10.1093/genetics/122.1.65. [DOI] [PMC free article] [PubMed] [Google Scholar]
- 27.Orr W C, Timberlake W E. Proc Natl Acad Sci USA. 1982;79:5976–5980. doi: 10.1073/pnas.79.19.5976. [DOI] [PMC free article] [PubMed] [Google Scholar]
- 28.Lawrence J G, Roth J R. Genetics. 1996;143:1843–1860. doi: 10.1093/genetics/143.4.1843. [DOI] [PMC free article] [PubMed] [Google Scholar]
- 29.Gwynne D I, Miller B L, Miller K Y, Timberlake W E. J Mol Biol. 1984;180:91–109. doi: 10.1016/0022-2836(84)90432-7. [DOI] [PubMed] [Google Scholar]
- 30.Buades C, Moya A. J Mol Evol. 1996;42:537–542. doi: 10.1007/BF02352283. [DOI] [PubMed] [Google Scholar]
- 31.Hibbett D S. Mol Biol Evol. 1996;13:903–917. doi: 10.1093/oxfordjournals.molbev.a025658. [DOI] [PubMed] [Google Scholar]
- 32.Masel A M, He C, Poplawski A M, Irwin J A G, Manners J M. Mol Plant-Microbe Interact. 1996;9:339–348. [Google Scholar]
- 33.Arnold J. Annu Rev Ecol Syst. 1993;24:521–554. [Google Scholar]
- 34.Amutan M, Nyyssonen E, Stubbs J, Dias-Torres M R, Dunn-Coleman N. Curr Genet. 1996;29:468–473. doi: 10.1007/BF02221516. [DOI] [PubMed] [Google Scholar]
- 35.Delerme C, Godon J J, Ehrlich S D, Renault P. Microbiology. 1994;140:3053–3060. doi: 10.1099/13500872-140-11-3053. [DOI] [PubMed] [Google Scholar]
- 36.Smith J M. J Mol Evol. 1992;34:126–129. doi: 10.1007/BF00182389. [DOI] [PubMed] [Google Scholar]


