

Abstract
Biological systems by default involve complex components with complex relationships. To decipher how biological systems work, we assume that one needs to integrate information over multiple levels of complexity. The songbird vocal communication system is ideal for such integration due to many years of ethological investigation and a discreet dedicated brain network. Here we announce the beginnings of a songbird brain integrative project that involves high-throughput, molecular, anatomical, electrophysiological and behavioral levels of analysis. We first formed a rationale for inclusion of specific biological levels of analysis, then developed high-throughput molecular technologies on songbird brains, developed technologies for combined analysis of electrophysiological activity and gene regulation in awake behaving animals, and developed bioinformatic tools that predict causal interactions within and between biological levels of organization. This integrative brain project is fitting for the interdisciplinary approaches taken in the current songbird issue of the Journal of Comparative Physiology A and is expected to be conducive to deciphering how brains generate and perceive complex behaviors.
Keywords: Bayesian network, cDNA microarray improvement, Multielectrode array, Neural network, Zebra finch
Introduction
This report is divided into three sections: (1) a rational and background for the biological levels of analysis useful for the integration of the songbird brain; (2) a description of the technologies that we have used and developed for integration; and (3) the development of a bioinformatic approach that we have used and developed to begin to bring all levels together. As such, this report is not only results-driven, but also a conceptual framework study in which to consider future systems approaches on integrating the neurobiology of a vertebrate brain system.
Rational and background
In the late 19th and early 20th century, physicists became adept at developing equations, called laws, which described fundamental principles of nature and the observable universe. The driving force behind these discoveries was to find the minimum set of features (i.e., particles and forces) necessary for describing nature. This type of approach led to powerful explanations for the workings of non-biological systems of the universe (reviewed by Kaku 1994; Kaku and Thompson 1995). However, when such approaches were applied to biological systems, the challenge became daunting, as biological systems appeared to have evolved rules that are more complex. When applied to the brain, the task was more daunting due to the high number and variability of dendritic and axonal connections. Partly out of this effort, the fields of neural networks and artificial intelligence (AI) grew (Zeidenberg 1987). However, neural networks and AI instead had much more success at enhancing computer technology than they did to help understand how brains work (Minsky 1986). We believe that part of the problem resides in having flawed biological data, insufficient biological data, and not well-defined biological systems to model.
In recognition of such limitations we have modified Philip Anderson’s (Anderson 1994; Jenkins 2000) proposed hierarchy of complexity for biological systems (Fig. 1) as a basis to consider biological levels of analysis necessary for integrating a brain system. Here, science higher in the hierarchy obeys the laws of science lower. However, it is not the case that physiology is just applied cell biology or molecular biology is applied particle physics, several levels removed. Rather, as suggested by Anderson (1994), at each level of complexity entirely new properties appear. Hence, according to this view, the level of complexity increases immensely in the hierarchical structure of biological systems.
Fig. 1.

Proposed hierarchy of complexity and organization for biological systems, and in particular for social behavior and its control by the brain, as modified from Anderson (1994). Some levels of complexity are hyphenated with additional terms such as behavior, neurophysiology and anatomy, to specifically consider the brain. We changed Arrows have been changed to lines only to indicate that these links are viewed as bi-directional
Studies on the brain have traditionally considered levels of analysis from chemistry on up. Bringing these levels or a subset of them together requires a well-defined system. The songbird vocal communication system provides one.
Why the songbird system
The songbird vocal communication system is ideal for deciphering natural rules of how a subsystem of the brain works at different biological levels of organization. Songbird vocal learning behavior has been well characterized with over 50 years of ethological research (Marler 1955; Thorpe 1961; Marler 1997). The anatomy of the brain circuits responsible for vocal communications have been well studied, and found to be discreetly localized (Nottebohm et al. 1976; Brenowitz et al. 1997). The molecular and electrophysiological workings of the pathways, when studied from a neuroethological perspective, have yielded significant insight into how a brain perceives species-specific sounds (Mello et al. 1992; Chew et al. 1995; Ribeiro et al. 1998), generates them (Yu and Margoliash 1996; Jarvis and Nottebohm 1997; Fee and Leonardo 2001) and does so within different social contexts (Jarvis et al. 1998; Hessler and Doupe 1999b). These levels of analysis encompass hierarchical biological complexity from molecular to social behavior (Fig. 1), to an extent not accomplished with any other system of which we are aware. Moreover, songbirds have the rare trait of vocal learning, the ability to imitate sounds that are heard, and thus, are one of the few animal groups with a similar behavioral substrate as that used for human language. Vocal learning systems in other avian species, parrots and hummingbirds (Jarvis and Mello 2000; Jarvis et al. 2000), and probably in humans (Jarvis 2001), have evolved similar anatomy. Because of these similarities, songbirds are currently the best-studied neural model of vocal learning. Yet, songbird vocal communication have many features in common with other sensory and motor systems of vertebrates (Bottjer and Johnson 1997; Jarvis et al. 1998; Perkel and Farries 2000; Jarvis 2001), making songbirds amenable to deciphering basic principles of brain function.
Levels of analysis for integration
To begin, we choose four levels of analysis, those that are most salient for brain function and which have been best studied: molecular, anatomical, electrophysiological, and behavioral. Within these levels, we choose the following features: mRNA gene expression, regional anatomical connectivity, action potentials, and vocalization spectrographs. Justification and background for these levels of analysis and features are as follows.
Anatomical
We believe anatomy to be the most critical level for understanding basic rules of brain function, and therefore required for an integrative project. Whether in a nematode, fruit fly, songbird, or human brain, neurons consist of dendrites, cell body, and axons. They also appear to express overlapping sets of homologous genes (Cravchik et al. 2001). What appears to make the difference between a neural system that can automatically move an appendage and one that can learn how to imitate sounds is anatomical connectivity. In support of this conclusion, one major difference between vocal learners and vocal non-learners is that only the former have forebrain regions connected to brainstem vocal regions (Striedter 1994; Durand et al. 1997; Gahr 2000; Jarvis et al. 2000).
Although the connectivity of songbird vocal communication system has been described in various reports, the manner in which we view the system for our integrative project differs as briefly described below (a more detailed explanation will be presented elsewhere by Jarvis). The songbird vocal communication system consists of three basic subsystems: (1) an auditory pathway, (2) a posterior vocal pathway, and (3) an anterior vocal pathway (Fig. 2). The auditory pathway follows a design seen in all amniote vertebrates studied. Projections traverse from ear hair cells to the cochlear nuclei of the brainstem, to lateral lemniscal nuclei also of the brainstem, to a midbrain nucleus, a thalamic nucleus, onto telencephalic primary receiving neurons, and finally to secondary and tertiary telencephalic neurons (Fig. 2; blue structures). As in mammals, a descending auditory system exists, which begins from the HVC shelf onto the robust nucleus of the archistriatum (RA) cup back to thalamic and midbrain auditory areas (Fig. 2). The posterior and anterior vocal pathways are unique to vocal learners (Jarvis et al. 2000). The songbird posterior vocal pathway forms connections from the pallial vocal nuclei HVC to RA to midbrain and brainstem vocal motor and respiratory neurons that synapse onto muscles of the vocal organ, the syrinx, as well as the larynx and expiratory chest muscles (Fig. 2, yellow structures and black arrows). In songbirds, this pathway is responsible for production of learned vocalizations (Nottebohm et al. 1976). The anterior vocal pathway forms a loop characteristic of non-vocal regions of the mammalian brain, a pallial (lateral subdivision of the magnocellular nucleus of the anterior neostriatum; lMAN)→basal ganglia (area X of the avian striatum; area X)→thalamic (medial subdivision of the dorsal lateralnucleus of the anterior thalamus; DLM)→pallial (lMAN) loop (Fig. 2, red structures and white arrows). This pathway is responsible for vocal learning (Bottjer et al. 1984; Scharff and Nottebohm 1991) and may also have a role in adult song social context, syntax and maintenance (Jarvis et al. 1998; Hessler and Doupe 1999b; Williams and Mehta 1999; Brainard and Doupe 2000; Kobayashi et al. 2001). In songbirds, input to the loop comes from HVC, whereas output leaves from lMAN (Fig. 2; dashed arrows). A property specific to birds is that within the loop the pallidal component may reside as a mixed population within the striatal component in area X, whereas in mammals it is separate (Luo and Perkel 1999).
Fig. 2.

Diagram of auditory and vocal pathways in the songbird brain (rational of connectivity view to be reported in detail separately). The cerebrum is divided into its major subdivisions (gray lines) using names of historical nomenclature that incorrectly over-uses the term striatum. The exact names will be changed without changing most abbreviations, and therefore all abbreviations are not spelled out in this report. For a translation from old to new terminology see http://jarvis.neuro.duke.edu/nomen/2002NomenclatureTable.html. Relevant to the current discussion, all regions above the lmd lamina are considered pallial and in mammals gives rise to cortex, claustrum, and parts of amygdala. All regions below are considered basal ganglia in both birds and mammals. Color-coding: blue auditory structures; yellow vocal structures that are part of the vocal motor pathway (or posterior vocal pathway); red vocal structures that are part of the vocal basal ganglia pathway (or anterior vocal pathway), lateral half. Connections within the vocal basal ganglia pathway are shown by white lines. Connections between the two vocal pathways are shown by dashed lines. Some connections are not shown for clarity. These include connections from nucleus uvaeformis (Uva) to nucleus interfacialis (NIf) and to high vocal center (HVC), and from the dorsomedial subdivision of nucleus intercollicularis (DM) to Uva, the medial part of the vocal basal ganglia pathway, and the medial part of the auditory pathway that includes the caudal medial neostratum (NCM) and the medial subdivision of the caudal region of the hyperstriatum ventrale (CMHV)
Other features of anatomy include connectivity within the same brain nucleus, differential synaptic organization, and cellular localization of individual transmitter molecules and their receptors. Although important features, for this project we begin modeling connectivity between vocal communication structures of different brain regions, and reserve the inclusion of other features for the future. Our reason is that more information is known about general connectivity between brain regions than within.
Molecular
After the discovery the genetic code in DNA in the 1950s (Watson and Crick 1953), it became a common belief that everything about biological systems, including the brain, could be understood from molecular principles alone. We do not adhere to this belief. We assume, however, that molecular analysis is essential for understanding and integrating brain function. DNA instructed molecules (RNA, proteins and their products) are responsible for synaptic transmission, electrical impulses and construction of brain networks. The ideal feature to model would be proteins and their products, as these perform most of the action for biological systems. However, high-throughput molecular technology to date is more advanced for RNA detection. Much insight into biological processes has also been gained by examining mRNA gene expression in songbirds.
For example, when birds hear species-specific songs, mRNA synthesis for several activity-responsive genes (ZENK, c-jun, c-fos and BDNF) is rapidly increased in subsets of structures of the auditory pathway (Mello et al. 1992; Mello and Clayton 1994; Nastiuk et al. 1994; Bolhuis et al. 2000; Li and Jarvis 2001). When birds sing, mRNA synthesis of some of these same genes is increased in subsets of structures of the vocal pathway (Jarvis and Nottebohm 1997; Kimbo and Doupe 1997; Li et al. 2000; Li and Jarvis 2001). The first three genes are transcription factors; they regulate expression of specific target genes (Robertson 1992; Herdegen and Leah 1998). The latter, BDNF, is a trophic factor and is released from cells to bind to receptors that lead to changes in cell signaling, gene expression, and cell survival (Altar et al. 1997). For the songbird vocal communication system, the ZENK gene has been the most studied, and has the widest distribution in the auditory and vocal pathways. Study of its mRNA regulation led to the findings that the auditory pathway is most active when a bird listens to species-specific sounds (Mello et al. 1992) and that this activation habituates as the birds become familiar with a song (Mello et al. 1995). Study of its mRNA regulation in the vocal pathway led to the findings that all telencephalic vocal nuclei are active during singing in juvenile and adult animals (Jarvis and Nottebohm 1997) when it was once assumed that only a subset were active in adults, and that this activation is social context dependent (Fig. 3; Jarvis et al. 1998).
Fig. 3.

ZENK gene regulation due to singing in different social contexts. This finding links behavior, social context, brain anatomy, and gene regulation. Top panels show parasagittal zebra finch male brain sections stained with cresyl violet (red color) and a 35S-labeled ZENK riboprobe (white silver grains) by in-situ hybridization detecting ZENK mRNA. The bottom panel shows representative bird behaviors. At the bottom left, a male (orange cheek patched, poker dot and zebra striped chest animal perched at right) sang many times towards a female (relatively uniform animal perched at left), called directed singing. At the bottom right, a male (perched at left) sang many times in the presence of another male (perched at right) but not facing him, called undirected singing. In both cases, singing behavior drives ZENK mRNA synthesis in the vocal motor nucleus HVC. However, only undirected singing drives high ZENK synthesis in the lateral part of the vocal basal ganglia pathway (lArea X and lMAN). Modified from Jarvis et al. (1998)
The translation into and thus regulation of ZENK protein closely matches that of its mRNA (Mello and Ribeiro 1998). However, in one song nucleus, RA, dissociation is found between the amount of mRNA and subsequent protein synthesized, where it is faithfully translated in juvenile zebra finch RA but not in adult RA (Whitney et al. 2000). Thus, as in most systems, protein synthesis does not always reflect mRNA synthesis. This dissociation, however, did not prevent the use of mRNA as a feature to describe molecular properties of brain function. Rather it demonstrates the complexity involved in biological systems and the need to study many features. These include protein phosphorylation, glycosylation, and lipid and sugar synthesis. However, for this integrative project we begin with the molecular feature that can be studied with the most currently advanced technology and that has yielded the most useful information, RNA.
Electrophysiological
It is clear that all brains use electrical signaling to communicate across and between cells, perceive stimuli, and regulate actions. Consequently, many neuroscientists believed that all that was necessary to understand brain function was electrophysiological signaling and connectivity. We also do not adhere to this belief and argue that electrical signaling analysis is essential for understanding and integrating brain function but in the context of the molecules (RNA, proteins and their products) and behaviors involved.
The most studied and robust feature of electrical signaling is the action potential. In songbirds, behaviorally relevant action potentials have been found and studied in the auditory and vocal pathways. In the secondary and tertiary areas of the auditory forebrain, neurons fire action potentials at a high rate when birds hear species-specific songs and this firing rate decreases (habituates) to a baseline level as the birds become familiar with hearing a song (Chew et al. 1995; Stripling et al. 1997). The rate and presence of habituation differs in different parts of the auditory system, being low or absent in some. These differences in electrical activity parallel that seen with ZENK mRNA synthesis; here, both the electrophysiology and gene expression heuristically reflects neuronal memory. In the vocal system, robust action potentials occur when birds produce learned song (Yu and Margoliash 1996; Hessler and Doupe 1999a). The rate and pattern of action potential firing also differs in different vocal nuclei (Yu and Margoliash 1996), and when singing in different social contexts (Hessler and Doupe 1999b), again parallel to ZENK mRNA synthesis changes.
There are other features at the electrophysiological level such as changes in pre- and post-synaptic subthreshold potentials, which have been studied in songbirds. Technically, however, these are most feasibly obtained in anesthetized animals or tissue slices as they often require isolating single cells (Spiro et al. 1999; Mooney 2000). Although important features, we chose to begin with multiunit action potentials (combined measured electrical activity from a small population of cells – two to six) as these can be easily measured in awake behaving animals.
Behavioral
We define behavior here as perception (sensory processing) and action (motor activity). For the songbird vocal communication system, this involves the features of hearing (sensory), vocalizing (motor), and sensorimotor integration of the two. The specialized use of these behavioral features in songbirds shares similarities with the development of human speech. Songbirds, like humans, undergo four general developmental stages during which they learn how to imitate sounds (Marler 1970; Doupe and Kuhl 1999). These are called sensory acquisition (forming auditory memories), subsong (akin to babbling), plastic song (akin to child speech development), and crystallization (akin to puberty) where the voice becomes adult-like and breeding is possible. Unlike in primates, however, there are many species of vocal learning songbirds (over 4,000; Sibley and Ahlquist 1990) and many variations upon this theme (Catchpole and Slater 1995). For this project, we begin with basic vocal communication features of hearing song and vocalizing song in adults. We have not yet incorporated learning song.
Use and development of resources and technologies for songbird brain integration
Models of how a system works are only as good as the data used. If the data is flawed, then so is the model. In addition, although technologies for individual levels of biological organization are well developed, not all have been applied to songbird brains, and many in the current states do not lend themselves for integration. In this section, we present criteria for accepting data for integration, and recent advances in technologies that we have been developing for both within one level of analysis and for integration between levels for the songbird brain. All original results presented in this section will be covered in more detail in separate future reports.
Anatomical
Neural connectivity of the songbird vocal communication system (auditory and vocal), particularly of zebra finches, has been extensively studied; multiple methods have been used to detect this connectivity. However, not all methods yield reliable results and not all studies are rigorous. This is where neural network and AI studies have their obstacles for explaining brain function. Many have depended upon unreliable connectivity results. Here we apply stringent criteria for inclusion of connectivity data:
The connection must have been determined with a tracer that does not heavily label fibers of passage.
The connection must have been verified in both the anterograde (from cell bodies to terminals) and retrograde (from terminals to cell bodies) directions.
Tracer injections must be restricted to the brain region studied, and/or connectivity determined by subtraction of multiple injections in overlapping brain regions.
Examples of the need for criterion 1 arise when using the tracer DiI, where axons passing through a brain region, but not connected with it, take-up the dye and transport it (Hofmann and Bleckmann 1999), yielding a false-positive result. A number of tracers (biocytin and dextran amines, for example) have minimal axonal uptake (Molecular Probes). However, it is not possible to entirely prevent axonal uptake. Thus, anterograde and retrograde verification (criterion 2) is a second means to prevent false-positives. With such stringent criteria, it is hoped that our network models will have a high level of accuracy. Most connections shown in the diagrams of Fig. 2 pass these criteria, and will be the starting point for the basis of our modeling. As a great amount of information has been published on connectivity (from the laboratories of Nottebohm, Bottjer, Ball, Wild, and Perkel, for example), there is no immediate need for additional experiments. However, some connections, for example HVC to nucleus avalanche (Av), need verification, and others, such as the songbird HVo-like nucleus, need to be entirely determined.
Molecular
Molecular characterization of the songbird vocal communication system requires a great amount of additional work. Technologies exist to concurrently assay mRNA expression from thousands, if not from all genes, present in an organism. The most economical and feasible approach is the high-throughput method called cDNA microarrays, or gene chips. Here, thousands of cloned cDNAs, generated by reverse transcription from the mRNAs, are spotted onto replicate glass slides or other substrates. These slides are then hybridized with labeled control and experimental cDNA probes from tissues of interests. A scanner linked to a computer is used to detect differential binding of the probes to the complimentary strands of the arrayed cDNAs (Brown and Botstein 1999).
This approach has not yet been applied to songbirds, resulting in a gap between songbird and mammalian, fish, and insect molecular research (Soares 1997; Churchill and Oliver 2001; Clark et al. 2001; Miki et al. 2001). To narrow this molecular gap, we have formed a consortium of investigators from Duke University in the USA and RIKEN Institute in Japan, that has the following aims: (1) clone full-length cDNAs from normalized zebra finch brain libraries that represent mRNAs expressed during commonly studied vocal communication states, (2) characterize these cDNAs by sequencing, and (3) use them to generate non-redundant cDNA microarrays for asking biological questions. We report here the initial results of these aims.
A normalized cDNA library is preferred as it contains more equal representation of genes, whether originally low, medium, or high abundance (Bonaldo et al. 1996; Soares and de Fatima Bonaldo 1998). This reduces labor and cost needed to obtain many unique cDNAs. Full-length cDNAs are needed, not for the cDNA microarrays, but for translating them into proteins in experiments designed to determine gene function. However, the generation of normalized and full-length cDNA libraries of any species has been limited by technology. Dr. Carninci and colleagues within Dr. Hayashizaki’s genomics group of RIKEN spent the past 7 years perfecting the generation of normalized and full-length cDNA libraries with mouse tissue (Carninci et al. 1996, 2001; Carninci and Hayashizaki 1999). The libraries and clones they have obtained are the most non-redundant and full-length to date (Kawai et al. 2001; Sugahara et al. 2001).
At RIKEN, Dr. Wada and Dr. Rivas of our group applied RIKEN’s most recent technology (Carninci et al. 2001) to generate three normalized full-length cDNA libraries from total brains (cerebrum, cerebellum, thalamus, midbrain, and brainstem) of five male zebra finches: killed after singing over 30 min of undirected song in a cage alone in an aviary (n=3 pooled; Duke University–Jarvis aviary); after 10 h overnight of sleeping in a sound box followed by 20 min of silence with lights on, then singing 40 min of 130 bouts of directed song to an introduced female (n=1; Japan – Hironobuchi Sakaguchi aviary); and after the same overnight condition followed by 1 h of silence with the lights on (n=1; Sakaguchi aviary). The behavioral protocols for singing were as described previously (Jarvis et al. 1998). Our purpose was to maximize the differences between the bird’s behaviors such that differentially expressed genes would be present in the different cDNA libraries. The bird brain mRNA was isolated, converted to cDNAs, and the cDNAs then cloned into a multifunctional bacterial vector pFLC-I (Fig. 4). This cloning vector allows directional insertion of cDNAs, prevention of chimeras (i.e. two or more cDNAs end-to-end), cloning capacity from 0.2–15.4 Kb (well beyond the size range of the average eukaryotic cDNA molecule, 1–3 Kb), and synthesis of RNA transcripts for expression analysis (Carninci et al. 2001). Our libraries had titers of the order of 105 bacterial transformants, i.e., individually cloned cDNAs.
Fig. 4.

A–C Construction of full-length and normalized songbird brain cDNA libraries. Over 20 major steps are necessary (Carninci et al. 2001). Only key subsets are shown here. A We first isolated intact single stranded mRNA from zebra finch brains (green). PolyT-BamHI primer was used to synthesize first strand cDNA (orange) from the 3′-end. The mRNA:cDNA hybrid was captured (with an anchor) by its 5′-cap structure. After capture, the mRNA strand was removed and a XhoI primer-adaptor ligated to the 5′-end of the cDNA. The first strand cDNA was normalized by subtractive hybridization against the original mRNA population. The second strand cDNA was then synthesized, using a 5′-primer-adaptor. B In the second phase, the double stranded cDNA was restricted with XhoI and BamHI, size selected and ligated into the λ-Full-Length Cloning vector I-E (λ-FLC-I-E), which accepts 0.2–15.4 Kb size cDNAs. Internal sites were protected by methylation. C In the third phase, the Cre recombinase enzyme was used for in vitro excision (at the loxP sites) of the plasmids containing songbird cDNAs [plasmid is derived from pBluescript KS (+); Stratagene]. Songbird cDNA-plasmid bacterial transformants were selected by the plasmid’s ampicillin resistance gene (Ampr). The arrows under the cDNA in B and C show orientation of the songbird clones, from 5′ to 3′. L and R, left and right; ori, origin of replication for E. coli. Modified from Carninci et al. (2001)
For initial clone characterizations, we randomly picked 384 bacterial colonies, i.e., cDNA clones, from the various libraries and isolated their plasmid DNAs. A subset (36) was subjected to PvuII restriction digest to release the inserts and checked on an agarose gel. Insert sizes ranged from 1.4–8.0 Kb (~3.0 Kb average), which is much larger than the usual ~1.2 Kb average from standard non full-length cDNA libraries. Sequencing of ~600 bp from both directions (5′- and 3′-ends) of the clones was then performed at the Duke Center for Genome Technology by Dr. Dietrich’s group. The sequences were run through a processing and organizing software called DNAprocess written in Perl by Lin and McConnell, that (1) performs base calls for the sequence and checks for sequence quality using phred (Ewing and Green 1998; Ewing et al. 1998) obtained at http://www.phrap.org; (2) if good quality, finds and clips off vector and primer sequences using cross-match (also obtained at http://www.phrap.org); (3) takes the remaining cDNA sequence and performs a Genbank blast search to find identities; (4) a Gene Ontology (GO) database search to infer gene function (Ashburner et al. 2000) (http://www.geneontology.org/); (5) a UniGene database search to infer other information (http://www.ncbi.nlm.nih.gov/UniGene/); and (6) deposits the annotated songbird sequence into our songbird cDNA database (http://www.dbsr.duke.edu/songbird). Steps 3–5 are done by a sub-routine called UgoBLAST (S. Lin and P. McConnel, unpublished).
Of the 384 clones, 296 (77%) had reasonable sequence quality with at least a good read in one direction. Those that did not were hampered due very high GC content in their 5′ ends, a typical feature also found in mammalian genes, or at AT rich 3′ ends. Matching the 296 clones to each other (>95% with over 150 bp or more of DNA sequence), it was found that they formed 277 cDNA clusters, which presumably represent 277 transcriptional units, or genes. The clones were subclustered based upon nearly exact matches (99% over the entire sequence except overhangs), and we found that nearly all (294) were unique. That is, of the 296 clones, 17 ([296–277]− 1) appear to be alternatively spliced or modified. Therefore, our songbird cDNA libraries are well normalized, with an absolute redundancy of 2 out of 296 initial randomly picked clones.
UgoBLAST found that 70% (207 of the 296 clones; or 193 of the 277 clusters) had significant homology to mammalian sequences, with percent identity ranging from 70% to 100% (<10−4 probability; search performed January 2002). Most matches were to human and rodent genes, as these are the most common mammalian sequences in Genbank. Thus, the large majority of genes present and expressed in the songbird brain are also present in mammals, and the molecular level analysis for our songbird integrative project will be partly applicable to mammals. Of the 277 clusters, only 18% matched already cloned avian cDNAs sequences in Genbank. This shows that a great deal of new avian gene discovery is being made with this project.
Of all the 207 Genbank matched clones, 76 (37%) were found in the GO database, which we annotated with GO terms. A list of the most frequent annotated terms is in Table 1. Most represent nucleus, cell membrane, and signal transduction proteins. The remaining songbird brain cDNAs, whether homologous to another species or not, are of unknown function, as in humans and fruit flies (Venter et al. 2001). Thus, for our integrative project, at least a subset of the clones will have inferred function.
Table 1.
Gene ontology (GO) terms applied to 76 songbird cDNAs. GO terms form three large categories: molecular function, biological process, and cellular component. Individual cDNA products can have multiple functions and at least one cellular location, and thus, each cDNA is often assigned more than one term. For example, the 7 DNA binding proteins are a subset of the 16 songbird clones with presumed locations in the nucleus
| Gene ontology term | No. of clones |
|---|---|
| Nucleus | 16 |
| Membrane fraction | 15 |
| Cytoplasm | 12 |
| Signal transduction | 11 |
| Protein binding | 10 |
| ATP binding | 9 |
| DNA binding | 7 |
| Integral plasma membrane protein | 7 |
| Calcium binding | 7 |
| RNA binding | 6 |
| Plasma membrane | 6 |
| Intracellular protein trafic | 5 |
| Endoplasmic reticulum | 5 |
| GTP binding | 5 |
| Cell cycle control | 5 |
| G-protein coupled receptor protein signaling pathway | 4 |
| Golgi apparatus | 4 |
| Small molecule transport | 4 |
| Chaperone | 4 |
| Exocytosis | 3 |
| Mitochondrion | 3 |
| GTPase | 3 |
| Structural protein | 3 |
| Soluble fraction | 3 |
| Synaptic transmission | 3 |
| Cell cycle regulator | 3 |
Of the clones for which we had size information (36 PvuII restricted ones) and that matched Genbank sequences (23 of the 36), the songbird clones were on average ~1.25 Kb longer than their largest non-RIKEN Genbank database homologs; only two songbird clones were smaller. This demonstrates that as with the RIKEN mouse clones (Sugahara et al. 2001), these songbird clones are much more full-length than usual. This method for isolating non-redundant clones is essential to be able to quickly move onto generating non-redundant cDNA microarrays.
One disadvantage of microarrays, however, is that because signal detection is low, they often require considerable amounts of tissue from which to make hybridization probes (Bowtell 1999). Songbird brains are relatively small (about the same size as mice) and the vocal nuclei even smaller; thus, it is necessary to improve detection. To attempt to do so, we generated songbird cDNA microarrays with double stranded cDNAs and single stranded antisense cRNAs from a test set of genes, 22 songbird glutamate receptors and activity dependent genes. The cloning of these zebra finch cDNAs will be reported separately (K. Wada et al., unpublished observations). The double-stranded cDNAs and single-stranded cRNAs were then printed at high density on glass slides with a GeneMachine’s microarrayer at the Duke Center for Genome Technology. We then dissected pallium (cortical-claustrum mammalian homolog) from subpallium (basal ganglia homolog; above and below lmd shown in Fig. 2) of a single female zebra finch brain hemisphere. RNA was isolated and sense strand cDNA probes were labeled with Cy3 (pallium-red) and Cy5 (subpallium-green), and hybridized to the cDNA microarrays at different temperature stringencies. At a standard stringency for microarrays (55°C), both the double-stranded cDNA and single-stranded cRNA hybridized (Fig. 5A). At high stringency (65°C), only the cRNA spots hybridized and revealed better contrast in known differences between pallial and subpallial gene expression (Fig. 5B; exclusive BDNF mRNA expression in the pallium, for example). The reason for the increased signal detection is that when using double stranded cDNA, the complementary strand competes for hybridization to the probe. When using single stranded cRNA, this does not occur. In addition, DNA:RNA hybrids are also stronger than DNA:DNA hybrids. Our improvement demonstrates that use of single strand cRNAs on the microarrays slides will benefit detection of gene expression from small amounts of tissue. The full report of our libraries and improvements is currently being prepared (K. Wada et al.).
Fig. 5.
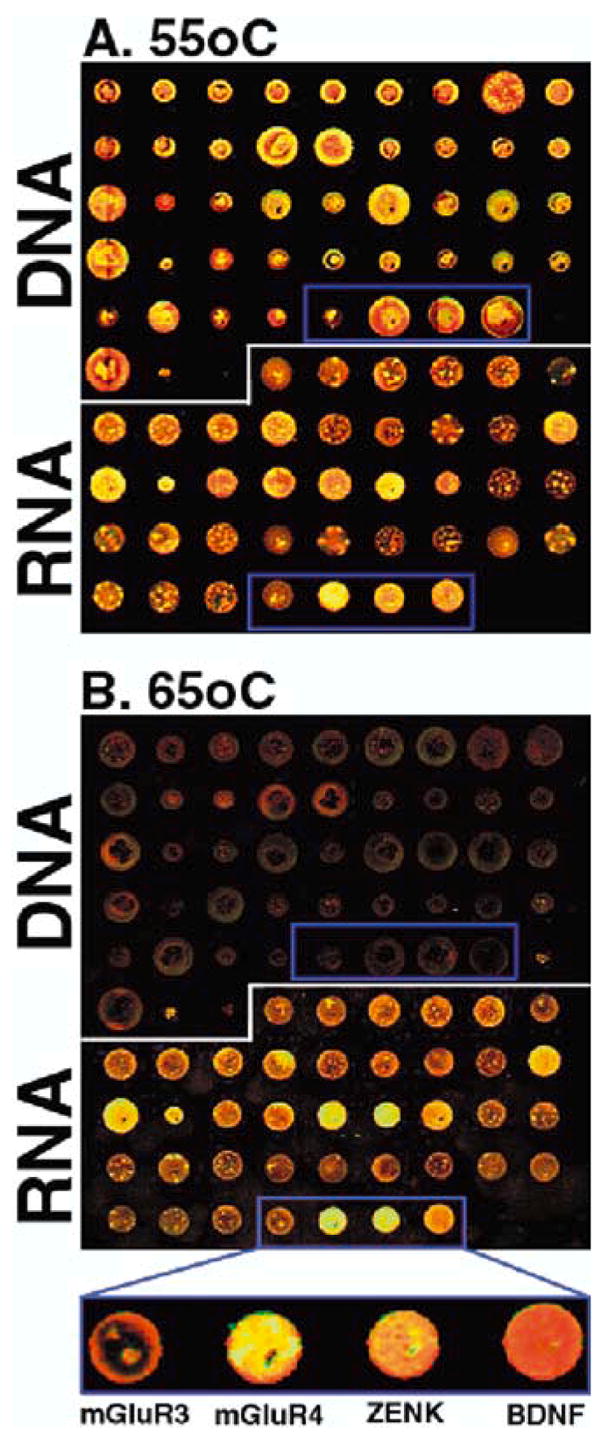
A,B Microarrays of double-stranded and single-stranded targets on glass slides. Small test arrays were created with double-stranded cDNA and single-stranded antisense cRNA of zebra finch genes representing individual glutamate receptor subunits (Wada et al. 2001) and two immediate early genes (ZENK and BDNF). The gene fragments (0.5–2 Kb) were cloned by using degenerate PCR primers and a PCR vector that contains SP6 and T3 RNA polymerase sites used to synthesize the antisense cRNAs. The cDNA targets were made by standard PCR reactions using SP6 and T7 primers complementary to vector sequences that flank the cloned inserts. The cRNAs antisense targets were made using either SP6 and T7 RNA polymerase, depending on clone orientation, following a described procedure (Mello et al. 1997). All proteins in the reactions were degraded with 1 μl of proteinase K (Qiagen, 20 mg ml−1 stock) for 10 min at 37°C, and the samples heated to 65°C to inactivate the proteinase. The targets were electrophoresed on agarose gels to check for their presence and concentration and adjusted to ~500 ng μl−1. The targets were then spotted onto polysine coated slides (slide made by Dr. DeRisy protocol, www.microarrays.org), using a GeneMachine’s Microarrayer, and the slide air dried. To generate hybridization probes, a female zebra finch brain was dissected and the subpallium separated from the pallium near the lmd border (Fig. 2; thick gray line). mRNA was extracted, converted to single strand sense cDNA and then labeled with fluorescent Cy dyes: Cy3 (green) for the subpallium and Cy5 (red) for the pallium using the Clontech labeling kit. The labeled cDNAs were then hybridized to the microarrays using the Clontech microarray hybridization kit, cover slipped in individual hybridization chambers, and incubated overnight (12–16 h), under two different conditions: A at 55°C and B at 65°C. The slides were then rinsed briefly in water, air blown dry, and scanned into an Axon’s Instrument scanner within 10 min of drying. Blue boxed areas: same target genes under different conditions. Similar to in-situ hybridizations at 65°C, BDNF was exclusively expressed in the pallium (all red; Li and Jarvis 2001), ZENK was expressed in both pallial and subpallial regions, but higher in the pallium (red-yellow; Mello and Clayton 1994), mGluR4 was expressed higher in the subpallium (green – yellow; Wada et al. 2001), mGluR3 was low in both (Wada et al. 2001)
Other means of detecting mRNA expression will also be used in our integrative project. This includes in situ hybridizations, which allow mRNA detection in a more anatomically defined manner (Fig. 3) and in single cells. However, it is not yet possible to perform and analyze complex in-situ anatomical expression patterns of thousands of genes in the songbird or many other brains by high-throughput methods. Instead, we use in-situ hybridizations as a means of verifying differential regulation of a subset of genes assayed in the cDNA microarrays, and for further definition of their anatomical expression.
Electrophysiological
To integrate electrophysiology with gene expression, anatomy, and behavior, it is important to record electrophysiological activity in awake birds that are behaving: under the same conditions in which behaviorally driven gene regulation has been best characterized (Mello et al. 1992; Jarvis and Nottebohm 1997; Jarvis et al. 1998). Multi-unit, and to a lesser degree single-unit, recordings have been accomplished in the auditory and vocal pathways of awake songbirds since the 1980s (McCasland and Konishi 1981; McCasland 1987; Chew et al. 1995; Yu and Margoliash 1996; Fee and Leonardo 2001). However, to integrate a brain system, it is best to study the features of different levels of analysis, including electrophysiology, within the same animal, during and after it has performed its natural behaviors. This has not yet been done. In addition, to integrate gene expression and anatomy with electrophysiology, it would be necessary to record from multiple regions within the vocal communication system of the same animal.
Towards this aim, Dr. Smulders of our group designed and built a multi-electrode array recording set up for awake behaving songbirds, following prototypes used by Dr. Miguel Nicolelis at Duke (Nicolelis et al. 1999) and Robert Hampson at Wake Forest (Hampson et al. 2001) on rats and primates. The set up consists of 16 electrodes, giving us the ability to record in 16 different brain sites. As there are 7 known cerebral vocal nuclei and a comparable number of cerebral auditory regions (Jarvis et al. 2000), 16 electrodes is sufficient to record from multiple vocal and/or auditory nuclei at the same time, or multiple sites within one structure.
Before surgery, the electrodes are attached to a lightweight surface mount nano-connector (Omnetics, Minneapolis, Minn., USA) in the appropriate configuration for the brain areas to be recorded. The tips of the electrodes are then stained with fluorescent dyes (diI and diO) to identify electrode location after the birds are killed. The dyes did not interfere with electrophysiological recordings when compared to non-dyed electrode tips. During surgery, the electrodes with the connector are lowered into the brain, and permanently fixed with dental cement to the bird’s head. Before an experiment, the surface mount nano-connector is connected to a light head stage (Plexon, Dallas, Tex., USA) containing miniature op amps for amplifying the electrophysiological activity. The op amps are connected by light, thin wires to a motorized 36-channel commutator (Dragonfly, Ridgeley, W.Va., USA). The motorization senses the bird’s movements and moves the commutator accordingly, thus allowing the bird to move freely in its 17″×24″ cage, the largest used for songbirds in an awake set up. Further amplification and primary filtering is obtained with a 16-channel amplifying board (Plexon) from which signals are fed into an A-D converter board (National Instruments, Austin, Tex., USA), together with signals from a microphone recording the bird’s vocalizations or sound playbacks. A digital video camera is also linked with the set up to record behavior. The acquisition, monitoring, regulating, and analysis software were all custom written in LabView (National Instruments) starting from templates designed in Dr. Mooney’s laboratory at Duke (Mooney 2000).
Using eight electrodes, we have performed experiments with a male bird implanted in multiple sites within one vocal structure, HVC, and in female birds within different telencephalic auditory structures. After several days with the nano-connector, without attachment to the commutator, the male bird began to sing. After attachment to the commutator for several hours the bird would sing directed song to females. After 24 h, he also began to sing undirected song. Robust premotor vocal activity was found on 5 (1, 2, 3, 5, 6) of the 8 channels and weak activity on two others (7, 8; Fig. 6A); activity was similar for directed and undirected singing (not shown), consistent with ZENK gene expression in HVC (Jarvis et al. 1998). Activity in the two weak channels, appeared to peak after the onset of song, and these electrodes were located at the boundary of HVC-HVC shelf. It appears that these could be auditory responses coming from the HVC shelf. The premotor multiunit activity in HVC is thought to mainly reflect interneuron activity (Fee and Leonardo 2001).
Fig. 6.
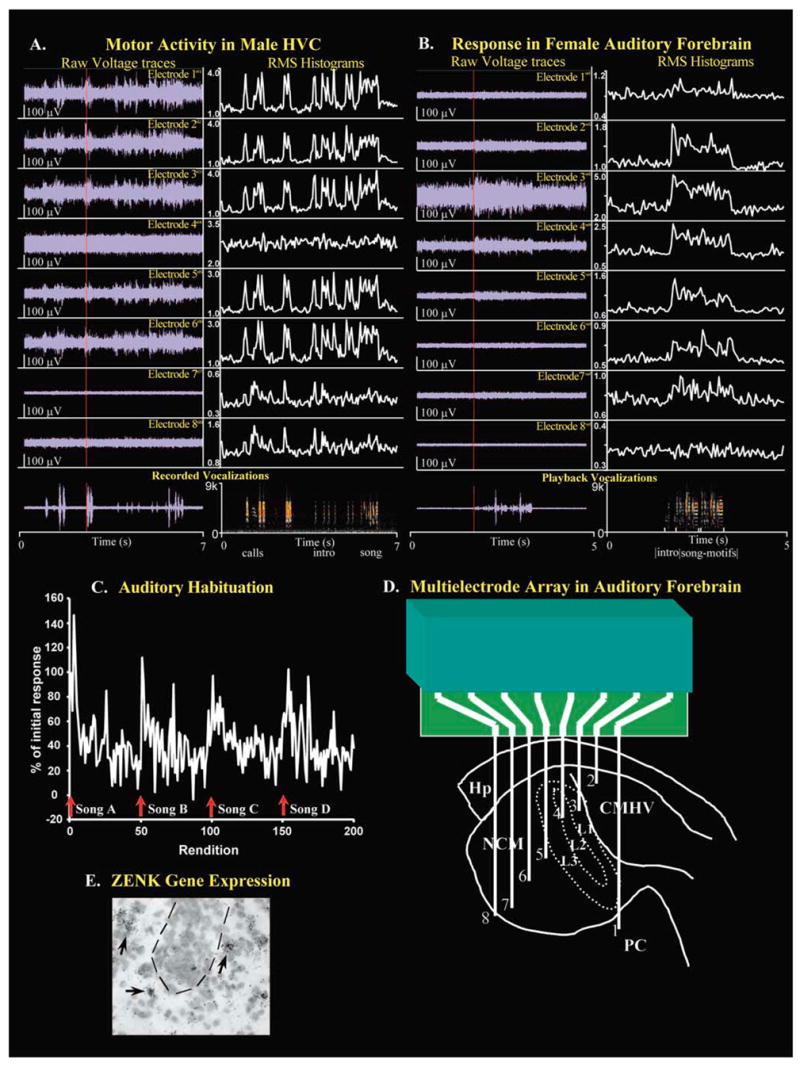
A–E Electrophysiological recordings at multiple synaptically connected sites within the songbird vocal communication system. A Eight electrodes organized in an evenly spaced square array bundle (200 μm inter-electrode distances) implanted within the vocal nucleus HVC of a male zebra finch. Left panel: raw voltage traces of multi-unit activity. Right panel: root mean square (RMS) traces for the different electrodes, shown in various scales to accommodate visualization of the different magnitude responses. Vocalizations are shown at the bottom left as a power spectrum and bottom right as a sonogram (generated with Sound Analysis). In the sonogram, red indicates the sound frequencies with highest volumes. There was pre-motor multi-unit activity (before the red line) at all electrodes except 4, 7 and 8, and for all vocalizations produced (calls, introductory notes and song). The activity at 7 and 8 were best revealed by RMS histograms (50 ms bin size; right panel), and appeared to be post singing, i.e., auditory, and these were located in the HVC shelf. The multi-unit pattern of activity at multiple sites in HVC (1 2, 3, 5, and 6) were very similar, consistent with independent findings from pairs of electrodes in HVC (M.F. Schmidt, personal communication). B Eight electrodes implanted within the auditory forebrain of a female zebra finch that spanned a rostrocaudal plane from PC, CMHV, L1, L2, L3 to NCM at sites medial to the level shown in D. A playback of conspecific male song consisting of introductory notes and two repeated song motifs was presented (power spectrum and sonogram shown at the bottom). Increased robust activity was seen at electrodes 2–5 (CMHV to rostral NCM). RMS histograms of the same playback session show that these and all other electrode sites (except 8, which was located at the ventricle surface) had increased activity as a result of hearing the song. In all cases, the increased activity occurred after onset of the playback (after the red line). C Auditory evoked activity (RMS of voltages during song playback) at electrode 6 (caudal NCM), in response to multiple-consecutive playbacks of the same songs (50 playbacks each with a 10-s inter-stimulus interval). As shown previously in restrained animals (Chew et al. 1995; Stripling et al. 1997), in this freely moving animal, repeated presentation of novel songs led to habituation of the multiunit responses. All activity is normalized against the first response to song A (set at 100%). Arrows show start of each novel song playback session. D Camera lucida drawing showing electrode locations of the bird in B, determined after the bird was killed, by presence of fluorescent dye label in the brain left from stained electrode tips. E ZENK gene expression (black silver grains pointed to by arrows) in cells (Nissl stain) at and around the tip of an electrode. In some birds, electrode tracks with glial cells were present (dashed lined region) allowing further identification of electrode site
In the females, auditory responses often occurred on eight of eight channels, located in different parts of the auditory pathway, in response to hearing playbacks of species-specific songs (Fig. 6B). Many of these responses habituated with familiarity to the song (Fig. 6C), showing that habituation can also occur when the bird is not restrained (Chew et al. 1995; Stripling et al. 1997). No habituation was found in L2 as previously found in restrained birds (Chew et al. 1995). In addition, we found that certain areas not previously recorded from also have auditory electrophysiological responses and habituation, in PC for example (Fig. 6D).
After singing or playing song for a 30-min session, the birds were killed, their brains sectioned and location of electrode sites confirmed and determined by examining dye tracer and electrode tracks. The brains were also processed for in-situ hybridization of ZENK gene expression. The dyes and long-term presence of electrodes did not interfere with ZENK mRNA expression when compared with the unimplanted side of the brain. As shown in Fig. 6E, it was possible to measure ZENK expression directly in cells from serially processed sections at the electrode tips. Because multi-unit recordings sum activity from ~70 μm around the electrode tips, it is not possible to determine which cells were recorded.
This represents the first set up that will allow us to integrate electrophysiological activity, behavior, and gene regulation within the same animal. One limitation is that our recordings are multi-unit. Single-units often reveal specific information not seen at the population level. Moreover, behaviorally regulated gene regulation can be studied at the single cell level (Jarvis et al. 1998). Future work will focus on developing the technology to record from single units at multiple locations in songbirds as has been accomplished with microdrivable electrodes in three sites within RA of the same bird (Fee and Leonardo 2001), in conjunction with assaying gene regulation. However, multi-unit activity in freely moving songbirds has been useful for generating significant insight into how the songbird vocal communication system works (Dave et al. 1998; Hessler and Doupe 1999b). A full report of our combined electrode array and gene expression approach, and the biological findings will be published by T.V. Smulders.
Behavioral
Vocal communication behavior, hearing and vocalizing can be measured graphically, called sonographs, a measurement of frequency (vertical, y-axis) against time (horizontal, x-axis) with darkness or coloration of the images representing amplitude (loudness) in a third dimension (Fig. 6A, B). Other measurements have also been invented and most recently made accessible to the songbird community through a program called Sound Analysis by Tchernichovski and Mitra (http://www.talkbank.org/animal/sa.html).
For this integrative project, we will use Sound Analysis, and in particular, five behavioral features that have proven useful for measuring zebra finch vocal behavior (Tchernichovski et al. 2000). These are: (1) duration, the time it takes to produce a particular vocalization; (2) pitch, the measure of the fundamental frequency or the lowest frequency that has the most energy in a sound; (3) entropy, a measure of the amount of order in a sound; a pure tone has high order and thus low entropy; noise with many frequencies has low order and thus high entropy; (4) frequency modulation, the amount that a sound’s frequency changes in time (up sweeps, down sweeps, u-shapes, etc.); and (5) continuity, the measure of how linearly connected frequencies in a sound occur with each other in time; abrupt transitions in a sound’s frequencies are less continuous than gradual transitions. These behavioral features are described in more detail by Tchernichovski and Mitra (2002). We add a sixth feature, the bird’s body movements performed during vocalizing and listening, that will be recorded by digital video. Such movements include beak wipes, side-to-side hopping, and feather fluffing. Some of these movements, called a dance when produced during singing, have been shown to be learned along with song imitation (Williams 2001). As this technology has been well developed, we add no additional features here.
Bringing levels together: inference bioinformatics
The most challenging aspect of our project is bringing together these different levels of analysis particularly when the amount of data obtained even at one level can be overwhelming. High-throughput molecular biology has led to the field of molecular bioinformatics. When applied to analyzing microarray gene expression profiles, most investigators have concentrated on clustering methods to draw out groups of genes which are co-regulated, or which define certain biological or disease states. These methods, however, are limited in their ability to draw out new knowledge about genes, such as causal interactions and to handle interactions between levels of analysis.
When statisticians and computer scientists became aware of the large amount of data obtained from gene microarrays, they realized the potential power of common inference algorithms, used in other fields such as engineering, for statistically predicting causal molecular pathways from this correlational data. The experimental data is not functional, but the statistically predicted networks are. Some inference algorithms can also handle multiple scales and units, i.e., data from multiple levels of analysis. When developed and applied to such biological data, we name this approach here as inference bioinformatics.
Four general types of inference algorithms have been applied to gene expression microarray or similar type of data: linear (D’haeseleer et al. 1999), non-linear (Weaver et al. 1999), target regulator pair (Arkin et al. 1997), Boolean (Liang et al. 1998; Akutsu et al. 2000), and Bayesian (Friedman et al. 2000; Hartemink et al. 2001; Yoo et al. 2002). The improbability that genes and other biological processes are all linear makes those algorithms subject to error, and this has been a criticism. Nonlinear algorithms are more realistic. A target-regulator pair algorithm has been successful in reconstructing many interactions in the glycolysis pathway from time series concentration measurement of metabolic reactions (Arkin et al. 1997). However, this method is constrained to interactions that involve one or two other elements, making it difficult to elucidate relationships that are more complex, such as one gene regulated by five others. Boolean networks assume that a gene is either on or off, and the entire network transitions between these states. Because gene expression and other features have continuous values and are not simply a 1,0 type, this has been a criticism of Boolean algorithms. Bayesian algorithms generate graphical networks of probability connections, and have been applied to gene expression (Friedman et al. 2000; Yoo et al. 2002), and gene expression combined with genomic data (Hartemink et al. 2002).
The major limitation that all inference bioinformatic algorithm approaches have is that, except in yeast (Giaever et al. 2002), there are no high-throughput intervention methods (such as gene blocking) for complex organisms to test accuracy of the generated networks. The networks often predict hundreds if not thousands of gene interactions; these can take several lifetimes to verify. Moreover, even with potential future high-throughput intervention methods, the predicted networks serve as a useful guide for intervention experiments. To circumvent this limitation, Dr. V.A. Smith of our group developed a novel approach where instead of using a real system at first, we created an artificial brain simulation on a computer where we make and know all the rules. We then sample data from this simulated system as one would sample data from a real biological system, plug the sampled data into inference bioinformatic algorithms and test their ability to recover our simulated system (Table 2). This approach has reciprocal insight on how to design inference bioinformatic algorithms and biological experiments for them.
Table 2.
Explanation of approach used to test accuracy of inference algorithm. Number 4 is the same in both the Real World and in BrainSim. However, number 5 allows us to develop useful inference bioinformatic algorithms at a much faster rate with BrainSim than with the Real World
| Real World | BrainSim |
|---|---|
|
|
Generation of simulated artificial systems
We created a simulation based upon known features of the songbird brain, that we called BrainSim. We attempted to keep the simulation relatively simple, as we first wanted to test whether an inference bioinformatic algorithm can find pre-specified simple simulated relationships. We simulated two behaviors that can be arbitrary but for the sake of clarity we call behavior 1 (singing) and behavior 0 (silence). Electrophysiological activity was simulated in rates of multi-unit action potentials from 0 to 400 Hz, which is within the observed range in songbirds (Chew et al. 1995; Hessler and Doupe 1999b; and this study). For anatomy, five brain regions were included named 1–5, which is within the range of the number of vocal nuclei present in the songbird brain (Fig. 2). In four of the five brain regions, hereafter called regulated brain regions, activity was correlated with behavior with either behavior 1 or 0 for high activity (300–400 Hz) and vice versa for low activity (0–100 Hz). Activity in the fifth region was chosen randomly. Gene mRNA expression levels were simulated as values of 0– 50, which is within the range of fold changes seen for expression per cell (Jarvis and Nottebohm 1997). Included were 100 genes, named 1–100; gene names were arbitrary, as our first simulation does not take into account gene function. Two (1 and 4) of the 100 genes were specified to be dependent upon activity and 8 others (2, 3 and 5–10) were specified to be dependent upon these two and/or each other (Fig. 7); both activating and suppressing interactions were included. Expression levels of the remaining 90 genes were chosen randomly.
Fig. 7.

Simulation framework of BrainSim graphically shown. A bird generates behavior (left). It does so from the concurrent activity of four (1–4) of five brain regions (middle). The fifth brain region has activity, but its activity is not linked to behavior. Activity in all five regions concurrently initiates a similar genetic regulatory pathway in each region with positive (+) and negative (−) interactions for 10 genes (right). Genes 11 to 100 are not regulated by activity or other simulated genes. Behavior is modeled to occur immediately after activity, whereas gene synthesis is modeled to occur on the order of minutes
We wrote BrainSim in C++ using the development environment CodeWarrior Pro 3 (code available upon request). The program generates a series of discrete time points that are modeled to be 1 min apart. Initial values for all features are seeded. Behavior begins with 0 (silence); activity in regulated regions begins as either high (random number between 300 and 400 Hz) or low (0–100 Hz) to correlate with behavior 0; activity in unregulated regions begins as a random value between 0 and 400 Hz; expression of regulated genes begins with prior randomly assigned values between 40 and 50 (for down-regulated genes) or 0–10 (for up-regulated genes); expression of all other genes begins with randomly assigned values between 0 and 50. BrainSim reads these beginning gene expression levels from a Microsoft Excel file, generated by Excel’s RAND function; for this report, we have not changed these seeded values from run to run.
BrainSim then generates its own values at all subsequent time steps, with the rule that these values are dependent on their previous value and any regulatory influence. At these subsequent time steps, behavior was dependent upon activity in regulated brain regions. Activity was chosen to be a random value within the high or low range for a pre-specified number of time steps, until switching to the other range to change behavior. Activity in the unregulated region was equal to its previous value plus or minus a random change. Expression levels of the 10 regulated genes were adjusted according to their regulator’s value in the previous time step (activity for genes 1 and 4, and other genes for genes 2–3 and 5–10; Fig. 7). For up-regulation (+), the more a regulator increased, the more its target increased; for down-regulation (−), the opposite relationship occurred. This was achieved by adding (for up-regulation) or subtracting (for down-regulation) a proportion (chosen to be 0.2) of the regulator’s level to that of the target. Those genes regulated by activity were multiplied by firing frequency so that 400 Hz, the maximum activity, was equivalent to 50, the maximum expression level. A returning function was placed on each gene such that once a regulator’s presence was gone, the expression values would return over time to their stable pre-regulated levels. Finally, at each time point, BrainSim added or subtracted a random amount to the expression of all genes to simulate stochasticity in gene expression and measurement error.
To test BrainSim, we ran it for 320 time points, six times to simulate n=6 animals, and switched behaviors every 80 time points. We then averaged and graphed the output of the six runs for behavior, activity, the 10 regulated genes, and 2 non-regulated genes (Fig. 8). The output shows that the values change consistent with the structure of the simulation (Fig. 7). After the first change in activity and behavior to 1 (singing at time point 80), there was a slow rise in expression of gene 1 and a decrease in gene 4 (first vertical line in Fig. 8), followed by increases and decreases of the other regulated genes (highlighted by next four vertical lines in Fig. 8). It takes approximately 5 min (five time points) before an effect of gene regulation can be seen as a result of activity (Fig. 8). After behavior 1 stops (time point 160), the genes return back to their original levels, but with a longer time-lag. The two non-regulated gene examples (62 and 84) show stochasticity but do not correlate with changes in the other features.
Fig. 8.
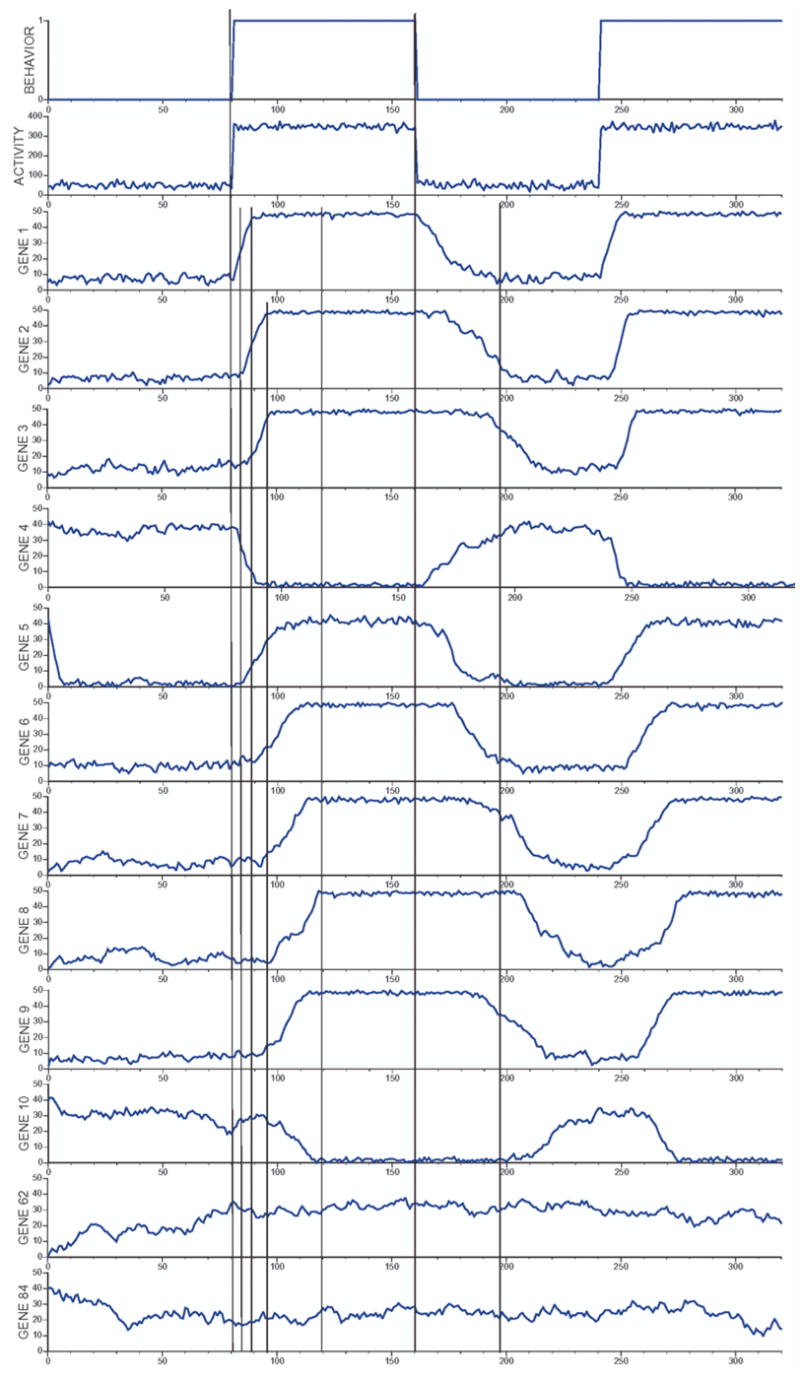
BrainSim output. The average values for n=6 runs of BrainSim are shown for behavior, electrophysiological activity, and expression levels for the 10 regulated genes (1–10) and two example unregulated genes (62 and 84) across 320 time steps. Vertical lines reveal the time lags for response to regulation in the simulation. At the left-most line, behavior and activity change simultaneously, while there is no change yet in any of the genes. At the second line, genes 1 and 4 have begun to respond to the change in activity, but there is yet no change in any of the genes further downstream. The next two lines highlight the responses of the remaining genes. The last two vertical lines indicate the offset of the behavior and the corresponding lag for genes to return to their unregulated levels. This output of the simulation is consistent with its causal design (Figure 7). This output is not considered data, but rather continuous changing elements of the system. The samples taken at certain time ponts, are considered data
We also created another simulator, called GeneSimulator that models current knowledge of genetic pathways only. The details of this simulator will be reportedly separately (J. Yu et al., unpublished observations), but the use of its data is included here.
Recovery of simulated systems
We decided to test Bayesian network (BN) inference algorithms for their ability to recover the underlying structures of BrainSim and generated from GeneSimulator using sampled data from each. We chose BN, because, compared to the other algorithms (D’haeseleer et al. 1999; Weaver et al. 1999), BN can model non-linear combinatorial relationships, robustly handle noisy data sets, and handle stochastic processes as is known for gene expression (McAdams and Arkin 1997; D’haeseleer et al. 1999). However, BN cannot handle networks with cyclic structures, such as regulatory feedback loops, and time series data. Dynamic Bayesian networks (DBN) can handle cyclic structures and time. DBN are also capable of coping with hidden variables that are not observed in the data, such as protein levels or protein interactions that affect the measured gene expression, or genes not present on a microarray chip.
BN or DBN cannot handle continuous data computationally. That is, the calculations can take forever to complete, a problem in computer technology called nonpolynomial-complete (NP-complete). As such, before passing the data to the BN or DBN algorithms, it needs to be discretized, divided into bins, which dramatically decreases computational time. BN and DBN programs are also iterative and thus can be run indefinitely and stopped at any time; the longer the run, the more accurate the network generated. A threshold is found empirically, where longer running does not reveal significant changes in the network. The data can be run through the software multiple times to generate multiple networks, and the most common connections and features used to find the most plausible network.
To have a BN algorithm that can handle our sampled time series data, Dr. A.J. Hartemink of our group de- veloped a DBN inference algorithm we called NetworkInference (Smith et al. 2002). NetworkInference differs from the traditional BN by disallowing links between elements (i.e., genes, activity, etc.) backwards in time, from t+1 to t.
In order to model a biological situation, where time series data would be collected at intervals of ~10 min across behavioral transitions, we ran BrainSim for 200 time steps, sampled data from each of the five brain regions, as one would in a real biological experiment, at 21 time steps (0–20) spanning a full period of silence to singing to silence. Information loss occurs when sampling from a system. From the 21 sampled time points, we discretized the data into 4 bins (for example, gene expression levels between 0–25 were converted to 1, from 26–50 to 2, from 51–75 to 3, and from 76–100 to 4,). This results in more information loss.
First, we ran the sampled data through a traditional BN algorithm called B-Course (Bayesian-Course), available on the web at http://b-course.cs.helsinki../, and run by the Complex Systems Computation Group, Department of Computer Science, University of Helsinki. Here, unless pre-specified by the user, B-Course automatically discretizes the data to two categories. We then re-graphed the BN networks generated onto our BrainSim diagrams (Fig. 9). For biological standards, B-Course performed remarkably well, recovering the regulated underlying elements activity and genes of BrainSim. However, as expected B-course did not find the causal links between the elements. It also found many incorrect links and some incorrect genes. We tested descretizing the data into different category amounts before passing it through B-Course, and found that a 4-category discretization yielded significant improvement of B-Course’s ability to recover more accurate structure (Fig. 9). This time, it was also able to recover behavior with brain regions, but only if behavior and activity data were ran separately.
Fig. 9.
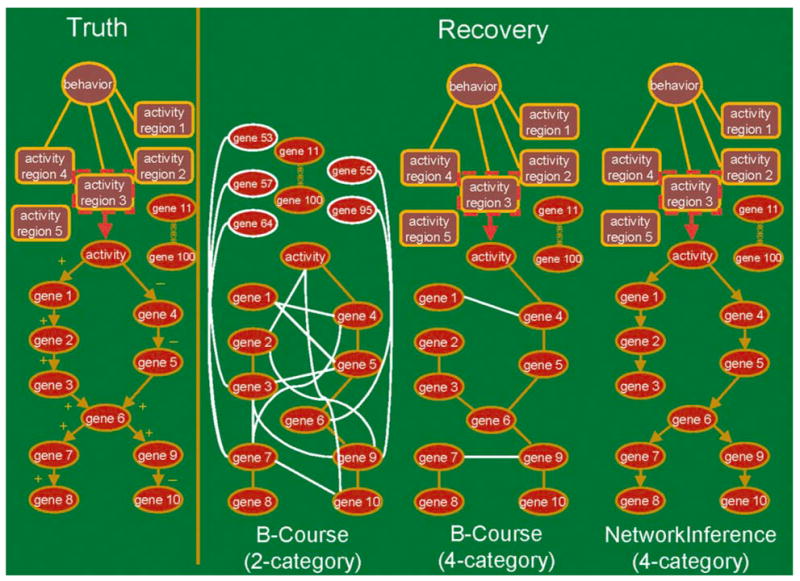
Ability of Bayesian networks to recover BrainSim underlying structure. The known truth as we designed the simulation is shown to the right. Bayesian recovered networks from sampled and discretized data mapped onto the graphical diagram of the known truth are shown to the left. These networks were from 2- and 4- category discretized data using B-Course and 4-category discretized data using NetworkInference. White lines and white ovals designate incorrect links (also called edges) and elements (also called nodes), respectively. Lines with arrows indicate causality. “+” up-regulation; “−” down-regulation
When we passed the 4-category discretized sampled data through NetworkInference, we were able to recover behavior and nearly the entire simulation (Fig. 9). For the recovery to work, we also had to pass the data through the algorithm in two stages, first with activity and gene expression data from the five brain regions (time series data, which is handled as a DBN), and second with activity in five regions and behavior (treated as an instant in time on the time scale used in the simulation, which is handled as a BN), and then bringing the two generated networks together at activity. All causal links were correctly identified, and none of the 90 unregulated genes were included in the network. The only missing causal link was between gene 3 and gene 6. Gene 6 is the only element of our network where there are multiple causal regulators (also called multiple parents) converging to one, genes 3 and 5 to 6 (Fig. 9).
Using GeneSimulator we found that multiple parents of a node can only be found with a DBN when the amount of data sampled is very high, greater than 5,000 data points total from a simulated genetic pathway (J. Yu et al., unpublished observations). This is biologically unreasonable. Even with BrainSim, sampling from five brain regions at 21 time points, 650 total, may be beyond biological experimentation in some laboratories. With GeneSimulator, we attempted to determine the limit of sampling for accurate recovery. Simulating a 12-gene network out of 20 genes (Fig. 10A) and sampling data from it similar to microarray sampling, we found that at 25–50 sampled time points run through a DBN algorithm we programmed and called RegulationRecover yielded a mess (Fig. 10B). However, when we linearly interpolated data between time points (add unmeasured data based upon the measured data), we found that the DBN algorithm was able to recover much of the genes and their interactions in the simulated genetic network (Fig. 10C). Multiple parents were still not recovered.
Fig. 10.

A–F Testing of RegulationRecover DBN algorithm on a simulated genetic pathway generated by GeneSimulator. A The known truth of a genetic system generated from GeneSimulator. The system shown contains 20 genes of which 12 are in a regulated genetic pathway. B A recovered network from RegulationRecover using 50 data points (sampled time points), one animal each data point, sampled at an interval of every 5 time points. C. The network recovered after interpolating data. This was done by interpolating 5 data points between each two sampled time points. For the interpolation to be more meaningful, it was done on a sampling of interval size of 20 to allow for values between intervals to be interpolated. D Same as C, except links with influence scores of 0 were removed. E Same as C, except 25 data points were used. F Same as E, except links with influence scores of 0 were removed. Arrowheads indicate up-regulation and flatheads indicate down-regulation. Shown are the average recovered results from 10 datasets each. Black dashed line: only found once in 10 recovery results; black solid line: found more than once but less than 5 times in 10 recovery results; red solid line: found more than or equal to 5 times in 10 recovery results. Numbers beside lines – occurrence (left of slash) and average influence score (right of slash); these numbers only appear beside the lines found in more than one recovered search
In the DBN algorithm RegulationRecover we developed to recover genetic networks we added a new feature, an influence score that determines from the sampled data whether an interaction is excitatory (up-regulation, +), inhibitory (down-regulation, −), or can not be determined (0), and the magnitude of the interaction (scaled between −1 and 1). The influence score calculation is also based upon correlations in the data. We found that the influence scores of RegulationRecover correctly predicted the sign of regulation (up or down) (Fig. 10C; numbers to the left of the slash next to the lines). In addition, many of the incorrect links generated with the biologically reasonable sampled data had influence scores of 0 and this can be used to select against them (Fig. 10C cf. D, and E cf. F).
In general, the DBN inference algorithms we developed can recover from biologically reasonable simulated data, interactions that involve cascades but not convergence, and interactions with feedback. The detailed report of the invention of this approach is presented in Smith et al. (2002), and the further characterizations and improvements using GeneSimulator and RegulationRecover will be by J. Yu et al. (unpublished observations) and BrainSim and NetworkInference is in Smith et al. (2003).
Limitations and future directions
The inability to find multiple parents, i.e., convergence, from biologically simulated data at the gene expression level of analysis is a limitation of this approach. Further development of existing mathematics, or invention of new mathematical tools may be needed. It is possible that other inference algorithms can recover these interactions and then combined with DBN, recover the entire network.
Another limitation is the simulation designs, as they are relatively simple compared to our current biological knowledge. We will continue to improve BrainSim and GeneSimulator, and use them to guide experimentation and analysis with real systems. After further determining which biologically reasonable sampling method has the best accuracy on the inference recovery, we will use that sampling method on real animals. We will also develop a more complex BrainSim version that incorporates anatomical connectivity, cellular localization, gene function, detailed behavior, and finer time scales to include differences between activity (milliseconds) and behavior with gene expression (minutes). By improving simulations and then using them to guide future biological data collection, we can ensure that the most pertinent biological data are gathered that allow predictions of causal links using inference bioinformatic algorithms.
Another limitation is biologically testing the accuracy of the networks generated. This will require use of gene blocking and other techniques. These are not in common use with songbirds. However, we do not view our approach as a substitute for intervention experiments, but as a guide for such experiments.
Conclusion
In this study, we attempted to unify disparate levels of brain research for one system, songbird vocal communication. The levels of analysis we included were anatomy, microarray and in-situ gene expression profiles, electrode array recordings, and behavior. We have begun to develop inference bioinformatics tools to unify levels computationally with simulations. Future progress will require testing with real data and further enhancement of technologies.
Acknowledgments
These experiments comply with the “Principles of animal care”, publication number No. 86-23, revised 1985, of the National Institutes of Health and with the current laws of the United States of America. This research was funded by the Whitehall Foundation, Klingenstein Foundation, Packard Foundation, and Duke Bioinformatic Grants to Dr. E.D. Jarvis, the Japan Scholarship Association Award to Dr. K. Wada, and the Research Grant for the RIKEN Genome Exploration Research Project from the Ministry of Education, Culture, Sports, Science and Technology of the Japanese Government to Dr. Y. Hayashizaki. We thank Toshiyuki Shiraki of RIKEN for assistance in library construction, Dr. Masatoshi Hagiwara for assistance to Dr. K. Wada, Dr. Holly Dressman of the Duke Center for Genome Technology (DCGT) for use of the microarray facility, Andria Allen of DCGT for assistance with DNA sequencing, Mark De-Long of DCGT for database assistance, the Richard Mooney and Miguel Nicolelis labs of the Department of Neurobiology at Duke and in particular Merri Rosen, Chris Sturdy, and Dana Cohen, of their labs for assistance in building the multi-electrode array set up for awake songbirds, Kimberly F. Johnson for assistance from the Duke Bioinformatics Shared Resource. Finally, we thank Dr. Richard Mooney and Dr. Steve Nowicki for brainstorming on the initial stages of this project.
Abbreviations
- area X
area X of the avian striatum
- Av
nucleus avalanche
- CMHV
caudal region of the hyperstriatum ventrale
- DLM
medial subdivision of the dorsal lateral nucleus of the anterior thalamus
- DM
dorsomedial subdivision of nucleus intercollicularis
- HVC
high vocal center
- lMAN
lateral subdivision of the magnocellular nucleus of the anterior neostriatum
- NCM
caudal medial neostratum
- Nif
nucleus interfacialis
- RA
robust nucleus of the archistriatum
- Uva
nucleus uvaeformis
(For a translation of thisold terminology into its current form, see http://jarvis.neuro.duke.edu/nomen/2002NomenclatureTable.html)
References
- Akutsu T, Miyano S, Kuhara S. Algorithms for identifying boolean networks and related biological networks based on matrix multiplication and fingerprint function. Proc Annu Int Conf Comp Mol Biol. 2000;4:8–14. doi: 10.1089/106652700750050817. [DOI] [PubMed] [Google Scholar]
- Altar CA, Cai N, Bliven T, Juhasz M, Conner JM, Acheson AL, Lindsay RM, Wiegand SJ. Anterograde transport of brain-derived neurotrophic factor and its role in the brain. Nature. 1997;389:856–860. doi: 10.1038/39885. [DOI] [PubMed] [Google Scholar]
- Anderson PW. A career in theoretical physics. World Scientific; Singapore: 1994. Theoretical paradigms for the sciences of complexity; pp. 584–593. [Google Scholar]
- Arkin A, Shen P, Ross J. A test case of correlation metric construction of a reaction pathway from measurements. Science. 1997;277:1275–1279. [Google Scholar]
- Ashburner M, Ball C, Blake J, Botstein D, Butler H, Cherry J, Davis A, Dolinski K, Dwight S, Eppig J, Harris M, Hill D, Issel-Tarver L, Kasarskis A, Lewis S, Matese J, Richardson J, Ringwald M, Rubin G, Sherlock G. Gene ontology: tool for the unification of biology. The Gene Ontology Consortium. Nat Genet. 2000;25:25–29. doi: 10.1038/75556. [DOI] [PMC free article] [PubMed] [Google Scholar]
- Bolhuis JJ, Zijlstra GGO, den Boer-Visser AM, Van der Zee EA. Localized neuronal activation in the zebra finch brain is related to the strength of song learning. Proc Natl Acad Sci USA. 2000;97:2282–2285. doi: 10.1073/pnas.030539097. [DOI] [PMC free article] [PubMed] [Google Scholar]
- Bonaldo MF, Lennon G, Soares MB. Normalization and subtraction: two approaches to facilitate gene discovery. Genome Res. 1996;6:791–806. doi: 10.1101/gr.6.9.791. [DOI] [PubMed] [Google Scholar]
- Bottjer SW, Johnson F. Circuits, hormones, and learning: vocal behavior in songbirds. J Neurobiol. 1997;33:602–618. doi: 10.1002/(sici)1097-4695(19971105)33:5<602::aid-neu8>3.0.co;2-8. [DOI] [PubMed] [Google Scholar]
- Bottjer SW, Miesner EA, Arnold AP. Forebrain lesions disrupt development but not maintenance of song in passerine birds. Science. 1984;224:901–903. doi: 10.1126/science.6719123. [DOI] [PubMed] [Google Scholar]
- Bowtell DD. Options available – from start to finish – for obtaining expression data by microarray. Nat Genet. 1999;21:25–32. doi: 10.1038/4455. [DOI] [PubMed] [Google Scholar]
- Brainard M, Doupe A. Interruption of a basal ganglia-forebrain circuit prevents plasticity of learned vocalizations. Nature. 2000;404:762–766. doi: 10.1038/35008083. [DOI] [PubMed] [Google Scholar]
- Brenowitz EA, Margoliash D, Nordeen KW. An introduction to birdsong and the avian song system. J Neurobiol. 1997;33:495–500. [PubMed] [Google Scholar]
- Brown PO, Botstein D. Exploring the new world of the genome with DNA microarrays. Nat Genet. 1999;21:33–37. doi: 10.1038/4462. [DOI] [PubMed] [Google Scholar]
- Carninci P, Hayashizaki Y. High-efficiency full-length cDNA cloning. Methods Enzymol. 1999;303:19–44. doi: 10.1016/s0076-6879(99)03004-9. [DOI] [PubMed] [Google Scholar]
- Carninci P, Kvam C, Kitamura A, Ohsumi T, Okazaki Y, Itoh M, Kamiya M, Shibata K, Sasaki N, Izawa M, Muramatsu M, Hayashizaki Y, Schneider C. High-efficiency full-length cDNA cloning by biotinylated CAP trapper. Genomics. 1996;37:327– 336. doi: 10.1006/geno.1996.0567. [DOI] [PubMed] [Google Scholar]
- Carninci P, Shibata Y, Hayatsu N, Itoh M, Shiraki T, Hirozane T, Watahiki A, Shibata K, Hideaki K, Muramatsu M, Hayashizaki Y. Balanced-size and long-size cloning of full-length, Cap-trapped cDNAs into vectors of the novel λ-FLC family allows enhanced gene discovery rate and functional analysis. Genomics. 2001;77:79–90. doi: 10.1006/geno.2001.6601. [DOI] [PubMed] [Google Scholar]
- Catchpole CK, Slater PJB. Bird song: biological themes and variations. Cambridge University Press; Cambridge, England: 1995. [Google Scholar]
- Chew SJ, Mello C, Nottebohm F, Jarvis E, Vicario DS. Decrements in auditory responses to a repeated conspecific song are long-lasting and require two periods of protein synthesis in the songbird forebrain. Proc Natl Acad Sci USA. 1995;92:3406–3410. doi: 10.1073/pnas.92.8.3406. [DOI] [PMC free article] [PubMed] [Google Scholar]
- Churchill G, Oliver B. Sex, flies and microarrays. Nat Genet. 2001;29:355–356. doi: 10.1038/ng1201-355. [DOI] [PubMed] [Google Scholar]
- Clark M, Hennig S, Herwig R, Clifton S, Marra M, Lehrach H, Johnson S, tW G, Group W-G. An oligonucleotide fingerprint normalized and expressed sequence tag characterized zebra fish cDNA library. Genome Res. 2001;11:1594–1602. doi: 10.1101/gr.186901. [DOI] [PMC free article] [PubMed] [Google Scholar]
- Cravchik A, Subramanian G, Broder S, Venter J. Sequence analysis of the human genome: implications for the understanding of nervous system function and disease. Arch Neurol. 2001;58:1772–1778. doi: 10.1001/archneur.58.11.1772. [DOI] [PubMed] [Google Scholar]
- Dave AS, Yu AC, Margoliash D. Behavioral state modulation of auditory activity in a vocal motor system. Science. 1998;282:2250–2254. doi: 10.1126/science.282.5397.2250. [DOI] [PubMed] [Google Scholar]
- D’haeseleer P, Wen X, Fuhrman S, Somogyi SR. Linear modeling of mRNA expression levels during CNS development and injury. Pacific Symp Biocomputing. 1999;4:41–52. doi: 10.1142/9789814447300_0005. [DOI] [PubMed] [Google Scholar]
- Doupe AJ, Kuhl PK. Birdsong and human speech: common themes and mechanisms. Annu Rev Neurosci. 1999;22:567–631. doi: 10.1146/annurev.neuro.22.1.567. [DOI] [PubMed] [Google Scholar]
- Durand SE, Heaton JT, Amateau SK, Brauth SE. Vocal control pathways through the anterior forebrain of a parrot (Melopsittacus undulatus) J Comp Neurol. 1997;377:179–206. doi: 10.1002/(sici)1096-9861(19970113)377:2<179::aid-cne3>3.0.co;2-0. [DOI] [PubMed] [Google Scholar]
- Ewing B, Green P. Base-calling of automated sequencer traces using phred. II. Error probabilities. Genome Res. 1998;8:186– 194. [PubMed] [Google Scholar]
- Ewing B, Hillier L, Wendl M, Green P. Base-calling of automated sequencer traces using phred. I. Accuracy assessment. Genome Res. 1998;8:175–185. doi: 10.1101/gr.8.3.175. [DOI] [PubMed] [Google Scholar]
- Fee M, Leonardo A. Miniature motorized microdrive and commutator system for chronic neural recording in small animals. J Neurosci Methods. 2001;15:83–94. doi: 10.1016/s0165-0270(01)00426-5. [DOI] [PubMed] [Google Scholar]
- Friedman N, Linial M, Nachman I, Pe D. Using Bayesian networks to analyze expression data. J Comput Biol. 2000;7:601–620. doi: 10.1089/106652700750050961. [DOI] [PubMed] [Google Scholar]
- Gahr M. Neural song control system of hummingbirds: comparison to swifts, vocal learning (songbirds) and nonlearning (suboscines) passerines, and vocal learning (budgerigars) and nonlearning (dove, owl, gull, quail, chicken) nonpasserines. J Comp Neurol. 2000;426:182–196. [PubMed] [Google Scholar]
- Giaever G, et al. Functional profiling of the Saccharomyces cerevisiae genome. Nature. 2002;418:387–391. doi: 10.1038/nature00935. [DOI] [PubMed] [Google Scholar]
- Hampson R, Simeral J, Deadwyler S. What ensemble recordings reveal about functional hippocampal cell encoding. Prog Brain Res. 2001;130:345–357. doi: 10.1016/s0079-6123(01)30023-7. [DOI] [PubMed] [Google Scholar]
- Hartemink AJ, Gifford DK, Jaakola TS, Young RA. Using graphical models and genomic expression data to statistically validate models of genetic regulatory networks. Pacific Symp Biocomputing. 2001;6:422–433. doi: 10.1142/9789814447362_0042. [DOI] [PubMed] [Google Scholar]
- Hartemink AJ, Gifford DK, Jaakkola TS, Young RA. Combining location and expression data for principled discovery of genetic regulatory network models. Pacific Symp Biocomputing. 2002;7:437–439. [PubMed] [Google Scholar]
- Herdegen T, Leah JD. Inducible and constitutive transcription factors in the mammalian nervous system: control of gene expression by Jun, Fos and Krox, and CREB/ATF proteins. Brain Res Brain Res Rev. 1998;28:370–490. doi: 10.1016/s0165-0173(98)00018-6. [DOI] [PubMed] [Google Scholar]
- Hessler NA, Doupe AJ. Singing-related neural activity in a dorsal forebrain-basal ganglia circuit of adult zebra finches. J Neurosci. 1999a;19:10461–10481. doi: 10.1523/JNEUROSCI.19-23-10461.1999. [DOI] [PMC free article] [PubMed] [Google Scholar]
- Hessler NA, Doupe AJ. Social context modulates singing-related neural activity in the songbird forebrain. Nat Neurosci. 1999b;2:209–211. doi: 10.1038/6306. [DOI] [PubMed] [Google Scholar]
- Hofmann M, Bleckmann H. Effects of temperature and calcium on transneuronal diffusion of DiI in fixed brain preparations. J Neurosci Methods. 1999;88:27–31. doi: 10.1016/s0165-0270(99)00007-2. [DOI] [PubMed] [Google Scholar]
- Jarvis ED. Insights from vocal learning birds into the neurobiology of human language (abstract) Soc Neurosci Meet. 2001;31:318.5. [Google Scholar]
- Jarvis ED, Mello CV. Molecular mapping of brain areas involved in parrot vocal communication. J Comp Neurol. 2000;419:1– 31. doi: 10.1002/(sici)1096-9861(20000327)419:1<1::aid-cne1>3.0.co;2-m. [DOI] [PMC free article] [PubMed] [Google Scholar]
- Jarvis ED, Nottebohm F. Motor-driven gene expression. Proc Natl Acad Sci USA. 1997;94:4097–4102. doi: 10.1073/pnas.94.8.4097. [DOI] [PMC free article] [PubMed] [Google Scholar]
- Jarvis ED, Schar C, Grossman MR, Ramos JA, Nottebohm F. For whom the bird sings: context-dependent gene expression. Neuron. 1998;21:775–788. doi: 10.1016/s0896-6273(00)80594-2. [DOI] [PubMed] [Google Scholar]
- Jarvis ED, Ribeiro S, Vielliard J, DaSilva ML, Ventura D, Mello CV. Behaviorally driven gene expression reveals song nuclei in hummingbird brain. Nature. 2000;406:628–632. doi: 10.1038/35020570. [DOI] [PMC free article] [PubMed] [Google Scholar]
- Jenkins L. Biolinguistics. Cambridge University Press; Cambridge, MA: 2000. [Google Scholar]
- Kaku M. Hyperspace: a scientific odyssey through parallel universes, time Warps, and the 10th dimension. Oxford University Press; Oxford: 1994. [Google Scholar]
- Kaku M, Thompson JT. Beyond Einstein: the cosmic quest for the theory of the universe. Anchor; Toronto: 1995. [Google Scholar]
- Kawai J, Shinagawa A, Shibata K, et al. Functional annotation of a full-length mouse cDNA collection. Nature. 2001;409:685– 690. doi: 10.1038/35055500. [DOI] [PubMed] [Google Scholar]
- Kimbo RR, Doupe AJ. FOS is induced by singing in distinct neuronal populations in a motor network. Neuron. 1997;18:315–325. doi: 10.1016/s0896-6273(00)80271-8. [DOI] [PubMed] [Google Scholar]
- Kobayashi K, Uno H, Okanoya K. Partial lesions in the anterior forebrain pathway affect song production in adult Bengalese finches. Neuroreport. 2001;12:353–358. doi: 10.1097/00001756-200102120-00034. [DOI] [PubMed] [Google Scholar]
- Li X-C, Jarvis ED. Sensory- and motor-driven BDNF expression in a vocal communication system (abstract) Soc Neurosci Meet. 2001;31:538.8. [Google Scholar]
- Li X, Jarvis ED, Alvarez-Borda B, Lim D, Nottebohm F. A relationship between behavior, neurotrophin expression, and new neuron survival. Proc Natl Acad Sci USA. 2000;97:8584–8589. doi: 10.1073/pnas.140222497. [DOI] [PMC free article] [PubMed] [Google Scholar]
- Liang S, Fuhrman S, Somogyi R. REVEAL, a general reverse engineering algorithm for inference of genetic network architectures. Pacific Symp Biocomputing. 1998;3:18–29. [PubMed] [Google Scholar]
- Luo M, Perkel DJ. A GABAergic, strongly inhibitory projection to a thalamic nucleus in the zebra finch song system. J Neurosci. 1999;19:6700–6711. doi: 10.1523/JNEUROSCI.19-15-06700.1999. [DOI] [PMC free article] [PubMed] [Google Scholar]
- Marler P. Characteristics of some animals calls. Nature. 1955;176:6–8. [Google Scholar]
- Marler P. Birdsong and speech development: could there be parallels? Am Sci. 1970;58:669–673. [PubMed] [Google Scholar]
- Marler P. Three models of song learning: evidence from behavior. J Neurobiol. 1997;33:501–516. [PubMed] [Google Scholar]
- McAdams HH, Arkin A. Stochastic mechanisms in gene expression. Proc Natl Acad Sci USA. 1997;94:814–819. doi: 10.1073/pnas.94.3.814. [DOI] [PMC free article] [PubMed] [Google Scholar]
- McCasland JS. Neuronal control of bird song production. J Neurosci. 1987;7:23–39. doi: 10.1523/JNEUROSCI.07-01-00023.1987. [DOI] [PMC free article] [PubMed] [Google Scholar]
- McCasland JS, Konishi M. Interaction between auditory and motor activities in an avian song control nucleus. Proc Natl Acad Sci USA. 1981;78:7815–7819. doi: 10.1073/pnas.78.12.7815. [DOI] [PMC free article] [PubMed] [Google Scholar]
- Mello CV, Clayton DF. Song-induced ZENK gene expression in auditory pathways of songbird brain and its relation to the song control system. J Neurosci. 1994;14:6652–6666. doi: 10.1523/JNEUROSCI.14-11-06652.1994. [DOI] [PMC free article] [PubMed] [Google Scholar]
- Mello CV, Ribeiro S. ZENK protein regulation by song in the brain of songbirds. J Comp Neurol. 1998;393:426–438. doi: 10.1002/(sici)1096-9861(19980420)393:4<426::aid-cne3>3.0.co;2-2. [DOI] [PubMed] [Google Scholar]
- Mello CV, Vicario DS, Clayton DF. Song presentation induces gene expression in the songbird forebrain. Proc Natl Acad Sci USA. 1992;89:6818–6822. doi: 10.1073/pnas.89.15.6818. [DOI] [PMC free article] [PubMed] [Google Scholar]
- Mello CV, Nottebohm F, Clayton D. Repeated exposure to one song leads to a rapid and persistent decline in an immediate early gene’s response to that song in zebra finch telencephalon. J Neurosci. 1995;15:6919–6925. doi: 10.1523/JNEUROSCI.15-10-06919.1995. [DOI] [PMC free article] [PubMed] [Google Scholar]
- Mello CV, Jarvis ED, Denisenko N, Rivas M. Isolation of song-regulated genes in the brain of songbirds. In: Liang P, Pardee AB, editors. Methods in molecular biology: differential display methods and protocols. Humana Press; Totowa: 1997. pp. 205–217. [DOI] [PubMed] [Google Scholar]
- Miki R, Kadota K, Bono H, Mizuno Y, Tomaru Y, Carninci P, Itoh M, Shibata K, Kawai J, Konno H, Watanabe S, Sato K, Tokusumi Y, Kikuchi N, Ishii Y, Hamaguchi Y, Nishizuka I, Goto H, Nitanda H, Satomi S, Yoshiki A, Kusakabe M, DeRisi J, Eisen M, Iyer V, Brown P, Muramatsu M, Shimada H, Okazaki Y, Hayashizaki Y. Delineating developmental and metabolic pathways in vivo by expression profiling using the RIKEN set of 18,816 full-length enriched mouse cDNA arrays. Proc Natl Acad Sci USA. 2001;98:2199–2204. doi: 10.1073/pnas.041605498. [DOI] [PMC free article] [PubMed] [Google Scholar]
- Minsky M. The society of mind. Simon and Schuster; New York: 1986. [Google Scholar]
- Mooney R. Different subthreshold mechanisms underlie song selectivity in identified HVC neurons of the zebra finch. J Neurosci. 2000;20:5420–5436. doi: 10.1523/JNEUROSCI.20-14-05420.2000. [DOI] [PMC free article] [PubMed] [Google Scholar]
- Nastiuk KL, Mello CV, George JM, Clayton DF. Immediate-early gene responses in the avian song control system: cloning and expression analysis of the canary c-jun cDNA. Mol Brain Res. 1994;27:299–309. doi: 10.1016/0169-328x(94)90013-2. [DOI] [PubMed] [Google Scholar]
- Nicolelis MAL, Stambaugh CR, Brisben A, Laubach M. Methods for simultaneous multisite neural ensemble recordings in behaving primates. In: Nicolelis MAL, editor. Methods for neural ensemble recordings. CRC Press; New York: 1999. pp. 121–156. [Google Scholar]
- Nottebohm F, Stokes TM, Leonard CM. Central control of song in the canary, Serinus canarius. J Comp Neurol. 1976;165:457– 486. doi: 10.1002/cne.901650405. [DOI] [PubMed] [Google Scholar]
- Perkel D, Farries M. Complementary ‘bottom-up’ and ‘top-down’ approaches to basal ganglia function. Curr Opion Neurobiol. 2000;10:725–731. doi: 10.1016/s0959-4388(00)00156-2. [DOI] [PubMed] [Google Scholar]
- Ribeiro S, Cecchi GA, Magnasco MO, Mello CV. Toward a song code: evidence for a syllabic representation in the canary brain. Neuron. 1998;21:359–371. doi: 10.1016/s0896-6273(00)80545-0. [DOI] [PubMed] [Google Scholar]
- Robertson HA. Immediate-early genes, neuronal plasticity, and memory. Biochem Cell Biol. 1992;70:729–737. doi: 10.1139/o92-112. [DOI] [PubMed] [Google Scholar]
- Scharff C, Nottebohm F. A comparative study of the behavioral deficits following lesions of various parts of the zebra finch song system: implications for vocal learning. J Neurosci. 1991;11:2896–2913. doi: 10.1523/JNEUROSCI.11-09-02896.1991. [DOI] [PMC free article] [PubMed] [Google Scholar]
- Sibley CG, Ahlquist JE. Phylogeny and classification of birds: a study in molecular evolution. Yale University Press; New Haven: 1990. [Google Scholar]
- Smith VA, Jarvis ED, Hartemink AJ. Evaluating functional network inference using simulations of complex biological systems. Bioinformatics. 2002;18:216S–224S. doi: 10.1093/bioinformatics/18.suppl_1.s216. [DOI] [PubMed] [Google Scholar]
- Smith VA, Jarvis ED, Hartemink AJ. Influence of network topology and data collection on functional network inference. Pacific Symp Biocomput. 2003 (in press) [PubMed] [Google Scholar]
- Soares MB. Identification and cloning of differentially expressed genes. Curr Opin Biotech. 1997;8:542–546. doi: 10.1016/s0958-1669(97)80026-2. [DOI] [PubMed] [Google Scholar]
- Soares MB, de Fatima Bonaldo M. Constructing and screening normalized cDNA libraries. In: Birren B, Green ED, Klapholz S, Myers RM, Roskams J, editors. Genome analysis, a laboratory manual, vol 2. Detecting genes. Cold Spring Harbor Laboratory Press; New York: 1998. pp. 49–158. [Google Scholar]
- Spiro JE, Dalva MB, Mooney R. Long-range inhibition within the zebra finch song nucleus RA can coordinate the firing of multiple projection neurons. J Neurophysiol. 1999;81:3007–3020. doi: 10.1152/jn.1999.81.6.3007. [DOI] [PubMed] [Google Scholar]
- Striedter GF. The vocal control pathways in budgerigars differ from those in songbirds. J Comp Neurol. 1994;343:35–56. doi: 10.1002/cne.903430104. [DOI] [PubMed] [Google Scholar]
- Stripling R, Volman SF, Clayton DF. Response modulation in the zebra finch neostriatum: relationship to nuclear gene regulation. J Neurosci. 1997;17:3883–3893. doi: 10.1523/JNEUROSCI.17-10-03883.1997. [DOI] [PMC free article] [PubMed] [Google Scholar]
- Sugahara Y, Carninci P, Itoh M, Shibata K, Konno H, Endo T, Muramatsu M, Hayashizaki Y. Comparative evaluation of 5′-end-sequence quality of clones in CAP trapper and other full-length-cDNA libraries. Gene. 2001;263:93–102. doi: 10.1016/s0378-1119(00)00557-6. [DOI] [PubMed] [Google Scholar]
- Tchernichovski O, Nottebohm F, Ho CE, Pesaran B, Mitra PP. A procedure for an automated measurement of song similarity. Anim Behav. 2000;59:1167–1176. doi: 10.1006/anbe.1999.1416. [DOI] [PubMed] [Google Scholar]
- Tchernichovski O, Mitra PP. Towards quantification of vocal imitation in the zebra finch. J Comp Physiol A. 2002 doi: 10.1007/s00359-002-0352-4. [DOI] [PubMed] [Google Scholar]
- Thorpe WH. Bird-song. Cambridge University Press; New York: 1961. [Google Scholar]
- Venter J, et al. The sequence of the human genome. Science. 2001;291:1304–1351. doi: 10.1126/science.1058040. [DOI] [PubMed] [Google Scholar]
- Wada K, Sakaguchi H, Jarvis ED. Brain evolution revealed through glutamate receptor expression profiles (abstract) Soc Neurosci Meet. 2001;31:538.10. [Google Scholar]
- Watson JD, Crick FHC. Genetical implications of the structure of deoxyribonucleic acid. Nature. 1953;171:964–967. doi: 10.1038/171964b0. [DOI] [PubMed] [Google Scholar]
- Weaver DC, Workman CT, Stormo GD. Modeling regulatory networks with weight matrices. Pacific Symp Biocomput. 1999;4:112–123. doi: 10.1142/9789814447300_0011. [DOI] [PubMed] [Google Scholar]
- Whitney O, Soderstrom K, Johnson F. Post-transcriptional regulation of zenk expression associated with zebra finch vocal development. Brain Res Mol Brain Res. 2000;80:279–290. doi: 10.1016/s0169-328x(00)00178-9. [DOI] [PMC free article] [PubMed] [Google Scholar]
- Williams H. Choreography of song, dance and beak movements in the zebra finch (Taeniopygia guttata) J Exp Biol. 2001;204:3497–3506. doi: 10.1242/jeb.204.20.3497. [DOI] [PubMed] [Google Scholar]
- Williams H, Mehta N. Changes in adult zebra finch song require a forebrain nucleus that is not necessary for song production. J Neurobiol. 1999;39:14–28. [PubMed] [Google Scholar]
- Yoo C, Thorsson V, Cooper GF. Discovery of causal relationships in a gene-regulation pathway from a mixture of experimental and observational DNA microarray data. Pacific Symp Biocomput. 2002;7:498–509. doi: 10.1142/9789812799623_0046. [DOI] [PubMed] [Google Scholar]
- Yu AC, Margoliash D. Temporal hierarchical control of singing in birds. Science. 1996;273:1871–1875. doi: 10.1126/science.273.5283.1871. [DOI] [PubMed] [Google Scholar]
- Zeidenberg M. Modeling the brain. BYTE. 1987 December;:237–246. [Google Scholar]