Abstract
The stroke-prone spontaneously hypertensive rat (SHRSP) is a genetically determined model of “salt-sensitive” stroke and hypertension whose full phenotypic expression is said to require a diet high in Na+ and low in K+. We tested the hypothesis that dietary Cl− determines the phenotypic expression of the SHRSP. In the SHRSP fed a normal NaCl diet, supplementing dietary K+ with KCl exacerbated hypertension, whereas supplementing either KHCO3 or potassium citrate (KB/C) attenuated hypertension, when blood pressure (BP) was measured radiotelemetrically, directly and continually. Supplemental KCl, but not KB/C, induced strokes, which occurred in all and only those rats in the highest quartiles of both BP and plasma renin activity (PRA). PRA was higher with KCl than with KB/C. These observations demonstrate that with respect to both severity of hypertension and frequency of stroke the phenotypic expression of the SHRSP is (i) either increased or decreased, depending on whether the anionic component of the potassium salt supplemented is, or is not, Cl−; (ii) increased by supplementing Cl− without supplementing Na+, and despite supplementing K+; and hence (iii) both selectively Cl−-sensitive and Cl−-determined. The observations suggest that in the SHRSP selectively supplemented with Cl− the likelihood of stroke depends on the extent to which both BP and PRA increase.
Only as its chloride salt does dietary Na+ induce hypertension (1–5). However, in both humans and rats, Cl− loading without Na+ has repeatedly failed to induce such “salt-sensitive” hypertension (6–8), and supplementing dietary potassium with KCl has repeatedly been found to attenuate it (9–11). Thus, it is generally assumed that dietary Cl− has no pressor effect independent of that of dietary Na+. Yet, in the spontaneously hypertensive rat (SHR), dietary Cl− might exert a Na+-independent pressor effect (12) because of its Na+-independent capacity to induce and enhance renal vasoconstriction (13–17) that may affect the afferent arteriole (14). In the SHR, and presumably also in its genetic substrain, the stroke-prone SHR (SHRSP), narrowing of the afferent arteriole may give rise to hypertension (18–21). The extent of that narrowing in the SHR varies directly with the severity of its pharmacologically attenuated hypertension (21, 22). Thus, by augmenting that narrowing, supplementing dietary Cl−, even with KCl, might both exacerbate hypertension and increase plasma renin activity (PRA) (vide infra) and thereby induce stroke in the SHRSP, much as does loading dietary Cl− with NaCl (23–25). Unopposed by supplemental Cl−, supplemental KHCO3 might induce in the SHRSP effects on hypertension, PRA, and the frequency of stroke opposite to those of supplemental KCl. We report positive tests of this hypothesis.
METHODS
Weanling male SHRSP were obtained from the colony at the University of Iowa (Iowa City). Rats were fed Purina rat chow from 3 to 6 weeks of age; thereafter, until they were killed at 25 weeks, they were fed a Japanese style diet (Zeigler, Gardners, PA) containing 0.5% K+ and 0.4% NaCl. At 10 weeks, rats were randomly assigned to three different dietary groups: (i) no K+ supplement, as a control (CTL, n = 20), or a 2% K+ diet formulated either with (ii) potassium chloride (KCl, n = 17); or (iii) either KHCO3 or potassium citrate (KB/C, n = 15). Over the 4-week period preceding their randomization, all rats were fed the last, “iii”, diet. In the feeding protocol we employed, the average daily intake of food consumed in each of the three treatment groups was calculated weekly. The treatment group with the least daily intake of 1 week became the target group of the next week. Deionized distilled water was supplied as drinking water ad libitum throughout the study.
In each rat at about 8 weeks of age and at a body weight (BW) of at least 180 g, we surgically implanted intraperitoneally a radiotelemetric BP measuring device in which a pressure-sensing catheter inserted into the infrarenal aorta actuated a battery-operated radiotransmitter attached to the peritoneal abdominal wall (model TA11PA; Data Sciences, St. Paul, MN). The radio-transmitted signal of each rat was captured by a receiver near each rat. The receivers were connected to a BCM-100 consolidation matrix (Data Sciences), which transmitted the digitized signals to a Dataquest acquisition system that enabled a direct continuous read-out of each rat’s BP (Data Sciences). Rats were housed individually in metabolic cages in a constant temperature room with a 12-hr dark/light cycle (dark, 7 p.m. to 7 a.m.). All procedures were carried out according to the guidelines of the University of California, San Francisco, Committee on Animal Research.
In each rat, over the period extending from 9 to 24 weeks of age, we calculated successive mean weekly values of systolic BP (SBP) and diastolic BP (DBP) from successive mean 24-hr values, which in turn were calculated from measurements of SBP and DBP made telemetrically every 5 min over 5-sec intervals. In individual rats, we analyzed the relationship between the increase in SBP 4 weeks after assignment (dP/4w) and that 14 weeks afterward (dP/14w) by subtracting the mean weekly values of SBP measured at baseline from those measured at 4 and 14 weeks, respectively.
We examined rats daily for signs of stroke such as irritability, lethargy, akinesia, and convulsions. On the death of each rat, we inspected its brain for gross pathological abnormalities and conserved it in 10% buffered formalin. In tissues stained with hematoxylin/eosin, 3μm sections of coronal slices were examined by light microscopy without knowledge of experimental groups. Stroke was judged to have occurred only in rats with both clinical signs and histological evidence of stroke. At week 24 blood samples were obtained from the tail artery to measure hematocrit. Rats were decapitated at the end of week 25. Truncal blood samples were obtained to analyze plasma renin activity (PRA). PRA was measured by using a radioimmunoassay for angiotensin I and expressed as nanograms angiotensin I generated per ml plasma during a 2-hr incubation at 37°C and pH 6.5 (ng/ml/hr) (26).
To analyze the relationship between SBP and PRA, we used averaged 24-hr SBP values from all measurements made in each rat over the last 5 weeks of study. The values of PRA in two KCl-supplemented rats that died of stroke 12 and 13 weeks after randomization were assumed from the regression line defining the relationship between BP and PRA in those members of the KCl group that survived until the study ended.
BW of each rat was measured weekly. Twenty-four-hour urinary excretion rates of Na+, K+ and Cl− were analyzed at weeks 10, 14, 18, 22, and 25.
In a second group of SHRSP fed the same diets on the same schedules as before, CTL (n = 15), KCl (n = 17), and KB/C (n = 16), at week 13, 3 weeks after assignment, a femoral arterial catheter was implanted and its outer end externalized at the nape of the neck through a subcutaneous tunnel. At week 14, a blood sample was drawn from the catheter at 5 a.m. for the measurement of electrolytes, arterial blood PCO2, and pH.
Because the mean weekly values of BP of individual rats within treatment groups were not normally distributed, we calculated differences between groups by a nonparametric, bias-corrected bootstrap method (27). P values were calculated as one minus the smallest confidence level for which the corresponding confidence interval includes zero. The relationships between SBP and the log-transformed PRA, and between dP/4w and dP/14w in individual rats, were analyzed by linear regression. Urinary electrolyte excretion rates and values of PRA within dietary groups were analyzed by Kruskal–Wallis test. The frequency of stroke was assessed by a χ2 test. The effects of diet on serum electrolytes and on arterial blood gases were analyzed by ANOVA followed by Student–Newman–Keuls method.
RESULTS
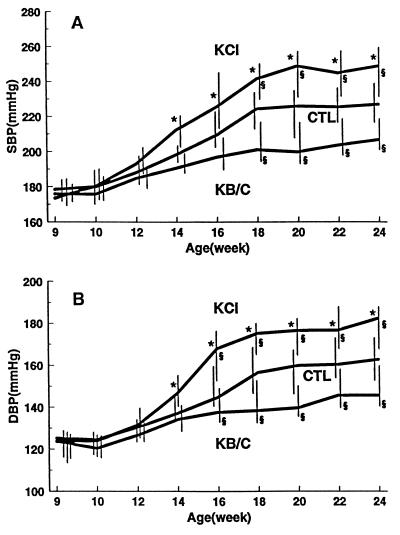
At baseline in 9-week-old rats, SBP, in mmHg (median and 95% C.I.), was 178 (174/184) in the control group (CTL), 173 (169/185) in the group given KCl (KCl), and 176 (173/181) in the group given either KHCO3 or potassium citrate (KB/C) (P = ns); for DBP, the values were 125 (118/132), 124 (115/130), and 124 (117/129), respectively (P = ns) (Fig. 1). Thereafter, in each group both SBP and DBP increased progressively until 18 weeks, then plateaued and persisted at maximal values over the last 5 weeks of the study. Supplemental KCl exacerbated, and supplemental KB/C attenuated, the rate and extent of increase in BP relative to those occurring in CTL. As expected, the attenuating effect of KHCO3 was virtually identical to that of potassium citrate (whose anion is converted quantitatively to HCO3− in the liver). The divergent effects of supplemental KCl and supplemental KB/C on BP became significantly different from each other within 4 weeks of assignment and from CTL within 8 weeks. The maximal median value of SBP attained in CTL was 226 (212/235), in KCl, 248 (230/258), and in KB/C, 204 (197/217) (P < 0.05); for DBP the values were 161 (149/171), 179 (167/186), and 144 (140/156), respectively (P < 0.05).
Figure 1.
The effects on SBP (A) and DBP (B) induced in the SHRSP by supplementing dietary K+ from 10 weeks of age with either KCl or KB/C or nothing, as a control (CTL). Data are presented as median and 95% C.I.; ∗ denotes a significant difference (P < 0.05) between the K+-supplemented groups; § denotes a significant difference between the K+-supplemented groups and control.
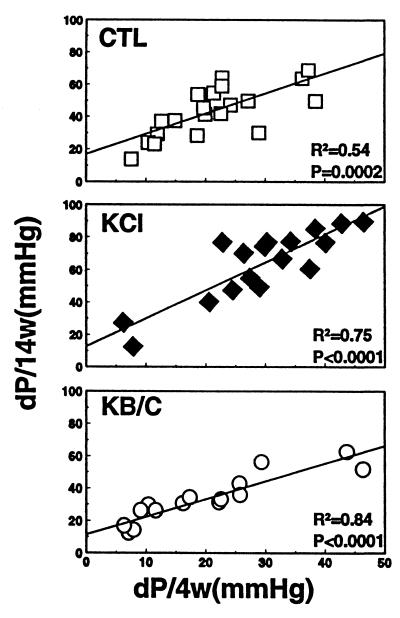
In individual rats from all groups, the increase in BP 4 weeks after randomization strongly predicted the increase 14 weeks afterward (Fig. 2).
Figure 2.
Relationship between the increase in SBP 4 weeks after assignment (dP/4w) and that 14 weeks afterward (dP/14w) in individual rats supplemented with nothing (CTL), KCl, or KB/C.
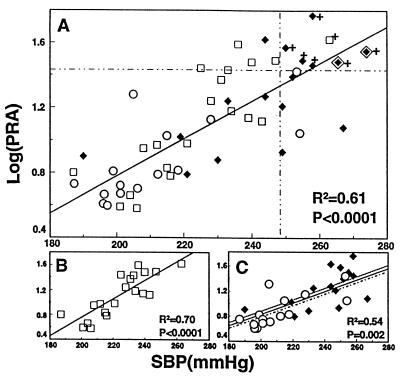
After BP had plateaued at maximal levels, stroke occurred in 1/20 (5%) in CTL, 6/17 (35.3%) in KCl, and 0/15 (0%) in KB/C (Fig. 3). The frequency of stroke was significantly greater in the KCl group than in the KB/C group (P < 0.05). Strokes occurred in all and only those rats in which the levels of both SBP and PRA were in their highest quartiles, >248 mmHg and >26.5 ng/ml/hr, respectively (Fig. 3).
Figure 3.
The relationship between maximally attained SBP and PRA and the occurrence of stroke in individual rats from all treatment groups (A) and in separate treatment groups (B and C) supplemented with either KCl (♦) or KB/C (○) or nothing (CTL, □). The symbol ◊⧫ indicates two KCl-supplemented rats that died of stroke before completion of the study in which the value of PRA in each was assumed from the regression line defining the relationship between BP and PRA in those rats with KCl that survived until the study ended. Data points affixed with the symbol + are those derived from rats in which stroke occurred. The vertical and horizontal dashed lines demarcate the highest quartiles for the values of SBP and PRA. In C, the dashed line represents the relationship between SBP and PRA with KCl; the dotted line, that with KB/C.
The median value (and 95% C.I.) of PRA (ng/ml/hr) was 13.6 (6.8/26.9) in CTL, 17.4 (8.6/30.8) in KCl, and 6.2 (4.7/11.2) in KB/C. The median value of the KCl group was significantly higher than that of the KB/C group (P < 0.05).
When the severity of hypertension had plateaued at maximal levels in all treatment groups, within each group and in that combined from all three, the values of SBP and PRA from individual rats varied directly and highly significantly with each other throughout their range of variation (Fig. 3). With respect to slope and intercept, the line of regression defining the relationship between SBP and PRA in each K+-supplemented group was virtually identical to that in the other and was not different from that in the control group. The values of SBP and PRA in the K+-supplemented groups partially overlapped and, combined, comprised a normal distribution and just spanned those in the control group. The direct relationship between SBP and PRA was continuous across all treatment groups.
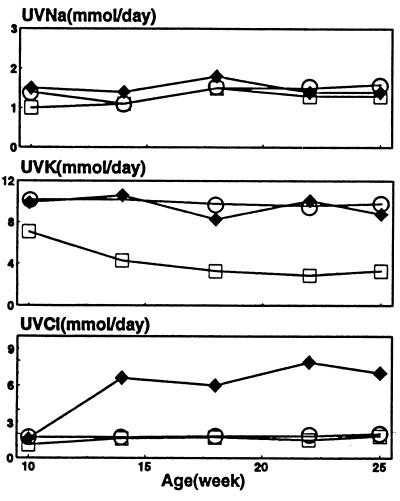
Throughout the study, urinary excretion of Na+ was similar and unchanging in all groups (Fig. 4). Urinary excretion of K+ was similar and unchanging with supplemental KCl and KB/C. Urinary excretion of Cl− increased only when KCl was supplemented (P < 0.05). Four weeks after assignment, in the KCl group the serum concentration of Cl− was slightly higher than that in the KB/C and CTL groups (P < 0.05), and the plasma concentration of HCO3− was slightly lower (P < 0.05). Values of serum concentration of Na+ and K+ were identical among groups (Table 1). At the end of the study, the hematocrits of the three groups were not different.
Figure 4.
Time courses of urinary excretion rates of Na+ (UVNa), K+ (UVK), and Cl− (UVCl): CTL (□), KCl (♦), and KB/C (○).
Table 1.
Effect of ingested potassium salts on blood electrolytes (mEq/l), pH, and PCO2 (mm Hg)
| Serum
|
Arterial blood
|
|||||
|---|---|---|---|---|---|---|
| Treatment | Na+ | K+ | Cl− | HCO3− | pH | PCO2 |
| CTL | 141.3 ± 1.9 | 5.0 ± 0.3 | 103.5 ± 1.5 | 28.1 ± 1.1 | 7.46 ± 0.03 | 40.3 ± 4.2 |
| KCl | 141.3 ± 2.3 | 5.1 ± 0.5 | 105.4 ± 2.6* | 27.4 ± 1.2** | 7.45 ± 0.04 | 39.3 ± 4.1 |
| KB/C | 140.0 ± 2.8 | 5.2 ± 0.5 | 103.2 ± 2.3 | 29.1 ± 1.3 | 7.50 ± 0.03*** | 37.8 ± 2.9 |
Data are expressed as mean ± SD.
, P < 0.05, KCl vs. either CTL or KB/C; ∗∗, P < 0.05, KCl vs. KB/C; ∗∗∗, P < 0.05, KB/C vs. either CTL or KCl.
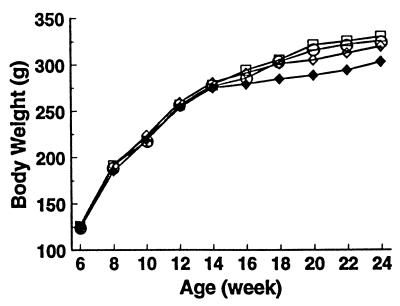
BW increased progressively with age and in all groups to a similar extent (Fig. 5). Because rats with stroke gained less weight than the others, after week 16 BW tended to be lower in the KCl group than that in the other groups but not to a significant extent. Rats with stroke ate less than those without. When the BWs of the animals with stroke were omitted from analysis, BWs of CTL, KB/C and KCl were virtually identical throughout the study.
Figure 5.
Time courses of body weights in individual treatment groups: CTL (□), KB/C (○), KCl (all rats) (♦), and KCl (rats without stroke) (⋄).
DISCUSSION
The current observations demonstrate that in the SHRSP fed a normal NaCl diet, supplementing dietary K+ with KCl induced a persisting exacerbation of hypertension and strokes, whereas supplementing KB/C induced a persisting attenuation of hypertension and no strokes. These observations confirm the antipressor (10, 28), stroke-preventing (10, 23), or stroke-delaying (28, 29) effects of supplemental dietary potassium when supplemented as KB/C in the SHRSP. That these effects of K+ were overridden by those of Cl− indicates the strength of the pressor, stroke-promoting effects of supplemental Cl−. That these effects of supplemental Cl− occurred without supplemental Na+ indicates the selective sufficiency of supplemental Cl− to induce them. Thus, both the severity of hypertension and likelihood of stroke in the SHRSP are not only “NaCl-sensitive” (23, 30, 31) but also selectively “Cl−-sensitive.” The question then becomes: to what extent does the Cl− component of loaded dietary NaCl independently mediate that salt’s pressor effect in the SHRSP? Given the strength and selectivity of Cl− sensitivity observed in the current study of the SHRSP, the observation in this rat that NaCl loading, but not NaHCO3 loading, exacerbated hypertension (31) suggests that the Cl− component of loaded NaCl is both necessary and sufficient to induce exacerbation with NaCl.
In the current study strokes occurred almost exclusively in KCl-supplemented rats, in none of KB/C-supplemented rats, but in all and only those rats in which the levels of both SBP and PRA were in their highest quartiles (Fig. 3). These observations complement those which suggest that the likelihood of stroke in the SHRSP can depend on the extent to which both BP and PRA are increased (23–25). Increased PRA may be an important pathogenetic determinant of the cerebrovascular damage and angionecrosis characteristic of the SHRSP by increasing exposure of the cerebral vasculature to angiotensin II (23), whose rate of formation, and that of its obligate precursor, angiotensin I, is determined by the level of renin.
The current observations are at clear variance with recent assertions that full phenotypic expression in the SHRSP—i.e., the occurrence of stroke requires a high-Na+, low-K+ diet, and is independent of the severity of hypertension (32). In accord with these assertions, in the one other published study of the SHRSP in which both KCl and potassium citrate were supplemented (10), each was found to similarly reduce the frequency of stroke and judged to do so independently of any attenuation of hypertension. But in distinction from the current study, in that study, and in other studies of the SHRSP in which the prevention (10, 23) or delay (28, 29) of stroke observed with supplemental potassium citrate could not be related to attenuation of hypertension, NaCl was loaded and BP measured only acutely, relatively infrequently, and usually indirectly in rats that were either anaesthetized or restrained. BP so measured would provide no indication of its naturally occurring rhythmic series of values integrated over time (33), and hence would give only a rough estimate of the vascular burden of chronic hypertension.
Four weeks after the rats were randomized, when supplemental KCl and KB/C were first discerned to induce divergent effects on SBP, the increase in SBP in individual rats from all treatment groups strongly predicted each rat’s ultimate increase (Fig. 2). Indeed, the increase in SBP with KCl was already half that ultimately attained (Fig. 2). Yet, the urinary excretion rates of protein remained similar in all treatment groups (unpublished observation), urinary excretion rates and serum concentrations of Na+ and K+ in rats supplemented with KCl were not different from those in rats given KB/C and BWs and later hematocrits were near identical. Thus, neither differences in degree of renal damage, nor differences in intestinal absorption or renal handling of Na+, K+, or water can be readily invoked to explain the initial and hence subsequent divergent pressor effects observed with supplemented KCl and KB/C.
In the SHR there is considerable evidence that narrowing of the afferent arteriole gives rise to hypertension (18–21), and that the extent of that narrowing can be a major determinant of the severity of hypertension (21, 22). Supplemental dietary Cl− that induces chloruresis induces an increased delivery of Cl− to the macula densa of the thick ascending limb of the renal tubule, and that increased delivery can entrain constriction of the afferent arteriole as part of the normal tubuloglomerular feedback response (34). In the SHR an exaggeration of this response has been observed (35), even into adulthood (36, 37), and proposed as a mechanism of hypertension (35, 37, 38). In the SHRSP, a Cl−-mediated constriction of the renal afferent arteriole that further narrows it might then exacerbate hypertension. An increased delivery of Cl− to the macula densa normally entrains suppression of renin release from the afferent arteriole (34). But in the SHRSP, a Cl−-mediated further narrowing of the afferent arteriole severe enough to impede transmission of systemic pressure to its distal-most segment could increase its baroreceptor-mediated release of renin and hence also the level of PRA (39, 40). If the extent of afferent arteriolar narrowing were a major determinant of the levels of both SBP and PRA in the SHRSP, these levels might be expected to vary directly with each other throughout their range of variation, as was observed across all treatment groups in the current study. In the SHRSP, a Cl−-mediated further narrowing of the afferent arteriole might explain the occurrence of “paradoxical” hyperreninemia when NaCl loading exacerbated hypertension and histological evidence of renal injury was not yet apparent (23).
If selective chloride sensitivity is a phenotypic characteristic of the SHRSP, it could also be a phenotypic characteristic of genetically determined human hypertension. In a recent study of patients selected only for essential hypertension, supplementing dietary K+ with KHCO3 induced at 8 weeks a significant attenuation of hypertension compared with placebo, whereas similarly supplemented KCl did not (41). Major attention has been directed toward genetically determined mechanisms that cause human hypertension by increasing renal tubular reabsorption of Na+ primarily (42), and that of Cl− secondarily, such that an increased renal retention of both ions, together with a commensurate amount of water, effects an expansion of plasma volume (43, 44). Renal retention of Na+ and water that expands plasma volume is widely believed to initiate the pathogenesis of human “essential hypertension” (43, 44), and the genetically determined hypertension of the Dahl “salt-sensitive” rat (20, 45). However, the fact of selective Cl− sensitivity in the salt-sensitive SHRSP suggests the possibility that a genetically determined mechanism of salt-sensitive hypertension might primarily affect the renal tubular transport of Cl−, or the capacity of Cl− to stimulate renal vasoconstriction (16, 17), which might take the form of an exaggerated tubuloglomerular feedback response (35, 38) that reduces medullary blood flow and the capacity of the kidney to excrete salt (46). Whatever the precise mechanism of selective Cl− sensitivity in the SHRSP, the phenomenon and its demonstration with KCl, a salt well known to have natriuretic and diuretic effects, raise the possibility that an increased renal retention of Na+ and water need not be the initial physiological consequence of all genetically determined mechanisms of salt-sensitive hypertension either in rats or humans. Given the likelihood that human essential hypertension is polygenic in causation in many of those affected, in some the phenomenon of salt-sensitivity might reflect both a primary increase in renal tubular reabsorption of Na+ and a Cl−-mediated exaggeration of the tubuloglomerular feedback response.
Acknowledgments
Suellen Newton and Carrie Gustavson provided excellent technical assistance. We thank Dr. Peter Bacchetti for assistance in statistical analysis. We also thank Dr. Ian Reid for measuring plasma renin activity. These studies were carried out in the General Clinical Research Center, University of California, San Francisco, with funds provided by the Division of Research Resources (5 MO1 RR-000079), U.S. Public Health Service, the National Heart, Lung and Blood Institute (RO1 HL 47943), and generous gifts from the Church and Dwight Corporation and the Emil Mosbacher, Jr., Foundation.
ABBREVIATIONS
- BW
body weight
- CTL
control
- DBP
diastolic blood pressure
- SBP
systolic blood pressure
- KB/C
either KHCO3 or potassium citrate
- PRA
plasma renin activity
- SHR
spontaneously hypertensive rat
- SHRSP
stroke-prone SHR
References
- 1.Kurtz T W, Morris R C., Jr Science. 1983;222:1139–1141. doi: 10.1126/science.6648527. [DOI] [PubMed] [Google Scholar]
- 2.Whitescarver S A, Ott C E, Jackson B A, Guthrie G P, Jr, Kotchen T A. Science. 1984;223:1430–1432. doi: 10.1126/science.6322303. [DOI] [PubMed] [Google Scholar]
- 3.Passmore, J. C., Whitescarver, S. A., Ott, C. E. & Kotchen, T. A. (1985) Hypertension 7 (Suppl. I), I-115–I-120. [DOI] [PubMed]
- 4.Kurtz T W, Al-Bander H A, Morris R C., Jr N Engl J Med. 1987;317:1043–1048. doi: 10.1056/NEJM198710223171702. [DOI] [PubMed] [Google Scholar]
- 5.Shore A C, Markandu N D, MacGregor G A. J Hypertens. 1988;6:613–617. doi: 10.1097/00004872-198808000-00003. [DOI] [PubMed] [Google Scholar]
- 6.Grollman A, Harrison T R, Mason M F, Baxter J, Crampton J, Reichsman F. J Am Med Assoc. 1945;129:533–537. [Google Scholar]
- 7.Dole V P, Dahl L K, Cotzias G C, Eder H A, Krebs M E. J Clin Invest. 1950;29:1189–1206. doi: 10.1172/JCI102357. [DOI] [PMC free article] [PubMed] [Google Scholar]
- 8.Whitescarver S A, Holtzclaw B J, Downs J H, Ott C E, Sowers J R, Kotchen T A. Hypertension. 1986;8:56–61. doi: 10.1161/01.hyp.8.1.56. [DOI] [PubMed] [Google Scholar]
- 9.Dahl L K, Leitl G, Heine M. J Exp Med. 1972;136:318–330. doi: 10.1084/jem.136.2.318. [DOI] [PMC free article] [PubMed] [Google Scholar]
- 10.Tobian L. Can J Physiol Pharmacol. 1986;64:840–848. doi: 10.1139/y86-145. [DOI] [PubMed] [Google Scholar]
- 11.Cappuccio F P, MacGregor G A. J Hypertens. 1991;9:465–473. doi: 10.1097/00004872-199105000-00011. [DOI] [PubMed] [Google Scholar]
- 12.Wyss J M, Liumsiricharoen M, Sripairojthikoon W, Brown D, Gist R, Oparil S. Hypertension. 1987;9:III-171–III-175. doi: 10.1161/01.hyp.9.6_pt_2.iii171. [DOI] [PubMed] [Google Scholar]
- 13.Wilcox C S. J Clin Invest. 1983;71:726–735. doi: 10.1172/JCI110820. [DOI] [PMC free article] [PubMed] [Google Scholar]
- 14.Bullivant E M A, Wilcox C S, Welch W J. Am J Physiol. 1989;256:F152–F157. doi: 10.1152/ajprenal.1989.256.1.F152. [DOI] [PubMed] [Google Scholar]
- 15.Passmore J C, Jimenez A E. Can J Physiol Pharmacol. 1991;69:501–511. doi: 10.1139/y91-076. [DOI] [PubMed] [Google Scholar]
- 16.Quilley C P, Lin Y-S R, McGiff J C. Br J Pharmacol. 1993;108:106–110. doi: 10.1111/j.1476-5381.1993.tb13447.x. [DOI] [PMC free article] [PubMed] [Google Scholar]
- 17.Yin K, McGiff J C, Bell-Quilley C P. Am J Physiol. 1995;268:F561–F568. doi: 10.1152/ajprenal.1995.268.4.F561. [DOI] [PubMed] [Google Scholar]
- 18.Norman R A, Jr, Enobakhare J A, DeClue J W, Douglas B H, Guyton A C. Am J Physiol. 1978;234:R98–R103. doi: 10.1152/ajpregu.1978.234.3.R98. [DOI] [PubMed] [Google Scholar]
- 19.Azar S, Johnson M A, Scheinman J, Bruno L, Tobian L. Clin Sci. 1979;56:203–209. doi: 10.1042/cs0560203. [DOI] [PubMed] [Google Scholar]
- 20.Kimura G, Brenner B M. In: The Renal Basis for Salt Sensitivity in Hypertension. 2nd Ed. Laragh J H, Brenner B M, editors. New York: Raven; 1995. pp. 1569–1588. [Google Scholar]
- 21.Skov K, Fenger-Gron J, Mulvany M J. Hypertension. 1996;28:464–471. doi: 10.1161/01.hyp.28.3.464. [DOI] [PubMed] [Google Scholar]
- 22.Notoya M, Nakamura M, Mizojiri K. Hypertension. 1996;27:364–370. doi: 10.1161/01.hyp.27.3.364. [DOI] [PubMed] [Google Scholar]
- 23.Volpe M, Camargo M J F, Mueller F B, Campbell W G, Jr, Sealey J E, Pecker M S, Sosa R E, Laragh J H. Hypertension. 1990;15:318–326. doi: 10.1161/01.hyp.15.3.318. [DOI] [PubMed] [Google Scholar]
- 24.Shibota M, Nagaoka A, Shino A, Fujita T. Am J Physiol. 1979;236:H409–H416. doi: 10.1152/ajpheart.1979.236.3.H409. [DOI] [PubMed] [Google Scholar]
- 25.Nagaoka A, Shino A, Shibota M. Am J Physiol. 1980;238:H317–H324. doi: 10.1152/ajpheart.1980.238.3.H317. [DOI] [PubMed] [Google Scholar]
- 26.Menard J, Catt K J. Endocrinology. 1972;90:422–430. doi: 10.1210/endo-90-2-422. [DOI] [PubMed] [Google Scholar]
- 27.Efron B. An Introduction to the Bootstrap. New York: Chapman & Hall; 1993. [Google Scholar]
- 28.Smeda J S. Stroke. 1989;20:1212–1218. doi: 10.1161/01.str.20.9.1212. [DOI] [PubMed] [Google Scholar]
- 29.Smeda J S, Tkachenko O. Clin Sci. 1991;81:335–340. doi: 10.1042/cs0810335. [DOI] [PubMed] [Google Scholar]
- 30.Okamoto, K., Yamori, Y. & Nagaoka, A. (1974) Circ. Res. 34 (Suppl. 1), I-143–I-153.
- 31.Luft F C, Steinberg H, Ganten U, Meyer D, Gless K H, Lang R E, Fineberg N S, Rascher W, Unger Th, Ganten D. Clin Sci. 1988;74:577–585. doi: 10.1042/cs0740577. [DOI] [PubMed] [Google Scholar]
- 32.Rubattu S, Volpe M, Kreutz R, Ganten U, Ganten D, Lindpaintner K. Nat Genet. 1996;13:429–434. doi: 10.1038/ng0896-429. [DOI] [PubMed] [Google Scholar]
- 33.Calhoun D A, Zhu S, Wyss J M, Oparil S. Hypertension. 1994;24:1–7. doi: 10.1161/01.hyp.24.1.1. [DOI] [PubMed] [Google Scholar]
- 34.Briggs J P, Schnermann J. In: Control of Renin Release and Glomerular Vascular Tone by the Juxtaglomerular Apparatus. 2nd Ed. Laragh J H, Brenner B M, editors. New York: Raven; 1995. pp. 1359–1383. [Google Scholar]
- 35.Arendshorst W J. Annu Rev Physiol. 1987;49:295–317. doi: 10.1146/annurev.ph.49.030187.001455. [DOI] [PubMed] [Google Scholar]
- 36.Leyssac P P, Holstein-Rathlou N-H. Pflügers Arch. 1989;413:267–272. doi: 10.1007/BF00583540. [DOI] [PubMed] [Google Scholar]
- 37.Ushiogi Y, Takabatake T, Haberle D A. Kidney Int. 1991;39:1184–1192. doi: 10.1038/ki.1991.150. [DOI] [PubMed] [Google Scholar]
- 38.Kurokawa K. Kidney Int. 1996;49:S-46–S-51. doi: 10.1038/ki.1996.262. [DOI] [PubMed] [Google Scholar]
- 39.Sealey J E, Blumenfeld J D, Bell G M, Pecker M S, Sommers S C, Laragh J H. In: Nephron Heterogeneity with Unsuppressible Renin Secretion: A Cause of Essential Hypertension. 2nd Ed. Laragh J H, Brenner B M, editors. New York: Raven; 1995. pp. 1405–1421. [Google Scholar]
- 40.Scholz H, Vogel U, Kurtz A. J Physiol (London) 1993;469:511–524. doi: 10.1113/jphysiol.1993.sp019826. [DOI] [PMC free article] [PubMed] [Google Scholar]
- 41.Overlack A, Maus B, Ruppert M, Lennarz M, Kolloch R, Stumpe K O. Dtsch Med Wschr. 1995;120:631–635. doi: 10.1055/s-2008-1055388. [DOI] [PubMed] [Google Scholar]
- 42.Lifton R P. Science. 1996;272:676–680. doi: 10.1126/science.272.5262.676. [DOI] [PubMed] [Google Scholar]
- 43.De Wardener H E. Clin Sci. 1990;79:193–200. doi: 10.1042/cs0790193. [DOI] [PubMed] [Google Scholar]
- 44.Blaustein M P. Kidney Int. 1996;49:1748–1753. doi: 10.1038/ki.1996.260. [DOI] [PubMed] [Google Scholar]
- 45.Greene A S, Yu Z Y, Roman R J, Cowley A W., Jr Am J Physiol. 1990;258:H508–H514. doi: 10.1152/ajpheart.1990.258.2.H508. [DOI] [PubMed] [Google Scholar]
- 46.Cowley A W, Jr, Mattson D L, Lu S, Roman R J. Hypertension. 1995;25:663–673. doi: 10.1161/01.hyp.25.4.663. [DOI] [PubMed] [Google Scholar]


