Abstract
Real-time in vivo imaging of the microvasculature may help both earlier clinical detection of disease and the understanding of tumor-host interaction at various stages of progression. In vivo confocal and multiphoton microscopy is often hampered by bulky optics setup and has limited access to internal organs. A fiber-optic setup avoids these limitations and offers great user maneuverability. We report here the in vivo validation of a fiber-optic confocal fluorescence microprobe imaging system. In addition, we developed an automated fractal-based image analysis to characterize microvascular morphology based on vessel diameter distribution, density, volume fraction, and fractal dimension from real-time data. The system is optimized for use in the far-red and near-infrared region. The flexible 1.5-mm-diameter fiber-optic bundle and microprobe enable great user maneuverability, with a field of view of 423 x 423 µm and a tissue penetration of up to 15 µm. Lateral and axial resolutions are 3.5 and 15 µm. We show that it is possible to obtain high temporal and spatial resolution images of virtually any abdominal viscera in situ using a far-red blood pool imaging probe. Using an orthotopic model of pancreatic ductal adenocarcinoma, we characterized the tumor surface capillary and demonstrated that the imaging system and analysis can quantitatively differentiate between the normal and tumor surface capillary. This clinically approved fiber-optic system, together with the fractal-based image analysis, can potentially be applied to characterize other tumors in vivo and may be a valuable tool to facilitate their clinical evaluation.
Introduction
Tumor capillary is known be more tortuous, leaky, dense, and disorganized in appearance compared to normal capillaries [1,2]. In vivo quantification of changes in vascular morphology both overtime and in comparison to normal capillaries remains challenging, especially for deep tissues. Current approaches to characterize tumor capillary, such as staining for endothelial markers, are mostly qualitative and lack many of the objective measures that define the vasculature [3–5]. Moreover, histologic diagnosis is often a terminal procedure for animal models of tumors, and this limits its use for tracking temporal changes. Several reports have documented quantification of tumor capillary using a dorsal skin-fold window chamber [3,6]. Despite these advances, the window chamber model relies on subcutaneous tumor xenografts and thus limits examination of the pivotal role that the tumor's native microenvironment plays on microvascular changes [7]. This limitation can become pronounced when studying tumors such as pancreatic ductal adenocarcinoma (PDAC), which triggers an intense fibrotic response from the pancreas [8]. Subcutaneous models do not fully recapitulate the increasingly recognized impact of extracellular matrix on both the tumor and its vasculature.
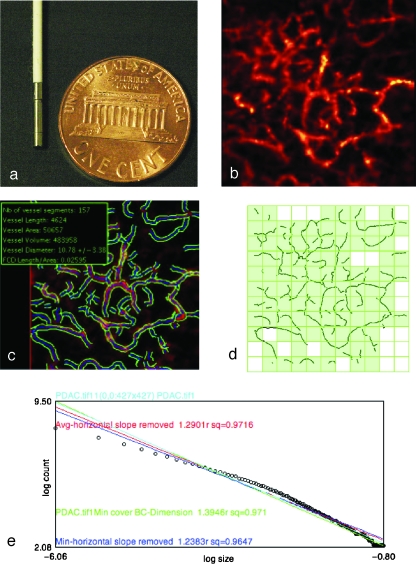
Given these limitations, in the present study, we sought to evaluate the potential for in situ quantitative imaging of tumor surface capillary temporally using a minimally invasive approach. The system, which includes optics, hardware, developed software, and imaging agents, may be used in genetically engineered mice and has the potential for human clinical application. The imaging microprobe is connected to 30,000 fiber-optic threads that enable point-to-point real-time detection at 12 frames/sec. The microprobe's flexibility and size (1.5 mm in diameter; Figure 1) allow for great user maneuverability to scan tissues in situ at angles that would not be possible with any available confocal microscope objective. To make the imaging and vessel morphometric analysis more quantitative and reproducible, we developed an algorithm that automated the delineation of vessels from raw images and computed their mean diameter and density. We also applied fractal geometry to physically describe the complexity of tumor vessels. Specifically, we used an orthotopic mouse model of PDAC to study changes in microvasculature phenotypes. Of note, our vessel segmentation algorithm enabled us to compute the diameter along the entire length of any detected vessel at an interval of 1 pixel. As such, we could construct histograms of vessel diameter distribution and investigate whether PDAC diameter histogram is distinct from that of the normal pancreas.
Figure 1.
Vessel segmentation algorithm was applied to raw images to outline the border and midline of detected vasculature networks. On the basis of this process, quantitative morphology and fractal analyses could be applied. (a) The tip of the microprobe is 1.5 mm in diameter, enabling it to explore internal organs with only a small incision. (b) Microvasculature of pancreatic ductal adenocarcinoma. (c) After segmentation algorithm was applied, information on vessel density, diameter, volume fraction, and diameter distribution were obtained. (d) Image from (c) was RGB-filtered to select the blue channel that contained the vessel midline. Thresholding and binarization were applied to the resultant image to give a skeletonized image with only the vasculature outline. Fractal analysis was applied to this outline. Grid counting method was applied to obtain the fractal parameter fractal dimension. Grids of varying sizes were overlaid on the image. The number of grids containing a vessel segment (shown by the light green-filled boxes) at each grid size was plotted against the grid size at logarithmic scales (e). A best-fit regression line was drawn to fit the resultant points (shown here with open circles), and the negative slope of this line denotes fractal dimension, which serves as a measure of the vasculature's complexity. For each image, four such lines would be drawn, each of which represented a different starting point to overlie the grids. The four lines (shown here with different colors) were averaged to give the final fractal dimension for the image.
Materials and Methods
Fiber-Optic Laser Microprobe
The imaging system, Cellvizio (Mauna Kea Technologies, Paris, France), has three components: a fiber-optic microprobe, a laser scanning unit, and a computer. A custom-made 660-nm laser source is scanned by two mirrors on the proximal surface of a fiber bundle made of 30,000 optical fibers, resulting in a 12-Hz frame rate. The laser was sequentially directed into each fiber to reach the tissue. The fluorescent emitted light is collected back into the same fiber that was used for illumination. The small core diameter of each fiber acts as the pinhole both for excitation and for collection, giving the probe its optical sectioning capability. The imaging microprobe has a tissue penetration depth of 15 µm, and this limits our measurement of vascular phenotype to the surface of the orthotopic tumor and normal organs.
A raw image is reconstructed from the signals collected from each fiber and a real-time processing algorithm reconstructs the image to compensate for irregularities in the fiber bundle packing pattern and for fiber-fiber transmission variability. The signal-to-noise ratio (SNR) was measured at different levels of signal, which the system registers as arbitrary digital unit (ADU). The SNR was taken as the ratio of mean gray level against the SD on a known uniform signal, ranging from 1000 to 7000 ADU. This range covers the signal level encountered in our application. The 1.5-mm-diameter microprobe's field of view is 423 x 423 µm. Lateral and axial resolutions are 3.5 and 15 µm, respectively (Figure 1). This method had been previously compared to intravital fluorescent microscopy, and vessel diameter measurement from both methodologies correlated statistically [2]. To validate this method, immunohistochemical (IHC) staining with antimouse CD31 antibody (Santa Cruz Biotechnologies, Santa Cruz, CA) was used to independently measure vessel diameters in both normal organs and PDAC. Specifically, normal organs and PDAC were harvested (n = 7 from each). These were the same organs that were previously imaged with fiber-optic confocal microprobe. Three surface slices were made at different angles on all normal organs and PDAC. This was to simulate the areas of vasculature that were imaged. Within each slice, two different views at original magnifications of x200 were randomly selected, and the stained vessel's diameter was manually selected and length measured with the software OsiriX (Geneva, Switzerland). In all cases, the shortest distance between two points from an enclosed stained vessel was chosen to avoid overestimation of vessel diameter by obtaining the diameter from vessels that were cut along its longitudinal axis.
Imaging Probe
A fluorescent blood pool agent was used to image the microvasculature of different organs and murine orthotopic pancreatic ductal tumor (Angiosense 680 IVM; VisEn Medical, Woburn, MA). This probe circulated inside normal blood vessels for up to 2 hours and has a molecular weight of 250 kg/mol. The probe has an excitation at 680 ± 10 nm and an emission at 700 ± 10 nm. Excitation was provided by a 660-nm laser.
Vessel Segmentation
The segmentation algorithm defines the border and midline of blood vessels in the image plane, and it follows the principles published by Krissian et al. [9]. Briefly described, vessels were modeled as tubular structures with Gaussian profiles. In this model, vessel centerlines can be detected as ridges that act as maxima of intensity in the direction of surface main curvature. To account for different vessel radii, ridges are detected at different scales; for each scale, a medial response is computed, and only the maxima of this response through the scales are kept. The scale at which a ridge is detected leads to an estimate of vessel radius, which is refined in a later stage through local motion of estimated edges toward image gradient maxima. The result of the segmentation algorithm is several sets of connected points, each set representing a vessel centerline, with a local radius estimation associated with each point of the centerline. Starting from this result, one can easily compute statistics on vessel diameters and vessel density. In the final image, the vessel centerline was noted in blue, and the border in green (Figure 1). Vessel diameter was recorded in micrometers.
Vessel diameter distribution histogram was constructed by taking the diameter along the length of the detected vessel and plotting the proportion of a particular-sized vessel at an interval of 1 µm.
Vessel density was expressed as the percentage of the total length of vessels in an image over the area of the image plane. In other words, vessel density was measured irrespective of changes in vascular diameter. To quantify the combined effect of both vessel density and vessel diameter, we used the parameter vascular volume fraction.
Vascular volume fraction indicated the percentage of tissue space occupied by the vasculature, and it was here computed as the fraction of space occupied by the vessels within the optical section. Vessels were assumed to have a cylindrical shape, and the vessel volume could be obtained using the cylinder volume equation: volume = πr2L, where r is the radius and L is the total length of the vessel, which could be obtained from the vessel density.
To minimize background, we consistently subtracted signal with signal intensity lower than 0.01% of the maximum and vessel length shorter than 10 µm. Vessel diameter, density, and complexity were also plotted into a three-dimensional (3D) scatterplot using the Grapher, a freeware available through Mac OS X and above.
Fractal Analysis
Each segmented image was split into RGB channels, and the blue channel, which contains the vessel centerline, was selected. The resultant image was binarized and skeletonized using ImageJ (NIH, Bethesda, MD). The microvasculature was now denoted by black lines with a pixel diameter against a white background, and this binary image was processed using FracLac, an ImageJ plug-in, for fractal analysis.
Fractal dimension (D) was calculated using the grid-counting method [10]. Briefly, grids of various size length (ε), from 1 pixel to 45% of the image area, were used to cover the entire image, and the number of grid that contains a vessel segment, N(ε), was registered for each grid size. D can be obtained by taking the negative of the slope of a double-logarithmic plot between N(ε) and ε. Stated mathematically, D is estimated using the following equation:
| (1) |
Stated formally, fractal dimension is the derivative of structural detail with respect to magnification [5]. For images that consist of lines, D always varies between 1 and 2, with the higher value representing greater complexity. In our study, D for each image was obtained as the average of four global scans initiated at randomly selected initial point. Because nonlinearity of the double-logarithmic plot occurs as ε approaches to its minimum and maximum, we used a slope-corrected D and included only the linear portion of the plot in our calculation of complexity (Figure 1). This measuring procedure was calibrated with shapes of known fractal dimension with an inaccuracy of less than 3%.
Shape heterogeneity was reflected by the lacunarity (Λ) using the covariance method [11]. Lacunarity is a parameter that measures nonuniformity in an image. If every part of an image resembles every other part, Λ would be low. Λ takes on a value between 0 and 1 and can be calculated from the mean (µ) and variance (σ2) of the number of pixels in a grid of a given size (ε) using the following equation:
| (2) |
σ2 is normalized against µ2 at each ε to give Λε. Λ is then derived by taking the average of all Λε with a total number of scales N. Image analysis was streamlined and automated using Java script.
Cell Culture
Primary murine cell lines (NB587 and NB743) were isolated from mice harboring pancreas specific activating mutation of K-ras and deletion of Ink4a and Arf genes. Mice with these mutations develop spontaneous PDAC in 8 to 11 weeks and recapitulated the clinical and histologic features of human PDAC [12]. Cells were plated and maintained in growth medium (Dulbecco's modified Eagle's medium plus 10% FBS) in a humidified incubator at 37° C, 5% CO2, and 95% humidity. At near confluence, cells were trypsinized and resuspended in HPSS and stored in ice for subsequent orthotopic implantation.
Animal Model and Surgery
The study was approved by the institutional animal care committee. All the mice were operated under gas anesthesia (2% isoflurane in oxygen at 2 L/min) delivered by facemask. Age-matched female nude mice were used for our orthotopic pancreatic cancer model and for the imaging of normal organs. A 1-cm incision was performed in the left upper quadrant of the mouse abdomen. Skin and muscular wall were opened to allow exposure of the pancreas. The spleen was gently exteriorized using a forceps, completely exposing the pancreatic body and tail. A 1-ml syringe attached to a 31G needle was used to inject primary PDAC cell lines into the tail of the pancreas. Muscular wall and skin were then closed separately using nylon monofilament 6-0. We then waited up to 2 weeks to allow for tumor growth and reopened the mouse on days 7 and 14 using the same incision for pancreatic imaging with the flexible laser microprobe. Angiosense 680 IVM (VisEn Medical) was diluted with saline 1:3, and 100 µl was injected intravenously to the tail immediately before the procedure for visualization of the pancreatic microvasculature. The microprobe at the end of the fiber-optic threads was then gently placed on the surface of the liver, kidney, colon, pancreas, and psoas muscle. For mice bearing orthotopic PDAC (n = 7 for each of the two tumor lines), real-time videos of the microvasculature were acquired near the pancreatic tumor surface. Tumor area was measured bidirectionally using a digital caliper. Five nonoverlapping views of each organ were obtained from each of the mice (n = 7).
In addition, intravital multichannel confocal microscopy (Model IV-100; Olympus Corporation, Tokyo, Japan) was used to explore the spatial relation between the microvasculature at tumor surface and the actual tumor. Both NB743 and NB587 primary cell lines were infected with retrovirus encoding the GFP gene.
Statistical Analysis
All values in the study are expressed as mean ± SEM. Analysis on normal organs and tumor surface capillary was each performed on seven mice. No statistical comparison was made among the normal organs examined. For validation of our method with CD-31 IHC staining, data were compared within each organ group. For tumor area measurement, statistical comparison was made between NB587 and NB743 cell lines at weeks 1 and 2 (n = 7 for each primary cell line). For vessel morphometric analyses, comparison between NB587 and control, as well as between NB743 and control, was made at weeks 1 and 2 (n = 7 for each group). The control group consisted of mice receiving saline injection to the pancreas. A two-tailed t-test was used to determine significance, whereby P < .05 indicates significance.
Result
Organ-Specific Microvascular Profile
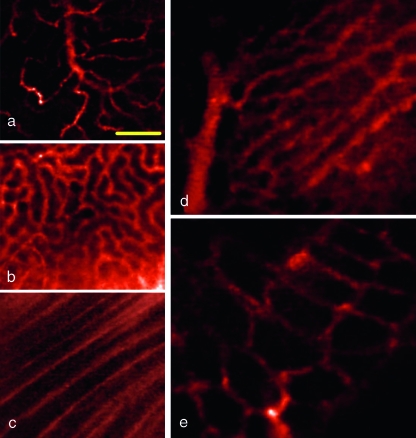
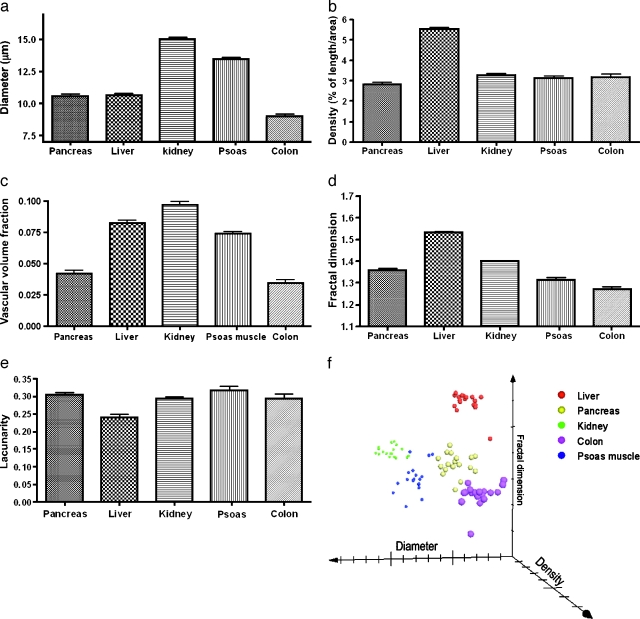
The SNR varied from 10 to 29 at the typically found input signal range of 1000 to 7000 ADU. There was no procedure related to mortality or bleeding. Motion artifact due to respiration occurred approximately once every 4 seconds and was minimized by slightly lifting the pancreas toward the spleen. The five abdominal organs imaged all had distinct morphologic features that could be appreciated qualitatively (Figure 2). In addition, each organ had a unique profile of vessel diameter, density, fractal dimension, and lacunarity. The kidney had the largest vessel diameter (15.31 ± 0.21 µm, with pancreas 10.52 ± 0.17 µm, liver 10.71 ± 0.33 µm, colon 9.04 ± 0.24 µm, and psoas muscles 13.50 ± 0.14 µm; Figure 3a). The liver had the highest density, expressed in % of length/area (5.55 ± 0.11, with pancreas 2.88 ± 0.17, kidney 3.22 ± 0.11, colon 3.19 ± 0.14, and psoas muscles 3.10 ± 0.34; Figure 3b). The kidney had the largest volume fraction, consistent with the notion that the organ receives up to 20% of the cardiac output (9.68 ± 0.23%, with pancreas 4.14 ± 0.22%, liver 8.24 ± 0.27%, colon 3.41 ± 0.23%, and psoas muscles 7.41 ± 0.13%; Figure 3c).
Figure 2.
Microvasculature of abdominal organs in situ: pancreas (a), kidney capsule (b), psoas muscles (c), liver sinusoids (d), and colon (e). Yellow scale bar, 100 µm.
Figure 3.
Quantification of microvasculature morphology of abdominal organs. (a) Vessel diameter. (b) Vessel density was computed as a percentage of vessel length over the image area. (c) Vascular volume fraction was computed from vessel density and diameter. Fractal analysis of fractal dimension (d) and lacunarity (e). (f) Organ-specific clustering in this 3D scatterplot suggested that these different organs' microvasculature has a unique set of diameter, density, and fractal dimension. Each point represented one measurement. Results were obtained from four different animals.
Our vessel diameter data were validated with IHC staining with anti-CD31 antibody. No statistically significant difference was observed between these two techniques (P < .05, n = 4). Specifically, IHC staining showed the pancreatic vessel diameter to be 10.07 ± 0.78 µm, with colon 8.57 ± 0.76 µm, kidneys 16.42 ± 2.54 µm, psoas muscles 12.95 ± 0.87 µm, NB587 PDAC 10.92 ± 1.33, and NB743 PDAC 13.29 ± 1.97 (both PDAC lines were measured 2 weeks after tumor implantation). In addition, our vessel diameter data fell within the range of previously published values on mouse cremaster muscle microvasculature by Laemmel et al. [2]. In that particular study, the authors compared the fiber-optic confocal laser microprobe imaging system with intravital fluorescence microcopy and found that the two methods shared high correlation (r2 = 0.98), with a mean difference between the two methods made on the same vessel equal to 1.2 µm over the entire range of diameter measured.
With regard to the fractal parameters, the liver vasculature also had the highest fractal dimension (1.54 ± 0.01, with pancreas 1.36 ± 0.01, kidney 1.40 ± 0.01, colon 1.27 ± 0.01, and psoas muscles 1.31 ± 0.03; Figure 3d). The vessel lacunarity was similar in pancreas, kidneys, colon, and psoas muscles (0.30 ± 0.02, 0.29 ± 0.01, 0.32 ± 0.01, and 0.29 ± 0.02), whereas the liver sinusoids had the lowest lacunarity (0.24 ± 0.01; see Figure 3e). The unique phenotypic profile of each organ's microvasculature could be graphically represented by using vessel diameter, density, and fractal dimension as the three axes (Figure 3f). The graph shows that points representing each organ cluster and occupy a unique space in this vector field.
Phenotypic Confirmation of PDAC
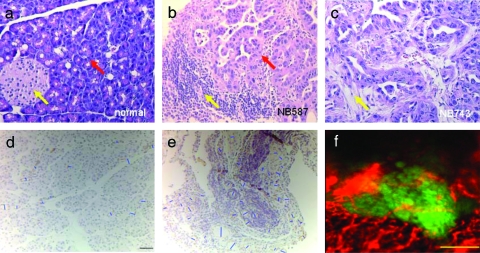
All mice injected with primary PDAC cell lines developed tumors. By day 14, all tumors showed extensive infiltration throughout the pancreas. Histologic finding revealed cellular atypia, extensive desmoplasia, and areas of invasion by malignant ductal cells beyond the basement membrane (Figure 4). Both NB587 and NB743 primary cell lines gave rise to these findings, and these features were also consistent with those previously reported by investigators using the same primary cell lines [12]. The tumors were firm to palpation because of the collagen content.
Figure 4.
Histologic finding of normal pancreas and two orthotopic PDAC tumors with K-ras, Ink4a, and Arf mutations. (a) Hematoxylin and eosin staining of normal pancreas showing an islet of Langerhans (yellow arrow) and the deeply basophilic columnar acinar cells (red arrow). (b) A 2-week-old tumor derived from the NB587 cell line showing lymphocytic infiltrate (yellow arrow) and effacement of the acinar architecture by the invading ductal cells (red arrow). (c) A 2-week-old tumor derived from the NB743 cell line harboring the same mutations as NB587 and served here as an additional confirmation of phenotypes. Similar to (b), poorly formed glands were present in densely fibrotic stroma (yellow arrow) within the pancreatic substance. Original magnifications, x200. (d) IHC staining with anti-CD31 antibody for vessel diameter measurement validation. Blue bars were manually drawn by connecting the shortest point of an area enclosed by positive staining (in light brown). Here, a normal pancreas is shown as an example. Black scale bar, 20 µm. (e) IHC staining of PDAC shows tumor surface capillaries. (f) Intravital multichannel confocal microscopy on live PDAC revealed spatial relation between tumor surface capillaries (false-colored in red) and the GFP+ tumors in green. Yellow scale bar, 200 µm.
Intravital multichannel confocal microscopy revealed extensive network of microvasculature near the surface of the tumor (Figure 4d). These surface vessels appear terminally branched and they traverse through the tumors directly. Their diameter also falls into the range obtained by the fiber-optic microprobe.
Temporal Changes in PDAC Microvasculature
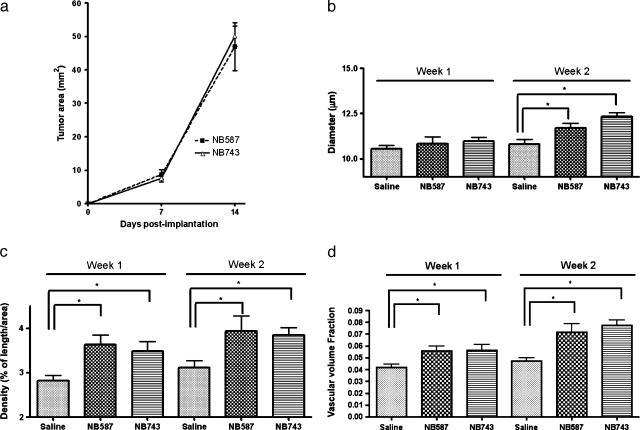
Both NB587 and NB743 primary cell lines expanded to macroscopically visible tumors by week 1 (8.73 ± 3.70 and 9.00 ± 2.00 mm2, respectively). By week 2, all tumors had quadrupled in size (46.94 ± 18.77 and 52.00 ± 15.29 mm2, respectively; Figure 5a).
Figure 5.
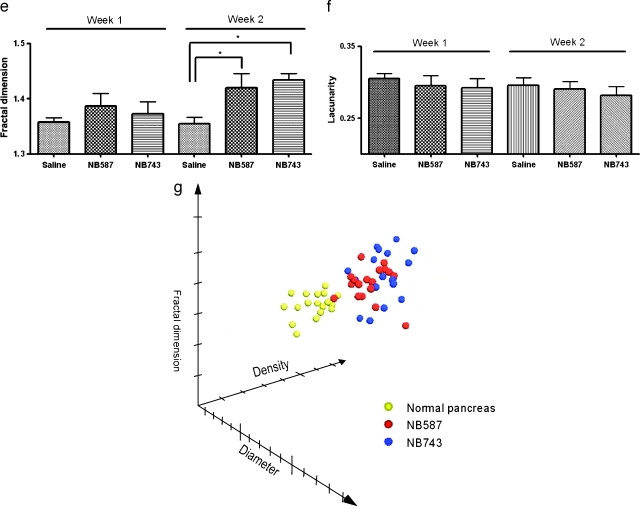
Characterization of microvasculature of pancreatic ductal adenocarcinoma over time. (a) Tumor area from the same set of mice (7 in each, 21 total) was measured at weeks 1 and 2. (b) Both lines of PDAC tumors did not show a significant change in vessel diameter by week 1. However, by week 2, both had significantly larger-diameter vessels compared to the control. (c) Both lines of PDAC tumors showed significant increase in vessel density by week 1; these differences became more accentuated by week 2. (d) Volume fraction also became significantly greater for the tumors by week 1. (e) Fractal dimension did not change by week 1, but became significantly elevated for both lines of tumor. (f) Lacunarity remained unchanged during the 2-week period. (g) A 3D scatterplot showing an increase in vessel density, diameter, and fractal dimension secondary to orthotopic PDAC, represented by an upward shift in all axes from the control group (dashed arrow). The two tumor lines mixed into one cluster. Each point represented one measurement.
By week 1, only vessel density and vascular volume fraction showed significant change compared to the controls receiving saline injection. For NB587 and NB743 tumors, vessel densities were 3.64 ± 0.21% and 3.49 ± 0.22%, respectively, compared to the control group at 2.83 ± 0.11% (Figure 5c). Vascular volume fractions were 5.56 ± 0.42% and 5.60 ± 0.49%, respectively, compared to the control group at 4.19 ± 0.26% (Figure 5d).
Vessel diameter and fractal dimension did not differ significantly from the control group by week 1. Mean vessel diameters were 10.83 ± 0.40 µm for NB587 and 10.98 ± 0.22 µm for NB743, compared to the control group at 10.56 ± 0.20 µm (Figure 5b). Complexities were 1.39 ± 0.02 for NB587 and 1.37 ± 0.02 for NB743 compared to the control at 1.36 ± 0.01 (Figure 5e).
By week 2, all the vascular phenotypes except for lacunarity became significantly different between the control group and the two PDAC tumor lines. Vessel diameters were 11.7 ± 0.29 µm for NB587 and 12.32 ± 0.22 µm for NB743 compared to the control at 10.8 ± 0.28 µm (Figure 5b). Vessel densities were 3.94 ± 0.33% for NB587 and 3.84 ± 0.17% for NB743 compared to the control at 3.11 ± 0.16% (Figure 5c). Vascular volume fractions were higher for NB587 and NB743 compared to the control (7.14 ± 0.72% and 7.73 ± 0.48% vs 4.73 ± 0.27%; Figure 5d). Vascular fractal dimension was 1.42 ± 0.03 for NB587 and 1.43 ± 0.01 for NB743 compared to the control at 1.36 ± 0.01 (Figure 5e). No significant change was found for vascular lacunarity when measured at weeks 1 and 2 (NB587 0.30 ± 0.01 and NB743 0.29 ± 0.01 vs control 0.30 ± 0.01 at week 1, and NB587 0.29 ± 0.01 and NB743 0.28 ± 0.01 vs control 0.30 ± 0.01 at week 2; Figure 5f).
When plotted on the 3D scatterplot according to the vessel diameter, density, and fractal dimension, both tumor lines mixed into one cluster distinct from that of the control group (Figure 5g). The tumor cluster showed an upward shift along the diameter, density, and fractal dimension axes.
Vessel Diameter Histogram
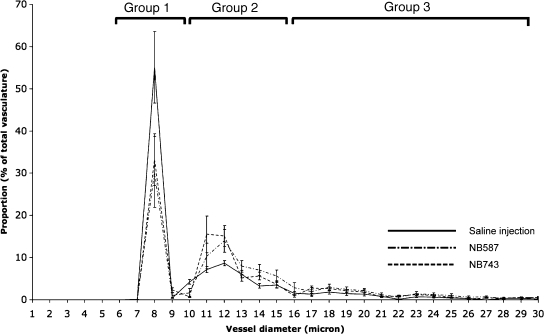
Normal pancreatic surface capillary's diameter histogram formed three peaks (Figure 6). First peak (group 1) consisted of capillaries with diameter from 0 to 10 µm. This group had the highest proportion of the total capillaries (52.33 ± 12.42%). The next peak (group 2) consisted of capillaries with diameter from 10 to 16 µm, and it represented 31.21 ± 2.25% of the total capillaries. The last major peak (group 3) of capillaries consisted of those with diameter from 16 to 26 µm, and it represented 4.13 ± 0.98% of the total capillaries. Tumor capillary diameter histogram also formed three peaks, but their proportion differed significantly from that of the normal pancreatic capillaries. Group 1 capillaries comprised 35.55 ± 6.11% of the total capillaries, whereas groups 2 and 3 comprised 45.15 ± 4.88% and 13.76 ± 0.85% of the total capillaries. Compared to the normal pancreatic capillaries, PDAC surface capillaries represented a statistically significant shift from group 1 to the groups 2 and 3 capillaries. In other words, PDAC surface capillaries were larger and might contribute to the increased volume fraction observed in tumors.
Figure 6.
Vessel diameter distribution and comparison between the normal pancreas and PDAC. This plot shows the pancreatic vasculature separated into three groups, and the PDAC profile showed a significantly different distribution pattern: higher groups 2 and 3 vessels compared to the normal pancreas.
Discussion
The salient findings of the present investigation are as follows: 1) the flexible fiber-optic microprobe can obtain high-resolution realtime images of the microvasculature of abdominal organs in live mice; 2) all of the abdominal organs examined (pancreas, psoas muscles, liver, kidneys, and colon) have a unique set of vascular phenotypes consisted of vessel diameter, density, and fractal dimension; 3) normal pancreatic microvasculature can be categorized into three groups based on their diameter, and PDAC vasculature differs from this normal signature, with the larger-diameter vessels having greater proportion; and 4) temporal progression of an orthotopic mouse model of PDAC can be quantitatively characterized by changes in vascular phenotypes.
Although our mechanistic understanding of oncogenesis has grown tremendously, diagnosis of cancer remains mostly a qualitative process done by interpreting radiologic images and tissue biopsies. Histologic diagnosis remains the most frequently used method to characterize tumor vessels, but it has several drawbacks. First, some vascular conduits in the tumor are not endothelialized, whereas other vessels might not be functional [13]. Hence, staining for endothelial markers may not recapitulate the tumor microcirculation in vivo. With histologic diagnosis, it is difficult to obtain representative perspectives of the tumor circulation because the cut surface dictates the view. In addition, the removal of organs and tumors for histologic diagnosis is often a terminal procedure for small animals, making it impossible to track temporal changes in vasculature on the same subject. The use of window chamber partially remedies these concerns, but the data must be interpreted with caution because the cancer cells are implanted subcutaneously, and not orthotopically. As such, the tumor-host interaction more closely reflects that of metastasis, rather than the growth of primary tumor in situ [14]. In addition, the sustained immobilization of the tissue and the pressure effect from the clamp may lead to unnatural perfusion and tissue response [15].
Intravital microscopy has been made possible in recent years with advances in scanning confocal and two-photon techniques, and these improvements have enabled in vivo detection of orthotopic tumors [16,17]. Whereas these approaches offer submicrometer lateral resolution and the possibility of 3D reconstructions, they suffer from the physical inflexibility inherent in the design of the microscope body and lenses. For instance, the sample should ideally be flat on the surface, a criterion hardly compatible with most organs in situ.
Fiber-optic-based confocal system circumvented this limitation with a long, flexible microprobe that measures only a few millimeters in diameter. The microprobe can pass through a 5-Fr sheath. Its physical design allows for direct manual maneuver from the operator and provides high-resolution image acquisition in real time. We were able to use the system to image the abdominal viscera of nude mice without mortality. No bleeding was observed. Macroscopic bleeding could be seen during the procedure, whereas microscopic bleeding would cause strong signal spreading on the screen as the fluorescent blood pool agent leaked out of the vessels. Neither was observed in any mice. Motion occurred at approximately once every 4 seconds as the anesthetized mouse abruptly contracted its thoracic cage for deep respiration. This motion could be minimized by lifting the pancreas slightly toward the spleen and away from the rib.
Moreover, we were able to repeat the procedure on the same mouse to track temporal changes in vascular phenotype of the pancreatic tumor. This was a remarkable breakthrough for intravital imaging of the pancreas, which is always at risk of pancreatitis. Furthermore, our measurement of vascular diameter was validated with IHC staining with CD-31.
Another novelty of this study is the use of fractal analysis on abdominal organs in situ. Fractal analysis has become increasingly popular as a method to achieve more accurate geometrical analysis of tumors, cells, and microvasculature morphology [18,19]. These irregularly shaped entities defy description by traditional Euclidean geometry that is based on smooth shapes such as the line, plane, and cylinder [5,20]. A widely used parameter in fractal geometry is the fractal dimension that measures the complexity and space-filling property of an object [18]. A planar image of vasculature, for instance, can take on a fractal dimension value between 1 and 2. The more irregularly shaped and tortuous the vasculature, the closer the fractal dimension approaches to 2.
Another fractal parameter is lacunarity that quantifies the heterogeneity of an image [11]. Qualitatively speaking, if every part of an image resembles every other part, lacunarity would approach 0. A lacunarity of 1 is the other extreme. In other words, higher lacunarity denotes greater heterogeneity of the image. Fractal analysis has been widely used to characterize tumor capillary in window chamber model [5], but its use in less invasive and more physiologically relevant models has been limited to retinal and mucosal vasculature [21,22], where noninvasive imaging could be readily performed on the exposed microvasculature using fundoscopy or macro lenses with an on-axis flash.
Using a fast blood vessel segmentation algorithm in conjunction with fractal analysis, we characterized the microvasculature of five different abdominal organs and provided a quantitative basis to complement our knowledge of these organs. For instance, the kidney cortex, rich in the leaky glomeruli, had the largest diameter vessel among the five organs examined. The liver, with its complex sinusoid network, carried the highest density and fractal dimension.
For our imaging system to be clinically translatable, it needs to detect pathologic changes. Tumor capillary is known to be more tortuous and leaky compared to normal vasculature, and angiogenesis is a requirement for tumors to survive. Hence, the tumor microvasculature provides an ideal setting for us to evaluate the fiber-optic imaging system. Pancreatic ductal adenocarcinoma remains one of the most aggressive tumors; in fact, more than 80% of the tumor has metastasized at initial diagnosis [23]. This grim statistic calls for better diagnostic protocols to detect PDAC at earlier stages.
Activating K-ras mutations are found in greater than 90% of latestage PDAC and, along with the inactivation of tumor-suppressor genes Ink4a and Arf, constitutes the signature mutational profile of PDAC [24]. Our orthotopic mouse model for PDAC faithfully recapitulated these genetic features and showed that tumor surface capillary had greater vessel diameter [12]. This observation could be due to both the vessels having wider lumen and/or the vessels being leakier such that the fluorescent blood pool agent was able to perfuse beyond the vascular border. Our vessel diameter distribution histogram revealed a different pattern between PDAC and the normal pancreas. If the observed increase in vessel diameter in PDAC is secondary to elevated permeability, we would not expect to see changes in vascular diameter distribution because an increase in permeability, in theory, would affect all microvasculature. Instead, we found that in PDAC, there was a decrease in small-size vessels with diameter less than 10 µm, with a concomitant increase in the proportion of mid-(10–16 µm) to large-sized (above 16 µm) vessels. Moreover, because we imaged the vasculature immediately after intravenous injection of the fluorescent blood pool agent, there was a very limited time window for significant degrees of imaging probe extravasation to occur. In addition, the imaging probe used here has a large molecular weight and has PEGylated chains that allow it to stay in the vascular space with a half-life of more than 2 hours [25]. This line of thoughts suggests that the detected increase in vessel diameter truly reflected an enlargement of the vessel lumen. The increase in both vessel diameter and density most likely contributed to the observed elevation in vascular density and volume fraction.
Given that our imaging system has a penetration depth of only 15 µm, our observations that the PDAC vasculature is more complex and dense are restricted only to the surface of the tumor. Our imaging microprobe was not designed to cut through soft tissues, and we did not reach to the core of the tumor to study the vascular environment there, although prior data have indicated that the tumor core is mostly avascular and is filled with necrotic debris [26].
The vessels imaged in this work were functional tumor surface capillaries. Multichannel confocal microscopy showed that these vessels were perfused, and hence functional, and that they traversed through the tumors and appeared to be terminally branched as opposed to being a larger conduit vessels with additional branching into smaller capillaries.
Our fractal analysis, for the first time, quantitatively showed that PDAC vasculature was more complex than the normal counterpart. Meanwhile, the heterogeneity of the vasculature remained unchanged, suggesting that no parts of the tumor surface were preferentially receiving more blood supply than others. Of note, we obtained consistent findings on vascular changes from two different PDAC primary cell lines. This suggests that the observed changes in vascular phenotypes were not isolated phenomena associated with a specific cell line, but a reflection of PDAC in general. In other words, these changes were likely due to the genetic alterations of the tumor cells per se, as opposed to confounding epigenetic variables.
Finally, we were able to image and follow the growth of the same tumor during a 2-week period. By week 1, only increases in vascular density and vascular volume fraction were observed. No significant changes in other vascular phenotypes were found, suggesting that most vascular changes occur in the second week, during which the tumor size also increased at least four-fold. This implies that the growth of the microvasculature is the earliest change in PDAC, and it preceded the significant growth of the tumor. This is consistent with the notion that angiogenesis is required before tumors could expand its size beyond a few cubic millimeters. The vascular diameter distribution also did not show changes 1 week after implantation of the tumor cells. Because a difference in the distribution of vascular diameter was observed by week 2, this variation between the normal pancreas and PDAC vasculature could potentially be applied for diagnostic purpose.
We have shown that the fiber-optic confocal setup not only made in vivo vascular imaging of abdominal organs possible, but it also detected changes in orthotopic pancreatic tumor surface capillary 2 weeks after implantation. This clinically approved imaging system, along with the postacquisition phenotype and fractal analyses, could potentially be applied to monitor vascular changes in response to therapy and complement current diagnostic imaging procedures to achieve better disease detection.
Acknowledgments
The authors thank Sacha Loiseau and Aymeric Perchant from Mauna Kea Technologies for providing the Cellvizio instrument, and for their technical and editorial inputs. K.Y.L. is a recipient of the NIH Medical Scientist Training Program grant and the biophysics graduate student training grant at Harvard Medical School.
Footnotes
This work was supported by the National Institutes of Health (NIH) grants PO1CA117969, RO1EB001872, and U24CA092782.
References
- 1.Folkman J, Kalluri R. Cancer without disease. Nature. 2004;427:787. doi: 10.1038/427787a. [DOI] [PubMed] [Google Scholar]
- 2.Laemmel E, Genet M, Le Goualher G, Perchant A, Le Gargasson JF, Vicaut E. Fibered confocal fluorescence microscopy (Cellvizio) facilitates extended imaging in the field of microcirculation: a comparison with intravital microscopy. J Vasc Res. 2004;41:400–411. doi: 10.1159/000081209. [DOI] [PubMed] [Google Scholar]
- 3.Gazit Y, Baish JW, Safabakhsh N, Leunig M, Baxter LT, Jain RK. Fractal characteristics of tumor vascular architecture during tumor growth and regression. Microcirculation. 1997;4:395–402. doi: 10.3109/10739689709146803. [DOI] [PubMed] [Google Scholar]
- 4.Spillman WB, Jr, Robertson JL, Huckle WR, Govindan BS, Meissner KE. Complexity, fractals, disease time, and cancer. Phys Rev E Stat Nonlin Soft Matter Phys. 2004;70:061911–061912. doi: 10.1103/PhysRevE.70.061911. [DOI] [PubMed] [Google Scholar]
- 5.Baish JW, Jain RK. Fractals and cancer. Cancer Res. 2000;60:3683–3688. [PubMed] [Google Scholar]
- 6.Vajkoczy P, Farhadi M, Gaumann A, Heidenreich R, Erber R, Wunder A, Tonn JC, Menger MD, Breier G. Microtumor growth initiates angiogenic sprouting with simultaneous expression of VEGF, VEGF receptor-2, and angiopoietin-2. J Clin Invest. 2002;109:777–785. doi: 10.1172/JCI14105. [DOI] [PMC free article] [PubMed] [Google Scholar]
- 7.Chu GC, Kimmelman AC, Hezel AF, Depinho RA. Stromal biology of pancreatic cancer. J Cell Biochem. 2007;101:887–907. doi: 10.1002/jcb.21209. [DOI] [PubMed] [Google Scholar]
- 8.Hezel AF, Kimmelman AC, Stanger BZ, Bardeesy N, DePinho RA. Genetics and biology of pancreatic ductal adenocarcinoma. Genes Dev. 2006;20:1218–1249. doi: 10.1101/gad.1415606. [DOI] [PubMed] [Google Scholar]
- 9.Krissian K, Malandain G, Ayache N, Luboz V. Model-based detection of tubular structures in 3D images. Comput Vis Image Underst. 2000;80:130–171. [Google Scholar]
- 10.Cross SS. Fractals in pathology. J Pathol. 1997;182:1–8. doi: 10.1002/(SICI)1096-9896(199705)182:1<1::AID-PATH808>3.0.CO;2-B. [DOI] [PubMed] [Google Scholar]
- 11.Allain C, Cloitre M. Characterizing the lacunarity of random and deterministic fractal sets. Phys Rev A. 1991;44:3552–3558. doi: 10.1103/physreva.44.3552. [DOI] [PubMed] [Google Scholar]
- 12.Aguirre AJ, Bardeesy N, Sinha M, Lopez L, Tuveson DA, Horner J, Redston MS, DePinho RA. Activated Kras and Ink4a/Arf deficiency cooperate to produce metastatic pancreatic ductal adenocarcinoma. Genes Dev. 2003;17:3112–3126. doi: 10.1101/gad.1158703. [DOI] [PMC free article] [PubMed] [Google Scholar]
- 13.Di Tomaso E, Capen D, Haskell A, Hart J, Logie JJ, Jain RK, McDonald DM, Jones R, Munn LL. Mosaic tumor vessels: cellular basis and ultrastructure of focal regions lacking endothelial cell markers. Cancer Res. 2005;65:5740–5749. doi: 10.1158/0008-5472.CAN-04-4552. [DOI] [PubMed] [Google Scholar]
- 14.Huang Q, Shan S, Braun RD, Lanzen J, Anyrhambatla G, Kong G, Borelli M, Corry P, Dewhirst MW, Li CY. Noninvasive visualization of tumors in rodent dorsal skin window chambers. Nat Biotechnol. 1999;17:1033–1035. doi: 10.1038/13736. [DOI] [PubMed] [Google Scholar]
- 15.Makale MT, Chen PC, Gough DA. Variants of the tissue-sensor array window chamber. Am J Physiol Heart Circ Physiol. 2005;289:H57–H65. doi: 10.1152/ajpheart.01001.2004. [DOI] [PubMed] [Google Scholar]
- 16.Trehin R, Figueredo JL, Pettet MJ, Weissleder R, Josephson L, Mahmood U. Fluorescent nanoparticle uptake for brain tumor visualization. Neoplasia. 2006;8:302–311. doi: 10.1593/neo.05751. [DOI] [PMC free article] [PubMed] [Google Scholar]
- 17.Alencar H, Mahmood U, Kawano Y, Hirata T, Weissleder R. Novel multiwavelength microscopic scanner for mouse imaging. Neoplasia. 2005;7:977–983. doi: 10.1593/neo.05376. [DOI] [PMC free article] [PubMed] [Google Scholar]
- 18.Roy HK, Lynch HT. Diagnosing Lynch syndrome: is the answer in the mouth? Gut. 2003;52:1665–1667. doi: 10.1136/gut.52.12.1665. [DOI] [PMC free article] [PubMed] [Google Scholar]
- 19.Coffey DS. Self-organization, complexity and chaos: the new biology for medicine. Nat Med. 1998;4:882–885. doi: 10.1038/nm0898-882. [DOI] [PubMed] [Google Scholar]
- 20.Mandelbrot BB. The Fractal Geometry of Nature. New York, NY: WH Freeman; 1982. [Google Scholar]
- 21.De Felice C, Latini G, Bianciardi G, Parrini S, Fadda GM, Marini M, Laurini RN, Kopotic RJ. Abnormal vascular network complexity: a new phenotypic marker in hereditary nonpolyposis colorectal cancer syndrome. Gut. 2003;52:1764–1767. doi: 10.1136/gut.52.12.1764. [DOI] [PMC free article] [PubMed] [Google Scholar]
- 22.Avakian A, Kalina RE, Sage EH, Rambhia AH, Elliott KE, Chuang EL, Clark JI, Hwang JN, Parsons-Wingerter P. Fractal analysis of region-based vascular change in the normal and non-proliferative diabetic retina. Curr Eye Res. 2002;24:274–280. doi: 10.1076/ceyr.24.4.274.8411. [DOI] [PubMed] [Google Scholar]
- 23.Maitra A, Kern SE, Hruban RH. Molecular pathogenesis of pancreatic cancer. Best Pract Res Clin Gastroenterol. 2006;20:211–226. doi: 10.1016/j.bpg.2005.10.002. [DOI] [PubMed] [Google Scholar]
- 24.Rozenblum E, Schutte M, Goggins M, Hahn SA, Panzer S, Zahurak M, Goodman SN, Sohn TA, Hruban RH, Yeo CJ, et al. Tumor-suppressive pathways in pancreatic carcinoma. Cancer Res. 1997;57:1731–1734. [PubMed] [Google Scholar]
- 25.Weissleder R, Tung CH, Mahmood U, Bogdanov A., Jr In vivo imaging of tumors with protease-activated near-infrared fluorescent probes. Nat Biotechnol. 1999;17:375–378. doi: 10.1038/7933. [DOI] [PubMed] [Google Scholar]
- 26.Mahadevan D, Von Hoff DD. Tumor-stroma interactions in pancreatic ductal adenocarcinoma. Mol Cancer Ther. 2007;6:267–283. doi: 10.1158/1535-7163.MCT-06-0686. [DOI] [PubMed] [Google Scholar]


