

Abstract
Protein motions are important to activity, but quantitative relationships between internal dynamics and function are not well understood. The Dbl homology (DH) domain of the protooncoprotein and guanine nucleotide exchange factor Vav1 is autoinhibited through interactions between its catalytic surface and a helix from an N-terminal acidic region. Phosphorylation of the helix relieves autoinhibition. Here we show by NMR spectroscopy that the autoinhibited DH domain exists in equilibrium between a ground state where the active site is blocked by the inhibitory helix, and an excited state where the helix is dissociated. Across a series of mutants that differentially sample these states, catalytic activity of the autoinhibited protein and its rate of phosphorylation are linearly dependent on the population of the excited state. Thus internal dynamics are required for and control both basal activity and the rate of full activation of the autoinhibited DH domain.
Proteins are dynamic entities that transition among numerous conformational states that are important for stability, regulation, and activity1-3. Autoinhibited proteins are striking examples of the interplay between function and dynamics, since these molecules typically require large structural changes to switch between inactive and active states. Autoinhibition is achieved through the binding of a regulatory element to an activity bearing domain located in a distinct region of the same polypeptide chain. These interactions often block binding and/or catalytic activity by directly occluding the active site4,5. Relief of autoinhibition typically requires activators to bind and/or covalently modify sites in the regulatory element that are buried in the autoinhibited structure. Internal dynamics that provide access to such sites likely play important roles in regulation and activation of autoinhibited systems. However, this hypothesis has not yet been tested through quantitative correlations between dynamics and function.
The proto-oncogene product Vav is an autoinhibited protein that relays signals from numerous cell surface receptors, such as the T cell, B cell and Fcγ receptors, to intracellular pathways that control cytoskeletal structure and transcription6-8. Vav is a multidomain protein that contains a Dbl homology (DH) domain, which functions as a guanine nucleotide exchange factor (GEF) for small GTPases in the Rho family9,10. The GEF activity of Vav is negatively regulated, in part, by binding of the DH domain to an adjacent sequence element termed the acidic region (Ac)9-13. In the solution structure of the autoinhibited DH domain, the Ac region forms an amphipathic helix that binds in the GEF active site, blocking access to substrate11. The helix is melted and displaced, concomitant with activation of GEF activity, by phosphorylation of Tyr174, a residue in the Ac region that is completely buried in the DH-helix interface11. Although Tyr174 phosphorylation is slowed in an Ac-DH protein (AD) relative to an isolated Ac peptide (15-fold decrease in kcat/KM for the Src-family kinase Lck14), reactivity of the key regulatory site remains appreciable despite its complete protection from solvent in the autoinhibited structure.
Here we examine the relationship between dynamics, regulation and activity in the AD module of murine Vav1. We demonstrate using NMR spectroscopy that the AD module exists in equilibrium between a ground state where the inhibitory helix is bound to the DH domain, and a weakly populated excited state where the helix is released and unfolded. Using a series of mutants with a wide range of equilibrium constants we show that the rate of Tyr174 phosphorylation by Lck is linearly related to the population of the excited state. Additionally, through GEF assays on representative proteins, we demonstrate that the catalytic activity of the AD protein is also dependent on the population of the excited state. Thus internal dynamics are required for and control both basal activity and the rate of full activation of the autoinhibited DH domain.
Results
The AD module undergoes motions on the μs-ms timescale
Tyr174 is completely buried in helix-DH interface in the solution structure of the AD protein. However, the rate of Tyr174 phosphorylation by the Src-family kinase Lck is appreciable14. These observations indicate that phosphorylation occurs through a distinct conformation in which the tyrosine sidechain is accessible to kinase. This conformation could be an excited state of the AD protein that is appreciably populated through a dynamic equilibrium, and simply captured by the kinase. Alternatively, binding of kinase to the helix-bound ground state could be necessary to alter the energy landscape of the system to favor a Tyr174-accessible conformation. In either scenario, the accessible state could involve large-scale conformational changes in the protein, such as dissociation of the Ac helix, or more local changes that expose the Tyr174 sidechain. To distinguish between these possibilities, we examined quantitative relationships between dynamics, phosphorylation kinetics and catalytic activity of the AD protein.
Conformational dynamics on μs-ms timescales can be readily observed using NMR spectroscopy through measurement of relaxation dispersion, the variation of transverse relaxation rate, R2, with applied magnetic field1,3. To assess dynamics in the AD protein, we measured single quantum 13C relaxation dispersion of valine, leucine and isoleucine (δ only) methyl groups15. Representative dispersion curves are shown in Figures 1a and Supplementary Figure 1. Of 56 methyl resonances that could be analyzed, 25 show a difference (ΔR2) between R2 at the lowest and highest transverse magnetic fields of > 2.0 s-1 (Fig. 1c). These residues are located throughout the inhibitory arm, its binding site on the DH domain and in adjacent regions in the core of the DH domain (Fig. 1b), suggesting the arm is dynamic in the autoinhibited protein. Phosphorylation of AD on Tyr174 (to give pAD) quenched exchange (ΔR2 < 2.0 s-1 or < 5.0 % of non-phosphorylated value) of 11 methyl resonances, eight of which are located in the inhibitory arm or its interface with the DH domain (Figs. 1b, 1c and Supplementary Fig. 2). These data on AD and pAD would be consistent with a hypothesis that in the non-phosphorylated state the arm exists in a conformational equilibrium, and that this equilibrium is strongly biased upon phosphorylation. For the remaining 14 resonances, ΔR2 remains large upon phosphorylation, and increases in 12 cases (Fig. 1c, Supplementary Fig. 1). These 14 resonances are located in the core of the DH domain and on the back side of the protein opposite the active site (Supplementary Fig. 2). The same resonances show nearly identical ΔR2 in a DH protein lacking the Ac arm entirely (ΔA-D, residues 181-375) as in pAD (Supplementary Fig. 3). The different behaviors of these methyl resonances suggest that two dynamic processes with μs-ms timescales exist in the AD protein. One process involves fluctuations of the inhibitory arm; its effects on transverse relaxation are largely eliminated when the helix is displaced from the DH domain and melted by phosphorylation. The second process is intrinsic to the DH domain and persists even when the helix is dissociated. Its structural origins are currently unknown. Importantly, the change in relaxation dispersion for resonances in the second group upon phosphorylation indicates that the two dynamic processes are energetically coupled. That is, the thermodynamic and/or kinetic parameters of the second process are different depending on whether the helix is bound to the DH domain or not. Thus, quantitative analysis of the dispersion data requires modeling a minimum of four states (Supplementary Fig. 4a). This assessment is consistent with our observation that fitting of the dispersion curves of individual resonances with a two-state model results in widely varying kex values (data not shown), a result that is a hallmark of multi-state (>2) equilibria16,17.
Figure 1.
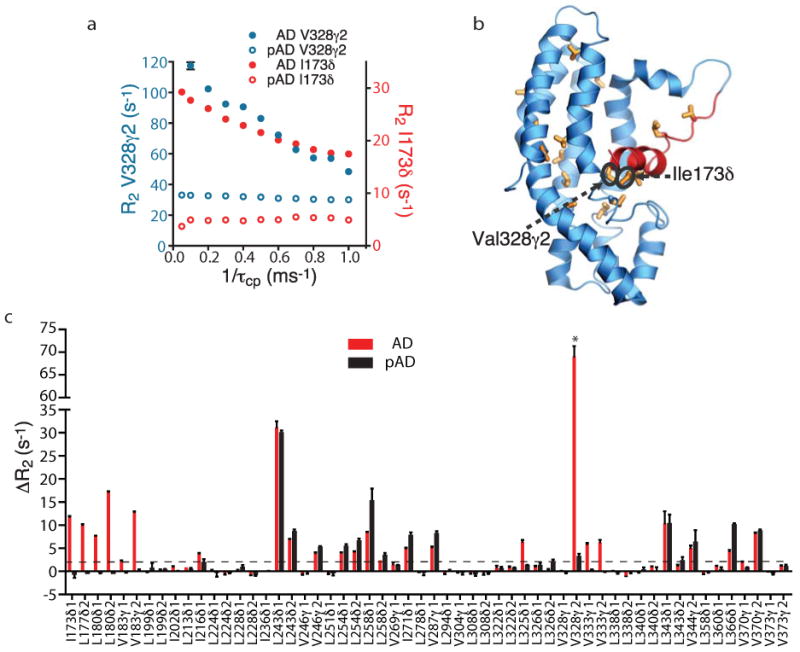
Relaxation dispersion in AD and structural mapping of dynamic residues. (a) Methyl single quantum 13C relaxation dispersion curves of Ile173δ (red), Val328γ2 (blue) for AD (filled circle) and pAD (open circle). Error bars indicate s.d.; where they are not shown, standard deviation is smaller than the symbols. (b) Ribbon diagram of the AD structure (pdbID, 1F5X11). Sticks show methyl containing sidechains with ΔR2 > 2.0 s-1. Structure rendered using Pymol (http://pymol.sourceforge.net/). (c) Relaxation dispersion in AD and pAD. Bars show the differences (ΔR2) in single quantum 13C R2 between the lowest (50 Hz) and highest (1000 Hz) transverse fields of methyl groups in AD (red) and pAD (black). Due to the observation of multiple, thermodynamically coupled dynamic processes in AD (see text and Supplementary Methods), it is not justified to fit CPMG relaxation dispersion data to a simple two-state model in order to obtain Rex, the true relaxation dispersion amplitude. Therefore, ΔR2 is employed throughout the paper to assess relaxation dispersion amplitude of AD proteins.
*: Due to severe line broadening, ΔR2 of Val328γ2 in AD is calculated from R2 values at 100 Hz and 1000 Hz transverse fields collected under identical experimental conditions except that the constant relaxation period is 20 ms rather than 40 ms.
The inhibitory arm fluctuates between bound and free states
In two-state equilibria, quantitative analysis of relaxation dispersion data can yield populations of states, rates of transitions between them and, in favorable circumstances, structural information in the form of chemical shift on the weakly populated state1,3. However, we (see Supplementary Methods) and others17 have shown through simulations that when systems with three or more interconverting states are modeled assuming a two-state approximation, fitted parameters will be appreciably in error in the majority of situations. For this reason, extraction of thermodynamic and kinetic information from our data on AD, where a proper description requires a four-state analysis, is technically challenging and of uncertain feasibility.
Thus, in order to characterize the structural and energetic features of the motions in AD, we adopted an alternative strategy based on the fact that a protein in fast exchange between two states will have NMR chemical shifts that are population weighted averages of the chemical shifts of the pure states. Thus, a series of mutants that differentially sample an equilibrium will have resonances that lie along a straight line between the pure states. Although originally developed for qualitative analysis of a simple two-state system18, this approach is also effective in quantitatively characterizing more complex systems as well (see Derivation 1 in Supplementary Methods). We created a series of AD mutants designed to decrease helix-DH affinity: ADK208E, ADK208S, ADK208A, ADE169K K208A, ADK208V and ADE169K K208V (see Methods). We designed a second set to increase helix-DH affinity through increased electrostatic interactions between the helix and inhibitory arm19: ADE169K and ADE169K E207K. In 1H/13C HSQC spectra, most methyl resonances are similar in the wild type and mutant proteins, suggesting that the mutations did not cause major structural changes to the DH domain. All resonances that do show large chemical shift differences also show large ΔR2. Importantly, the chemical shifts of these dynamic resonances lie on a straight line between the corresponding peaks in ADE169K E207K (designed to have the most stable helix-DH interactions19) and Tyr174-phosphorylated AD (pAD; Figs. 2a, Supplementary Fig. 5). Moreover, for a given protein, the fractional deviation from ADE169K E207K and pAD is very similar for all shifting peaks (Fig. 2a, Supplementary Fig. 5b). This observed colinearity is a strong indicator that the proteins differentially sample a common equilibrium between a structural state resembling ADE169K E207K with the inhibitory helix bound to the DH domain, and another state resembling pAD with the helix dissociated and unfolded.
Figure 2.

AD mutants differentially sample the helix-DH equilibrium. (a) Representative peaks in superimpositions of 1H/13C HSQC spectra of AD mutants. Arrows point in the direction of increasing population of the open state. Peaks are colored: pAD (black), ADK208E (burgundy), ADY174F (light brown), ADK208S (yellow), ADK208A (blue), ADE169K K208A (light green), ADK208V (pink), ADE169K K208V (orange), AD wild type (dark green), ADE169K (cyan), and ADE169K E207K (red). (b) Open populations (po, average ± standard deviation) of AD proteins.
Quantitative analysis of dynamics in the AD protein
Two pieces of data indicate that pAD closely approximates an idealized open state, where the population of the helix bound to the DH domain is unmeasurably small. First, methyl 1H and 13C chemical shifts of ΔA-D are identical within experimental error to those from the DH domain of pAD (chemical shift differences in 13C dimension are smaller than half the digital resolution). The only exceptions to this agreement are peaks from Val183γ1, γ2, which likely are affected by the nearby charged N-terminus in the shorter construct. Second, the relaxation dispersion behavior of DH domain resonances in the ΔA-D and pAD proteins is virtually identical, except for a small, uniform increase in R2,0 (the exchange-independent value of R2) for all resonances in pAD due to the slower overall tumbling time of this larger protein (Supplementary Fig. 3). Coincidence is observed both for resonances that show large ΔR2 in pAD and those that do not. Since relaxation dispersion is highly sensitive, even to small populations (∼1 %) of alternative states, we conclude that pAD is a reasonable mimic of an idealized open state where the helix is fully dissociated from the DH domain.
Related data indicate that the mutant ADE169K E207K closely approximates the opposite idealized state, in which the helix is fully bound to the DH domain. This mutant was designed to maximally increase affinity of the inhibitory helix for the DH domain. It has methyl chemical shifts similar to those of wild type AD, but has dramatically decreased ΔR2 for residues in the inhibitory helix and its DH binding site (average ΔR2 of 2.1 ± 1.9 s-1 relative to 8.1 ± 1.9 s-1 in WT based on the six methyl resonances in the inhibitory helix and the adjacent loop region, Ile173δ, Leu177δ2, Leu180δ1, Leu180δ2, Val183γ1 and Val183γ2). In highly biased equilibria relaxation dispersion is much more sensitive than chemical shift to changes in equilibrium populations (Derivation 2 in Supplementary Methods). Thus, these data indicate that the closed conformation is heavily populated in both AD and ADE169K E207K, but that the latter protein has a more strongly skewed equilibrium. The very small magnitude ΔR2 observed for ADE169K E207K typically indicates an excited state population < ∼1-2 %. Thus, we conclude that the chemical shifts of ADE169K E207K approximate those of an idealized closed state of the system.
With pAD and ADE169K E207K as endpoints in the open-closed equilibrium, we then used the methyl chemical shifts of each mutant to calculate its populations of the open and closed states, po and pc respectively. As shown in Figure 2b, po varied from 0.05 to 1.00 across the series.
Phosphorylation occurs through the excited state
To understand how the equilibrium in the autoinhibited DH domain affects its regulation, we first compared the second order rate constant (kcat/KM) for Lck-mediated phosphorylation of an Ac region peptide (residues 169-190) with that of the most open mutant, ADK208E (po = 1.00). The two substrates possess very similar kinetic parameters (kcat/KM = 9.7 ± 0.7 ×10⁵ min-1 M-1 (peptide) vs. 9.0 ± 0.4 ×10⁵ min-1 M-1 (ADK208E)), indicating that the DH domain does not substantially affect the phosphorylation kinetics in the open conformation. We then performed analogous measurements of all other mutants (Figs. 3, Supplementary Fig. 6). For each construct, phosphorylation rate scales linearly with concentration of kinase (not shown), demonstrating that the opening and closing kinetics of the inhibitory helix are not rate limiting in the reaction. We found that kcat/KM varies over a large range for the different proteins and is linear with po determined by NMR (Fig. 3). Thus, as predicted from the structure of AD, the helix-bound state is phosphorylated very poorly, if at all (intercept ∼ 0 in Fig. 3). Phosphorylation occurs through transient excursions to an excited state where the inhibitory helix is melted and Tyr174 is accessible to kinases. Since the conformational transitions of the helix are rapid, the overall phosphorylation rate is directly proportional to the fractional population of the open state (slope ∼ 1 in Fig. 3).
Figure 3.

Conformational equilibrium of the inhibitory helix controls the rate of AD phosphorylation. For each mutant, the normalized rate constant for phosphorylation {(kcat/KM)mutant/(kcat/KM)K208E} of Tyr174 by Lck is plotted against po, determined by NMR (Fig. 2b). Rate constants are the average of at least two independent measurements; error bars represent standard error. The error bars for po show the standard deviation. Line shows the best linear least squares fit of the data. Data colored as in Figure 2a.
Helix-DH conformational equilibrium controls GEF activity
To understand how the helix-DH dynamics affect catalytic function, we examined the GEF activities of WT and mutant AD proteins. In order to separate effects of the mutations on the helix-DH equilibrium from effects on intrinsic DH activity, in each case we compared the corresponding AD and ΔA-D proteins. Our initial goal was to analyze all of the mutants in Figure 2b. However, we found that most amino acid changes at position 208, other than K208A, severely diminish the intrinsic GEF activity of the DH domain (i.e. in the ΔA-D proteins). Therefore our analysis here is limited to AD, ADY174F and ADK208A. As shown in Figure 4a, the AD, ADY174F and ADK208A proteins have GEF activities that are 7 ± 2 %, 81 ± 19 % and 80 ± 17 % of the corresponding ΔA-D proteins, respectively. These values are consistent with their respective open populations of 9 ± 3 %, 99 ± 3 % and 77 ± 12 % measured by NMR (Fig. 2b). Thus, the helix-DH equilibrium also controls the basal GEF activity of the autoinhibited AD proteins.
Figure 4.

Conformational equilibrium of the inhibitory helix controls GEF activity. (a) Normalized GEF activity of AD proteins. See Methods for measurement and normalization procedures. (b) Fluorescence timecourse during nucleotide exchange on Rac1 (black circle) in the presence of wild type CADPZ (cyan square) or Y174F CADPZ mutant (red triangle).
In full length Vav, the AD element is flanked N-terminally by a Calponin homology (CH) domain and C-terminally by pleckstrin homology (PH) and zinc finger (ZF) domains. Interactions among these additional domains also contribute to suppression of GEF activity, and together with AD form a cooperative element (CADPZ) that controls the catalytic activity of Vav6. As shown in Figure 4b, the Y174F mutation also causes activation of GEF activity in CADPZ. Thus, the effect observed for AD is also valid for the full-length regulatory element.
Discussion
Together the NMR and biochemical data support the model for function and regulation of the AD element of Vav1 shown in Figure 5. The AD protein exists in an equilibrium between a ground state conformation where the inhibitory helix is bound to the DH domain as observed in the solution structure, and an excited state resembling pAD, where the helix is dissociated from the DH domain and melted. In the ground state, Tyr174 is buried in the interface of the inhibitory helix with the active site of the DH domain. These contacts block access of kinases to Tyr174 and of GTPase substrates to the DH active site. In the excited state, Tyr174 and the DH active site are accessible, and phosphorylation rate and GEF catalysis are those of the free Tyr174 site and free DH domain, respectively. A second equilibrium within the DH domain core (not shown in Fig. 5) is coupled to the helix dynamics; work is underway to determine the functional significance, if any, of this additional process. Under the conditions used in the assays here, the conformational transitions of the helix are rapid relative to phosphorylation and GEF catalysis, so for any given protein the measured rates of these activities are proportional to the population of the open state. In wild type AD, the equilibrium is strongly biased toward the helix-bound state (∼90 %, Fig. 2b), and phosphorylation rate and GEF activity are low. Upon phosphorylation, the protein is driven strongly toward the helix-dissociated/melted state where it is fully active. Thus, internal dynamics of the autoinhibited AD module play a central role in dictating its basal catalytic activity and in enabling its full activation by tyrosine kinases.
Figure 5.

Model for function and regulation of the AD module of Vav1. See text for explanation.
Characterization of the open population of the autoinhibited AD protein provides an explanation for a puzzling observation in the literature: the Y174F mutant of full length Vav1 has appreciable transforming activity in vivo, even though it cannot undergo the activating phosphorylation event (and thus should be constitutively inactive)6. Our NMR analysis revealed that ADY174F is 99 % open, versus 9 % for the wild type protein (Fig. 2b). This change corresponds to c.a. 4.2 kcal mol−1 decrease in the free energy of the open/active state relative to the closed/inactive state. Concomitantly, the Y174F mutation increases the relative GEF activity by about 11-fold in AD, and a similar effect was seen with the full-length regulatory element (Fig. 4). Thus our data explain the enhanced activation of Rac and cell transformation induced by this mutation.
A recent EM reconstruction of Vav3 has suggested that the CH domain interacts with the ZF domain and perhaps the Ac region20. These interactions appear to act on the AD element to cooperatively suppress the DH domain, since mutations to Vav that incapacitate or eliminate the CH domain lead to increased GEF activity and resultant cell transformation20-23. Our characterization of the AD element explains the effects of CH perturbations in quantitative terms. In such mutants, even though the core autoinhibitory module (AD) is intact, the inherent thermodynamics of the module produce substantial populations of the active state and probably higher steady state phosphorylation level as well. When such truncated proteins are overexpressed, this population could easily be sufficient to cause transformation. This construction of Vav, with a core active site repression mechanism that is modulated by contacts of other modular elements, is often observed in autoinhibited multi-domain systems24,25. It is clear in many cases that the modulatory interactions both suppress activity in the basal state, and provide mechanisms of integrating multiple inputs to achieve signaling specificity in vivo4,24. However the energetic bases of this modulation have generally not been explored, and could involve changes to the kinetics, thermodynamics and/or structure of the core and its interconverting states. Our characterization of the AD core of Vav1 now sets the stage to understand how the physical properties of this element are modulated by interactions of other domains in the protein to provide the level of suppression and control of DH activity necessary for in vivo function.
Methods
Molecular biology and protein purification
We generated Vav mutants using the Quick Change Mutagenesis Kit (Strategene), and verified them by DNA sequencing. We expressed all AD and ΔA-D proteins (residues 169-375 and 181-375, respectively) from pET11a (Novagen). We generated U-[15N], Ile-[13Cγ2H3]-, Leu-[13CH3,13CH3], Val-[13CH3,13CH3]-labeled proteins through bacterial growth in M9 media containing 1 g per liter of 3-13C pyruvate (added 1 hr before induction)26, and U-[15N,2H], Ile-[13CδH3]-, Leu-[13CH3,12CD3], Val-[13CH3,12CD3]-labeled proteins through bacterial growth in M9 D2O media containing 50 mg per liter 2-keto-3-methyl-d3-3-d1-4-13C-butyrate and 50 mg per liter 4-[13C,1H]-3,3-2H-α-ketobutyrate (added 1 hr before induction)26. Natural abundance proteins for biochemical studies were produced by bacterial growth in LB medium.
The Ac peptide (residues 169-190) and pAD were obtained as described previously14. We purified all AD proteins except ADE169K E207K using ion exchange chromatography and size exclusion chromatography as described by Amarasinghe and Rosen14. We purified the mutant ADE169K E207K and ΔA-D using a phenyl sepharose FF column (GE Healthcare) in 1M (NH4)2SO4, followed by ion exchange chromatography and size exclusion chromatography.
We co-expressed the Vav1 CADPZ proteins (residues 1-584) as maltose binding protein (MBP) fusions in E. coli strain BL21(DE3) with the groES-groEL chaperones (Takara Bio Inc). Chaperone expression was induced at OD600 ∼ 0.25 with 200 mg per liter of arabinose. Expression of the MBP-fusion was induced at OD600 ∼ 0.8 with 0.2 mM IPTG. We purified the CADPZ proteins by successive weak anion exchange, amylose affinity and strong anion exchange chromatographies, Tev protease cleavage to remove MBP, and successive strong anion exchange and gel filtration chromatographies.
Selection of residues for mutagenesis; Hypare analysis
Vav mutants were selected based on analysis of the AD solution structure (pdbID: 1F5X) using the Hypare software package19. This software uses calculated electrostatic interactions to estimate the effect of mutations on the association rate constant between two binding partners of known structure (http://bioportal.weizmann.ac.il/hypareb/main). In order to obtain input for Hypare, we divided the inhibitory helix (residues 169-180) from the DH domain (181-375) of a single model from the AD solution structure ensemble11. Hypare analysis predicted that residues 169, 207 and 208 should have a strong effect on affinity of the Tyr174-containing peptide for the DH domain. We initially screened a total of > 20 single and double mutants by 1H/13C HSQC spectra to assess the effect of the mutations on the overall structure of the DH domain and the inhibitory arm. Mutants displaying global changes judged by large non-uniform chemical shift changes in HSQC spectra were eliminated and the remaining mutants were analyzed biochemically and by NMR.
NMR spectroscopy
NMR samples contained 1.0 mM or lower freshly purified protein in 25 mM phosphate buffer (pH = 7.2) with 50 mM NaCl, 5 mM DTT, 1 mM EDTA, 0.1 % (w/v) NaN3. All NMR experiments were recorded on 600 and 800 MHz Varian Inova spectrometers. The methyl 13C CPMG relaxation dispersion pulse sequence was kindly provided by Dr. Lewis E. Kay15,27,28. All CPMG relaxation dispersion experiments used a constant relaxation period of 40 ms except those collected at 800 MHz and 10 °C, which used a period of 20 ms. For all CPMG spectra, 1530 and 192 complex data points were acquired in the 1H and 13C dimensions, respectively. For all HSQC spectra, 1530 and 512 complex data points were acquired in the 1H and 13C dimensions, respectively. Spectra were acquired with 1H/13C sweep widths of 7000/2200 Hz and 9000/2500 Hz on the 600 MHz and 800 MHz instruments, respectively.
We calculated the average open populations (po) of the AD mutants from chemical shifts measured at 600 MHz and 15 °C. Resonances showing chemical shift differences between AD and pAD that are > 10× digital resolution (> 10 × 0.029 ppm) were analyzed further. We calculated open state population values according to equation 1:
| (1) |
where Ωx, Ωc, and Ωo are the chemical shift of a given resonance in mutant X, ADE169K E207K and pAD, respectively. Mean po values were determined from at least 10 resonances. We eliminated outlier po values (on average 1 per mutant) based on the Grubbs test, performed under a Dataplot session at 95 % confidence level, assuming a Gaussian distribution29.
We calculated the average ΔR2 for ADE169K E207K and AD from the averaged R2 difference between the lowest and the highest effective B1 fields for 6 dynamic resonances in the inhibitory helix (Ile173δ, Leu177δ2, Leu180δ1, Leu180δ2, Val183γ1 and Val183γ2).
Kinase assays
We measured phosphorylation kinetics using a spectrophotometric assay that couples the production of ADP to the oxidation of NADH stoichiometrically14. Reactions were carried out on a Beckmann DU800 spectrophotometer equipped with a Peltier temperature control unit. Samples were preincubated at 15 °C and all reactions were carried out at 15 °C as described previously14. The enzyme reactions contained 50 mM HEPES, pH 7.5, 50 mM NaCl, 10 mM DTT, 2 mM ATP, 10 mM MgCl2, 1 mM phosphoenolpyruvate, 0.2 mM NADH, 89 units per mL pyruvate kinase, 124 units per mL lactate dehydrogenase, and varying concentrations of substrate. All assays contained 20 nM Lck kinase. The Lck kinase construct contained a mutant SH2 domain with reduced capacity for phosphotyrosine binding. Previous experiments in our lab have shown that this construct and the wild type kinase have identical phosphorylation kinetics toward single-site substrates14. Due to sample instability and aggregation at high concentrations, we could measure only kcat/KM for the AD proteins. All kinase reactions were performed at least in duplicate and at least on two different occasions. Kinetic parameters are reported as an average and standard error of these measurements.
GEF assays
We monitored release of N-methylanthraniloyl-GMPPNP (Mant-GMPPNP) from human Rac1 through decreasing Mant fluorescence as described11, except buffers contained 10 % (w/v) glycerol. Protein concentrations used in the assays: Rac1, 100 nM; AD/ΔA-D proteins, 50 μM; CADPZ proteins, 20 μM. We fit fluorescence time courses to a single exponential decay, F(t) = F(0)*exp(-Rt), where F(0) is initial fluorescence intensity and R is decay rate constant. Under conditions used, the decay rate constant, R, scales linearly with GEF concentration (not shown). Normalized GEF activity of each protein was obtained from:
| (2) |
Rcontrol is the rate constant without enzyme and i = AD, ADY174F, ADK208A and open(i) = ΔA-D, ΔA-D, ΔA-DK208A, respectively. Normalization eliminates effects due to the inherently different activities of ΔA-D and ΔA-DK208A owing to the K208A mutation in the GEF active site.
Supplementary Material
Acknowledgments
We thank Carlos Amezcua for technical assistance with NMR data acquisition, Lewis E. Kay for providing the pulse sequences used in this work, L.E.K. and Dmitry M. Korzhnev for assistance with data analysis, Junko Umetani for continuous support with insect cell culture. G.K.A. was supported by a postdoctoral fellowship from the Cancer Research Institute. I.M. was supported by a PhD fellowship from Foundation for Science and Technology (Portugal). This work was supported by NIH grant GM066930 to M.K.R.
Footnotes
Author contributions: MKR conceived of the project. GKA managed the work. PL and IM recognized the 4-state problem. PL conceived of the mutagenesis strategy to solve the 4-state problem. PL and IM generated the AD mutant series. PL and IM performed NMR studies of the AD mutants. GKA developed methods to generate pAD proteins and performed phosphorylation assays on the AD mutants. PL and IM performed GEF assays in the AD mutants. MKR, PL, IM and GKA analyzed the data and wrote the paper.
References
- 1.Kay LE. NMR studies of protein structure and dynamics. J Magn Reson. 2005;173:193–207. doi: 10.1016/j.jmr.2004.11.021. [DOI] [PubMed] [Google Scholar]
- 2.Kern D, Zuiderweg ER. The role of dynamics in allosteric regulation. Curr Opin Struct Biol. 2003;13:748–57. doi: 10.1016/j.sbi.2003.10.008. [DOI] [PubMed] [Google Scholar]
- 3.Palmer AG, 3rd, Kroenke CD, Loria JP. Nuclear magnetic resonance methods for quantifying microsecond-to-millisecond motions in biological macromolecules. Methods Enzymol. 2001;339:204–38. doi: 10.1016/s0076-6879(01)39315-1. [DOI] [PubMed] [Google Scholar]
- 4.Dueber JE, Yeh BJ, Chak K, Lim WA. Reprogramming control of an allosteric signaling switch through modular recombination. Science. 2003;301:1904–8. doi: 10.1126/science.1085945. [DOI] [PubMed] [Google Scholar]
- 5.Pufall MA, Graves BJ. Autoinhibitory domains: modular effectors of cellular regulation. Annu Rev Cell Dev Biol. 2002;18:421–62. doi: 10.1146/annurev.cellbio.18.031502.133614. [DOI] [PubMed] [Google Scholar]
- 6.Bustelo XR. Vav proteins, adaptors and cell signaling. Oncogene. 2001;20:6372–81. doi: 10.1038/sj.onc.1204780. [DOI] [PubMed] [Google Scholar]
- 7.Turner M, Billadeau DD. VAV proteins as signal integrators for multi-subunit immune-recognition receptors. Nat Rev Immunol. 2002;2:476–86. doi: 10.1038/nri840. [DOI] [PubMed] [Google Scholar]
- 8.Tybulewicz VL. Vav-family proteins in T-cell signalling. Curr Opin Immunol. 2005;17:267–74. doi: 10.1016/j.coi.2005.04.003. [DOI] [PubMed] [Google Scholar]
- 9.Abe K, Whitehead IP, O'Bryan JP, Der CJ. Involvement of NH(2)-terminal sequences in the negative regulation of Vav signaling and transforming activity. J Biol Chem. 1999;274:30410–8. doi: 10.1074/jbc.274.43.30410. [DOI] [PubMed] [Google Scholar]
- 10.Heo J, Thapar R, Campbell SL. Recognition and activation of Rho GTPases by Vav1 and Vav2 guanine nucleotide exchange factors. Biochemistry. 2005;44:6573–85. doi: 10.1021/bi047443q. [DOI] [PubMed] [Google Scholar]
- 11.Aghazadeh B, Lowry WE, Huang XY, Rosen MK. Structural basis for relief of autoinhibition of the Dbl homology domain of proto-oncogene Vav by tyrosine phosphorylation. Cell. 2000;102:625–33. doi: 10.1016/s0092-8674(00)00085-4. [DOI] [PubMed] [Google Scholar]
- 12.Lopez-Lago M, Lee H, Cruz C, Movilla N, Bustelo XR. Tyrosine phosphorylation mediates both activation and downmodulation of the biological activity of Vav. Mol Cell Biol. 2000;20:1678–91. doi: 10.1128/mcb.20.5.1678-1691.2000. [DOI] [PMC free article] [PubMed] [Google Scholar]
- 13.Movilla N, Bustelo XR. Biological and regulatory properties of Vav-3, a new member of the Vav family of oncoproteins. Mol Cell Biol. 1999;19:7870–85. doi: 10.1128/mcb.19.11.7870. [DOI] [PMC free article] [PubMed] [Google Scholar]
- 14.Amarasinghe GK, Rosen MK. Acidic region tyrosines provide access points for allosteric activation of the autoinhibited vav1 dbl homology domain. Biochemistry. 2005;44:15257–68. doi: 10.1021/bi051126h. [DOI] [PubMed] [Google Scholar]
- 15.Lundstrom P, Vallurupalli P, Religa TL, Dahlquist FW, Kay LE. A single-quantum methyl 13C-relaxation dispersion experiment with improved sensitivity. J Biomol NMR. 2007;38:79–88. doi: 10.1007/s10858-007-9149-7. [DOI] [PubMed] [Google Scholar]
- 16.Korzhnev DM, et al. Low-populated folding intermediates of Fyn SH3 characterized by relaxation dispersion NMR. Nature. 2004;430:586–90. doi: 10.1038/nature02655. [DOI] [PubMed] [Google Scholar]
- 17.Korzhnev DM, Neudecker P, Mittermaier A, Orekhov VY, Kay LE. Multiple-site exchange in proteins studied with a suite of six NMR relaxation dispersion experiments: an application to the folding of a Fyn SH3 domain mutant. J Am Chem Soc. 2005;127:15602–11. doi: 10.1021/ja054550e. [DOI] [PubMed] [Google Scholar]
- 18.Volkman BF, Lipson D, Wemmer DE, Kern D. Two-state allosteric behavior in a single-domain signaling protein. Science. 2001;291:2429–33. doi: 10.1126/science.291.5512.2429. [DOI] [PubMed] [Google Scholar]
- 19.Selzer T, Albeck S, Schreiber G. Rational design of faster associating and tighter binding protein complexes. Nat Struct Biol. 2000;7:537–41. doi: 10.1038/76744. [DOI] [PubMed] [Google Scholar]
- 20.Llorca O, Arias-Palomo E, Zugaza JL, Bustelo XR. Global conformational rearrangements during the activation of the GDP/GTP exchange factor Vav3. Embo J. 2005;24:1330–40. doi: 10.1038/sj.emboj.7600617. [DOI] [PMC free article] [PubMed] [Google Scholar]
- 21.Katzav S, Martin-Zanca D, Barbacid M. vav, a novel human oncogene derived from a locus ubiquitously expressed in hematopoietic cells. Embo J. 1989;8:2283–90. doi: 10.1002/j.1460-2075.1989.tb08354.x. [DOI] [PMC free article] [PubMed] [Google Scholar]
- 22.Katzav S, Cleveland JL, Heslop HE, Pulido D. Loss of the amino-terminal helix-loop-helix domain of the vav proto-oncogene activates its transforming potential. Mol Cell Biol. 1991;11:1912–20. doi: 10.1128/mcb.11.4.1912. [DOI] [PMC free article] [PubMed] [Google Scholar]
- 23.Zugaza JL, et al. Structural determinants for the biological activity of Vav proteins. J Biol Chem. 2002;277:45377–92. doi: 10.1074/jbc.M208039200. [DOI] [PubMed] [Google Scholar]
- 24.Lim WA. The modular logic of signaling proteins: building allosteric switches from simple binding domains. Curr Opin Struct Biol. 2002;12:61–8. doi: 10.1016/s0959-440x(02)00290-7. [DOI] [PubMed] [Google Scholar]
- 25.Pawson T. Specificity in signal transduction: from phosphotyrosine-SH2 domain interactions to complex cellular systems. Cell. 2004;116:191–203. doi: 10.1016/s0092-8674(03)01077-8. [DOI] [PubMed] [Google Scholar]
- 26.Korzhnev DM, Kloiber K, Kanelis V, Tugarinov V, Kay LE. Probing slow dynamics in high molecular weight proteins by methyl-TROSY NMR spectroscopy: application to a 723-residue enzyme. J Am Chem Soc. 2004;126:3964–73. doi: 10.1021/ja039587i. [DOI] [PubMed] [Google Scholar]
- 27.Tollinger M, Skrynnikov NR, Mulder FA, Forman-Kay JD, Kay LE. Slow dynamics in folded and unfolded states of an SH3 domain. J Am Chem Soc. 2001;123:11341–52. doi: 10.1021/ja011300z. [DOI] [PubMed] [Google Scholar]
- 28.Mulder FA, Hon B, Mittermaier A, Dahlquist FW, Kay LE. Slow internal dynamics in proteins: application of NMR relaxation dispersion spectroscopy to methyl groups in a cavity mutant of T4 lysozyme. J Am Chem Soc. 2002;124:1443–51. doi: 10.1021/ja0119806. [DOI] [PubMed] [Google Scholar]
- 29.Heckert NA. NIST Handbook 148: DATAPLOT Reference Manual. National Institute of Standards and Technology Handbook Series. 2003;1 [Google Scholar]
Associated Data
This section collects any data citations, data availability statements, or supplementary materials included in this article.