

Abstract
Nitric oxide (NO) is a physiologically important molecule that has been implicated in the pathophysiology of diseases associated with chronic inflammation, such as cancer. While the complicated chemistry of NO-mediated genotoxicity has been extensively study in vitro, neither the spectrum of DNA lesions nor their consequences in vivo have been rigorously defined. We have approached this problem by exposing human TK6 lymphoblastoid cells to controlled steady-state concentrations of 1.75 or 0.65 μM NO along with 186 μM O2 in a recently developed reactor that avoids the anomalous gas-phase chemistry of NO and approximates the conditions at sites of inflammation in tissues. The resulting spectrum of nucleobase deamination products was defined using a recently developed liquid chromatography/mass spectrometry (LC/MS) method and the results were correlated with cytotoxicity and apoptosis. A series of control experiments revealed the necessity of using dC and dA deaminase inhibitors to avoid adventitious formation of 2′-deoxyuridine (dU) and 2′-deoxyinosine (dI), respectively, during DNA isolation and processing. Exposure of TK6 cells to 1.75 μM NO and 186 μM O2 for 12 hr (1260 μM•min dose) resulted in 32% loss of cell viability measured immediately after exposure and 87% cytotoxicity after a 24 hr recovery period. The same exposure resulted in 3.5-, 3.8-, and 4.1-fold increases in dX, dI and dU, respectively, to reach the following levels: dX, 7 (±1) per 106 nt; dI, 25 (±2.1) per 106 nt; and dU, 40 (±3.8) per 106 per nt. dO was not detected above the limit of detection of 6 lesions per 107 nt in 50 μg of DNA. A 12 hr exposure to 0.65 μM NO and 190 μM O2 (468 μM•min dose) caused 1.7-, 1.8-, and 2.0-fold increases in dX, dI, and dU, respectively, accompanied by a ∼15 (±3.6) % reduction in cell viability immediately after exposure. Again, dO was not detected. These results reveal modest increases in the steady-state levels of DNA deamination products in cells exposed to relatively cytotoxic levels of NO. This could result from limited nitrosative chemistry in nuclear DNA in cells exposed to NO or high levels of formation balanced by rapid repair of nucleobase deamination lesions in DNA.
INTRODUCTION
While nitric oxide (NO1) is essential as an endogenous regulator of the cardiovascular, nervous and immune systems (1-3), high levels of NO and its derivatives, such as those produced during chronic inflammation, display cytotoxic and mutagenic properties that suggest a causative role for NO in the pathophysiology of diseases such as cancer (4,5). The genotoxicity of NO likely arises from derivatives such as nitrous anhydride (N2O3) and peroxynitrite (ONOO−), which are formed in reactions with molecular oxygen and superoxide, respectively (reviewed in ref. 5). N2O3 is a powerful nitrosating agent that, in addition to reactions with sulfhydryl groups of proteins and with secondary amines to form N-nitrosamines, will react with the primary and heterocyclic amines in DNA bases to create mutagenic deamination products, abasic sites and DNA cross-links (reviewed in ref. 5), as shown in Scheme 1.
Scheme 1.
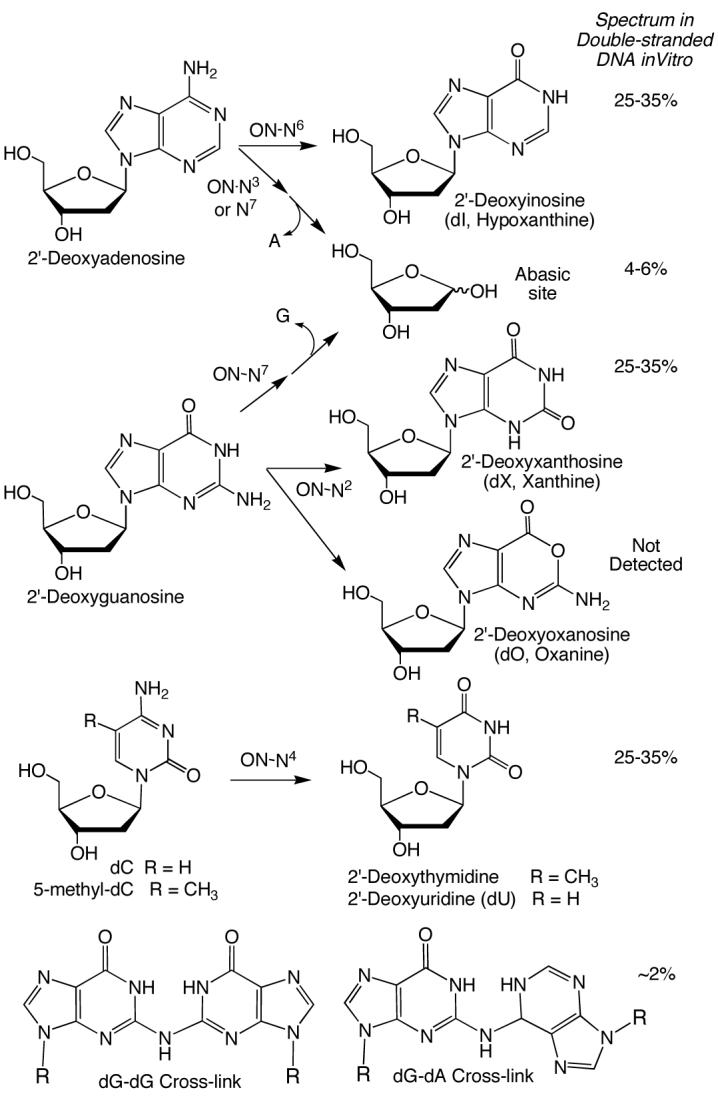
Spectrum of Products of Nucleobase N-Nitrosation Based on Exposure of Isolated DNA to Nitric Oxide2
Among the products arising from nitrosative DNA damage are nucleobase deamination lesions that include xanthine (dX as a 2′-deoxynucleoside), which is derived from guanine, hypoxanthine (2′-deoxyinosine, dI) from adenine, uracil (2′-deoxyuridine, dU) from cytosine, and thymine (2′-deoxythymidine) from 5-methylcytosine, as shown in Scheme 1. Of particular interest is the observation of Suzuki et al. that deamination of guanine by nitrous acid in vitro partitions to form both xanthine and oxanine (2′-deoxyoxanosine; dO; ref. 6), which complicates the decades-old assumption of a simple guaninediazonium ion intermediate common to xanthine and dG-dG cross-links. Suzuki et al. originally described the formation of dO in reactions of nucleosides and DNA with nitrite under acidic (pH < 4) conditions (6,7) and subsequently described the physicochemical and biological properties of dO (e.g., refs. 8-11). While Shuker and coworkers also observed the formation of oxanine base in reactions of 2′-deoxyribonucleotides and calf thymus DNA with millimolar concentrations of the mutagenic nitrosating agent, 1-nitrosoindole-3-acetonitrile, it is possible that the weak buffering used in those studies (0.5 mM Tris) allowed an acidic pH to develop over the hours-long course of the reaction (12,13).
These observations stand in contrast to our inability to detect dO in DNA exposed to NO and O2 under conditions approaching those thought to exist at sites of chronic inflammation (14), as discussed shortly. Using a sensitive LC/MS method and the addition of deaminase inhibitors (14), we quantified dX, dI, dO and dU in DNA that was exposed to steady-state concentrations of 1.3 μM NO and 190 μM O2(calculated steady-state concentrations of 40 fM N2O3 and 3 pM NO2•) in a recently developed reactor (15) that avoids the anomalous gas-phase chemistry of NO; the presence of a headspace containing air in earlier delivery systems alters the chemistry of NO by biasing the formation of N2O3 and allowing formation of N2O4 (16,17). Under these conditions, dX, dI and dU were formed at nearly identical rates (k = 1.2 × 10⁵ M−1s−1) to the extent of ∼ 80 lesions per 106 nt after 12 h exposure to NO in the reactor (14). However, dO was not detected in NO-exposed DNA at a level of > 6 lesions per 108 nt (in 500 μg of DNA), except when the DNA was exposed to nitrite at pH 3.8 (14). In addition to deamination of the exocyclic amines, nitrosation of the heterocyclic amines of dA and dG leads to depurination, as shown in Scheme 1 (e.g., refs. 12,13). The mechanistic basis for depurination apparently involves nitrosation of the N7 of dG and N7 or N3 of dA, with the resulting destabilization of the glycosidic bond in the cationic bases (12,13).
To explain these different observations with dO formation, Glaser and coworkers recently proposed a model (18) based on their extensive computational data and the experimental results discussed above. The model begins with the formation of a diazonium ion at the N2 position of dG. In solvent-exposed environments, such as free nucleosides, nucleotides, and single-stranded DNA, the diazonium ion undergoes nucleophilic displacement by water to form dX or it can lose N2 and undergo pyrimidine ring opening to form a cation that, via bond rotation, leads to dO. In double-stranded DNA, however, base pairing with cytosine is proposed to provide base catalysis for a rapid deprotonation of the dG diazonium ion, with subsequent rapid ring opening to form a cyanoimine that is constrained by the local structure such that addition of water leads to the formation of dX rather than dO. Consistent with this model, we now report that formation of dO is also undetectable in DNA from cells exposed to NO and O2.
While there have been several studies of nucleobase deamination caused by NO-derived species in isolated DNA (16,17,19,20), there have been few quantitative and chemically rigorous studies of nucleobase deamination in intact cells. Studies in macrophages, which generate NO at a rate of ∼6 pmol•s−1 per 106 cells when exposed to lipopolysaccharide or INF-γ in vitro (21), revealed formation of xanthine at levels five-fold higher than controls (22). Other cellular studies have employed artificial delivery of NO. Nguyen et al. delivered what they calculated to be a ∼20 mM total NO to isolated DNA and TK6 cells using a syringe bolus approach and measured dX and dI at very high levels of 3-10 lesions per 103 nt for isolated DNA and 1-3 lesions per 103 nt in cells (20). Finally, several other studies specifically addressing NO-induced DNA damage have employed approaches that did not provide direct identification of the nucleobase deamination products, such as DNA strand breaks in NO-exposed cells (23-25) or in DNA from NO-exposed cells following treatment with DNA glycosylases or alkali (26).
In addition to the assessment of a limited number of deamination products, the major problems with all of these studies is that they employed NO concentrations greatly exceeding conditions that occur at sites of inflammation in vivo, which are thought not to exceed steady-state concentrations of ∼1 μM (21,27,28), and did not employ measures to avoid adventitious nucleobase deamination. NO can be delivered to cells in any of three forms: NO donor compounds, NO gas, or NO produced by either macrophages or endothelial cells after activation. Donor compounds (29), though easy to use, generally do not provide a steady rate of NO release, and their parent compounds and/or their decomposition products may contribute to the observed cellular response. Similar drawbacks exist when using a co-culture system. The observed cellular effects in the target cells are not purely caused by NO, but by a combination of reactive nitrogen and oxygen species formed in the generator cells (22,30). The direct use of NO gas for cell exposure has been made possible by supplying NO continuously through gas permeable polydemethylsiloxane (Silastic) tubing (31,32). The major drawback to this approach is that the oxygen concentration, a critical determinant of NO chemistry, is reduced both by reaction with NO and by cellular respiration. To overcome this problem, Deen and coworkers developed a Silastic membrane-based NO delivery system that provides constant and controllable steady-state concentrations of both NO and O2 (14,15).
To address these problems, we undertook a quantitative study of nucleobase deamination in DNA from cells exposed to physiologically relevant doses of NO and correlated the levels of DNA damage with several indices of cellular toxicity. Of critical importance here was the recognition of significant sources of adventitious nucleobase deamination in cellular DNA and the effective application of means to prevent it.
EXPERIMENTAL PROCEDURES
Materials
All chemicals and reagents were of highest purity available and were used without further purification unless noted otherwise. Pure Ar gas, mixtures of 1% and 10% NO in Ar gas, and a mixture of 50% O2 and 5% CO2 in N2 gas were purchased from BOC Gases (Edison, NJ). The TK6 cell line was provided by Dr. W.G. Thilly (Massachusetts Institute of Technology). RPMI-1640 medium, donor calf serum, glutamine, and penicillin/streptomycin were purchased from BioWhittaker (Walkersville, MD). An ApoAlert annexin V-FITC kit was obtained from Clontech (Palo Alto, CA). Trypan blue (4% in saline), spermidine, spermine, Nonidet P40, 8-hydroxyquinoline, 2'-deoxycytidine, hypoxanthine, aminopterin, thymidine and alkaline phosphatases were obtained from Sigma Aldrich (St. Louis, MO). Coformycin and tetrahydrouridine were purchased from Calibochem (San Diego, CA). Acid phosphatase, nuclease P1, proteinase K, and DNase-free RNase A were purchased from Roche Diagnostic Corporation (Indianapolis, IN). Phosphodiesterase I was obtained from USB (Cleveland, OH). Uniformly 15N,13C-labeled 5'-triphosphate-2'-deoxyguanosine, 5'-triphosphate-2'-deoxyadenosine, and 5'-triphosphate-2'-deoxycytidine were purchased from Silantes (Munich, Germany). Acetonitrile and HPLC-grade water were purchased from Mallinckrodt Baker (Phillipsburg, NJ). Water purified with a Milli-Q system (Millipore Corporation, Bedford, MA) was used for all other applications. Silastic tubing (1.47 mm i.d., 1.96 mm o.d.) was purchased from Dow Corning (Midland, MI).
Instrumental analyses
All HPLC analyses were performed on an Agilent Model 1100 HPLC equipped with a 1040A diode array detector. Mass spectra were recorded with an Agilent Model 1100 electrospray ionization mass spectrometer coupled to an Agilent Model 1100 HPLC with diode array detector. UV spectra were obtained using a Beckman DU640 UV-visible spectrophotometer.
Preparation of uniformly 13C, 15N-labeled dA, dG, and dC
The commercially available U-13C,15N-5'-triphosphate-2'-deoxyuncleotides, including dA, dG and dC, was first dephosphorylated by incubation with alkaline phosphatase (0.5 units/μg nt) at 37 °C for 1 hr in the presence of coformycin (50 μg/mL). The resulting reaction mixture was passed through a Microcon YM-30 column (Millipore Corporation, Bedford, MA) to remove the enzyme, and then resolved on a HAISIL HL C18 reversed phase semi-preparative column (250 × 10 mm, 5 μm particle size, 100 Å pore size; Higgins Analytic Inc, Mountain View, CA) eluted with acetonitrile:H2O (5:95, v:v) at a flow rate of 4.0 mL/min, for the purification of the U-13C,15N-2'-deoxynucleosides. The fractions containing each U-13C,15N-2'-deoxynucleoside were then subjected to a second HPLC purification using a HAISIL HL C18 reversed phase column (250 × 4.6 mm, 5 μm particle size, 100 Å pore size; Higgins Analytic Inc, Mountain View, CA) with isocratic conditions of acetonitrile:H2O (5:95 v:v) at a flow rate of 0.4 mL/min. Individual fractions containing each pure product were dried under vacuum and stored at −80 °C for the future use. The products were characterized by UV spectroscopy, mass spectral analysis (see Figure S1 in Supplementary Information) and HPLC retention relative to defined standards (14,33-35).
Cell culture
TK6 cells were maintained in exponentially growing suspension cultures at 37 °C in a humidified atmosphere of 95% air, 5% CO2 in RPMI-1640 medium supplemented with 10% heat-inactivated donor calf serum, 100 units/mL penicillin, 100 μg/mL streptomycin, and 2 mM L-glutamine. Stock cells were sub-cultured and routinely passaged to maintain an optimal growth density (0.6-1.0 × 10⁶/mL) in 150-mm dishes during experiments. The cell stock used in the present studies was treated with CHAT (10 μM 2'-deoxycytidine, 200 μM hypoxanthine, 0.1 μM aminopterin, and 17.5 μM thymidine) to remove mutant cells, as described previously (36). However, aliquots of cells from this stock were grown for 5 generations prior to studies with NO-induced DNA damage, such that any hypoxanthine incorporated into DNA or RNA during the CHAT treatment would be reduced to background prior to analysis of nucleobase deamination products. This is borne out by our observation of similar levels of dI in human cell lines other than TK6 cells (data not shown).
NO exposure
Cells at a density of 5 × 10⁵ cells/mL in 115 mL of fresh RPMI 1640 medium containing 10% heat-inactivated calf serum were exposed to NO and O2 at 37 °C in the membrane delivery system described before (14). 1% and 10% NO gas were used to achieve the desired steady-state NO concentrations: 0.65 μM and 1.75 μM, respectively. A 50% O2 gas mixture (with 5% CO2) was infused through a second tubing loop to maintain the liquid O2 level at 186 μM. The lengths of tubing for NO and O2 were 7 and 4 cm, respectively. The control cells were treated with Ar gas using the same length of tubing as in the NO experiments. Immediately after exposure to NO or Ar, samples were taken for analysis of cell survival, apoptosis and the formation of nucleobase deamination products. The remaining cells from the 10% NO exposure groups were collected by centrifugation. The cell pellets were resuspended in fresh culture medium, plated at a density of 5 × 10⁵ cells/mL, and grown at 37 °C for 24 hr for analysis of cell survival, apoptosis, and the formation of nucleobase deamination products. Each experiment was performed in triplicate.
Indices of cytotoxicity
NO-induced cell lethality determined by trypan blue exclusion was reported to produce approximately the same survival values as the plating efficiency assay (37). Therefore, we determined cell survival by staining cells with 0.4% trypan blue solution followed by enumeration of those excluding the stain by visible light microscopy. The relative survival was calculated as the ratio of the live cell number in NO experiments to that in Ar controls (expressed as a percentage).
Quantification of apoptosis frequency was accomplished by flow cytometry following annexin VFITC and propidium iodide staining. Positive staining for annexin V was used as a marker of early apoptosis. Aliquots of cell suspensions containing 0.5-1 × 10⁶ cells were placed into 1.5-mL microcentrifuge tubes, washed once with 500 μL annexin binding buffer and resuspended in 200 μL of binding buffer. The cells were stained for 15 min at ambient temperature in the dark with annexin V-FITC at a final concentration of 0.5 μg/mL and propidium iodide at a final concentration of 2.5 μg/mL. The volume was adjusted to 600 μL using ice-cold binding buffer for the flow cytometry analysis with a Becton Dickinson FACScan (excitation light 488 nm) equipped with CellQuest software (San Jose, CA). Annexin V-FITC fluorescence was recorded in FL-1 channel and propidium iodide fluorescence in FL-2. Twenty thousand cells were examined for each sample. Cells stained positive with annexin V only were designated as apoptotic, those staining only with propidium iodide were designated necrotic, those with both propidium iodide and annexin V as necrotic or late apoptotic, and those unstained by either dye as alive and not undergoing measurable apoptosis. Cells treated with argon gas served as controls, and the measured apoptotic fraction was subtracted from that in NO-treated cells.
Isolation of genomic DNA from TK6 cells
Following NO/O2 exposures, the cell pellet (1-2 × 10⁷ cells) was resuspended in 0.4 mL of buffer A (300 mM sucrose, 60 mM KCl, 15 mM NaCl, 60 mM Tris-HCl, pH 8.0, 0.5 mM spermidine, 0.15 mM spermine, 2 mM EDTA, 50 μg/mL coformycin, and 500 μg/mL tetrahydrouridine (THU)). Cells were then lysed by addition of 1% Nonidet P40 with incubation on ice for 5 min. The released nuclei were washed once in buffer A (4500×g, 10 min, 4 °C) and resuspended in 0.2 mL of buffer B (150 mM NaCl and 5 mM EDTA, pH 7.8, 50 μg/mL coformycin, and 500 μg/mL THU) followed by addition of the same volume of buffer C (20 mM Tri-HCl, pH 8.0, 20 mM NaCl, 20 mM EDTA, and 1% sodium dodecyl sulfate) immediately before digestion with proteinase K (450 μg/mL; 37 °C, 2 hr, an additional 250 μg/mL was added, with 1 hr incubation). DNase-free RNase A was then added (150 μg/mL; 37 °C, 1 hr). DNA was purified by successive extraction with buffer-equilibrated phenol (0.1 M Tris-HCl, pH 8.0, 0.1% 8-hydroxyquinoline [w/v]), phenol: chloroform (1:1), and chloroform. DNA was recovered by precipitation in 200 mM NaCl with 2 volumes of 100% ethanol (−20 °C; add slowly to facilitate DNA recovery). The floating DNA filament was recovered by spooling with micropipette tip (or by centrifugation at 5000×g for 30 min) followed by two washes with 70% ethanol, air-drying at ambient temperature and resuspension in 10 mM Tris-EDTA, pH 8.0. The DNA concentration was then determined by UV spectroscopy and the DNA sample was stored at −80 °C.
Quantification of nucleobase deamination in DNA by LC-MS
DNA samples from either NO or Ar treated cells were analyzed for content of nucleobase deamination products by an LC-MS method described elsewhere (14). Briefly, DNA (50 μg) was hydrolyzed by a combination of nuclease P1, phosphodiesterase I, and alkaline phosphatase in the presence of appropriate amounts of isotope-labeled internal standards along with coformycin and THU. The resulting nucleoside mixture was resolved by HPLC and fractions containing each nucleobase deamination product were collected for subsequent LC-MS quantification (14).
Estimation of the adventitious generation of nucleobase deamination products
The potential for adventitious generation of nucleobase deamination products was assessed at different stages of DNA isolation and digestion, as outlined in Scheme 2. To samples of cells, nuclei or DNA containing 50 μg of DNA (150 nmol nt) was added 75 nmol of U-13C,15N-2'-dA, -dG, and -dC (19.95, 21.45 and 17.94 μg respectively) along with 3 pmol of U-15N-dX, -dI and -dU, coformycin (5 μg/mL), and THU (50 μg/mL). At the end of each step in the DNA isolation or hydrolysis process, the nucleobase deamination products in supernatants or hydrolysates were purified by HPLC, followed by LC-MS analysis of fractions presumably containing the U-13C,15N-2'-dI, -dX, -dO and -dU. The LC-MS conditions were as same as those established for DNA analysis with the following molecular ions in positive ion mode (except dU): (a) 13C1015N4-X, m/z 162 and 15N4-X, m/z 157; (b) 13C1015N4-dO, m/z 162 and 15N4-dO, m/z 157; (c) 13C1015N4-dI, m/z 146 and 15N4-dI, m/z 141; and (d) 13C815N2-dU at m/z 237 and 15N2-dU at m/z 229 in negative ion mode.
Scheme 2.
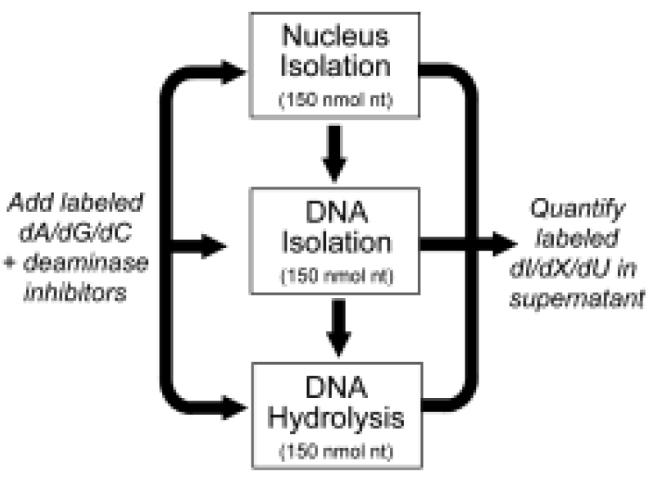
Approach to assessing adventitious nucleobase deamination in cellular DNA.
RESULTS
Effect of NO exposure on cell viability
As an index of NO toxicity for correlation with levels of nucleobase deamination products, we quantified TK6 cell viability by the trypan blue exclusion assay, which provided measurements equivalent to the MTT assay (38), following various NO/O2 exposures. Consistent with previous studies (38), the Silastic tubing-based NO delivery system had little or no effect on cell proliferation, with argon treatment of the TK6 cell line resulting in a growth rate similar to that for untreated plate cultures (doubling time ∼ 20 hr), though a slight decrease in the S-phase cell population was observed (data not shown). These observations suggest that any changes in cell growth with NO-treatment are due mainly to NO and its derivatives.
The dose-response for NO-induced cytotoxicity is shown in Figure 1A. There is a gradual decrease in cell viability apparent both immediately after exposure (68% survival at 12 hr of exposure to a steady-state NO concentration of 1.75 μM) and 24 hr after discontinuing the NO exposure (13% survival). The 2- to 3-fold greater cytotoxicity apparent after 24 hr of recovery is consistent with an apoptotic mechanism of cell death, as shown in Figure 1B. Again, there was a clear dose-response relationship for apoptosis and NO exposure, with a maximum of 14.9% of cells stained with annexin V immediately following a dose of 1260 μM•min (12 hr exposure). The number of stained cells increased to 57.9% after a 24 hr recovery period (Figure 1B). It is thus likely that a significant portion of the cytotoxicity measured immediately after NO exposure represented cells undergoing apoptosis during the hours-long NO exposures.
Figure 1.
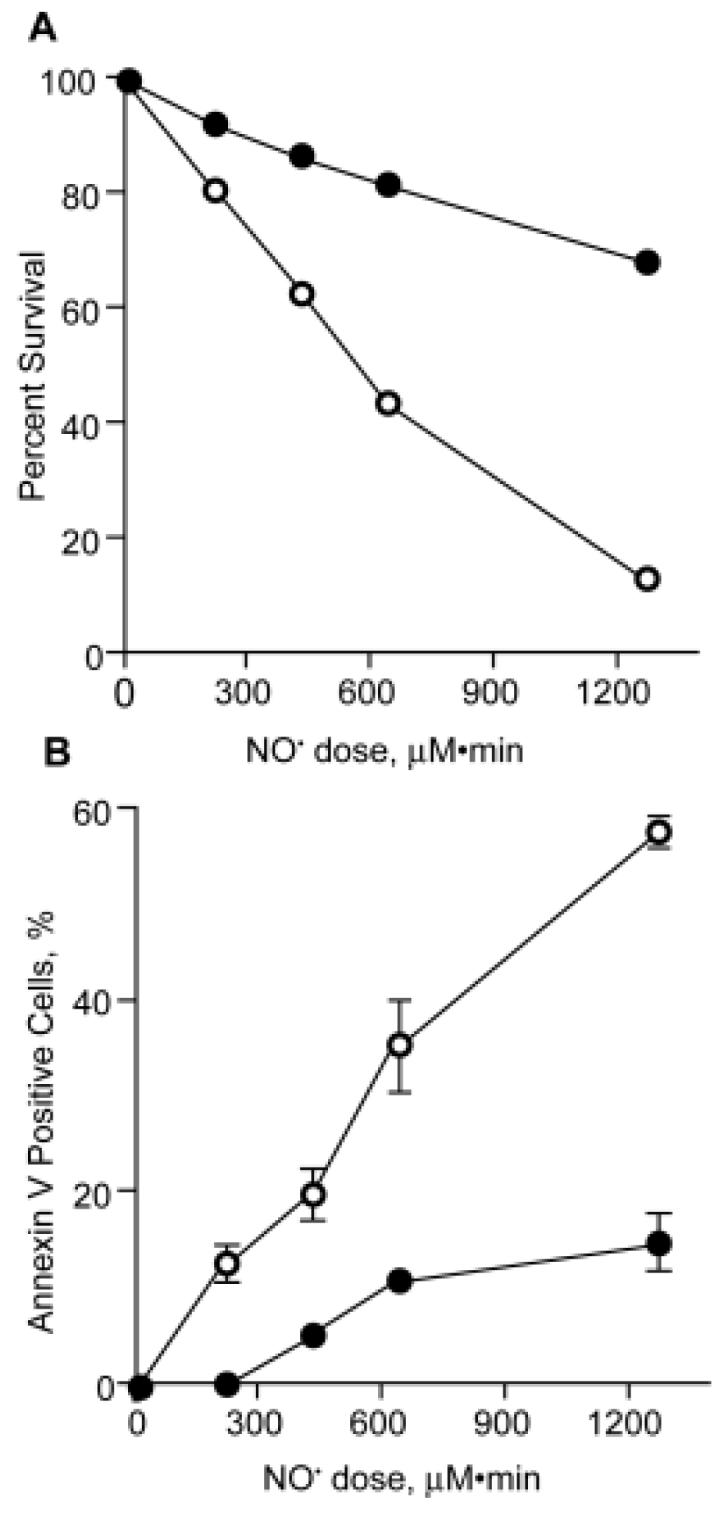
TK6 cell viability (A) and apoptosis (B) as a function of NO dose. Cells were exposed to a steady-state concentration of 1.75 μM NO and 186 μM O2 for varying periods of time and cell viability and apoptosis measured as described in Materials and Methods. Closed circles: toxicity immediately after exposure; open circles: 24 hr post-exposure. These data represent the mean ± SD for 3-5 measurements.
Control of artifacts in the analysis of nucleobase deamination products
An important problem with any quantitative analysis of DNA, RNA or nucleotides is the adventitious formation of nucleobase damage during isolation and processing, such as the adventitious generation and oxidation of 8-oxo-dG (5,39). The quantification of nucleobase deamination products is also subject to artifact as a result of cellular nucleobase deaminases. Our previous studies of nucleobase deamination in isolated DNA exposed to NO/O2 revealed the presence of an adenosine deaminase activity in commercial enzyme preparations (14). This activity was completely controlled by the addition of the adenosine deaminase inhibitor, coformycin (14). Given the presence of cytidine deaminase activity in B-lymphocytes (40) and the fact that TK6 cells are of B-lymphoblastoid origin, we undertook a series of control studies to assess the effect of coformycin and THU, a cytidine deaminase inhibitor, on the adventitious formation of dU and dI arising during DNA processing (Figure 2), exposure of plasmid DNA to TK6 cell extracts (Figure 3) and during DNA isolation from TK6 cells. As shown in Figure 2, incubation of dC with a commercial acid phosphatase preparation revealed the presence of cytidine deaminase activity that was completely inhibited by THU. This is similar to other observations of a contaminating adenosine deaminase activity in commercial stocks of acid phosphatase (14). To a smaller extent, we also observed adventitious formation of dU when plasmid pUC19 was incubated with TK6 cell extract, as shown in Figure 3. This is likely due to a cytidine deaminase enzyme activity, since the background level of dU was reduced by boiling the cell extract (Figure 3A, column 3). The increase in dI in extract-treated plasmid DNA was not statistically significant (Figure 3B). Finally, the addition of THU and coformycin during the DNA isolation process reduced the level of dI from 7.6 (±0.56) per 106 nt to 6.1 (±0.60) per 106 nt and reduced the level of dU from 23 (±2.4) per 106 nt to 13 (±1.7) per 106 nt.
Figure 2.
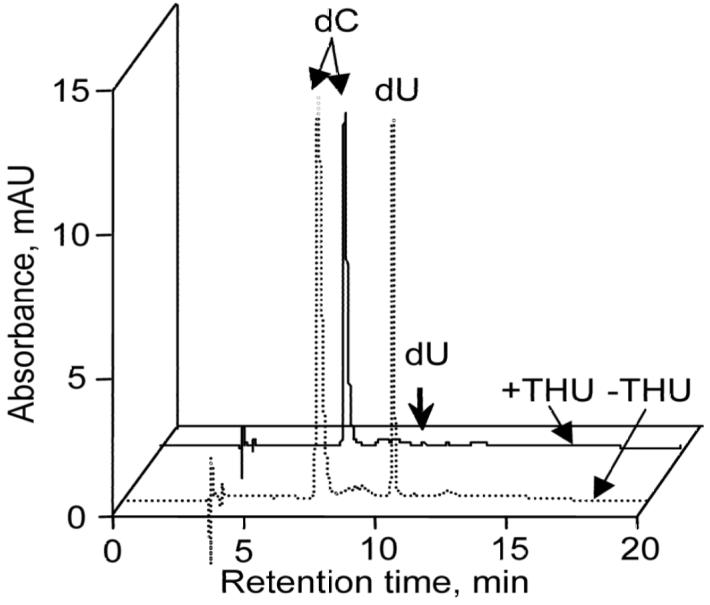
Tetrahydrouridine (THU) inhibition of dC deaminase activity present in acid phosphatase preparations. Dashed line: dC (1 μg) incubated with acid phosphatase (1.5 units); solid line: dC (1 μg) incubated with acidic phosphatase (1.5 unit) in the presence of THU (3 ng).
Figure 3.
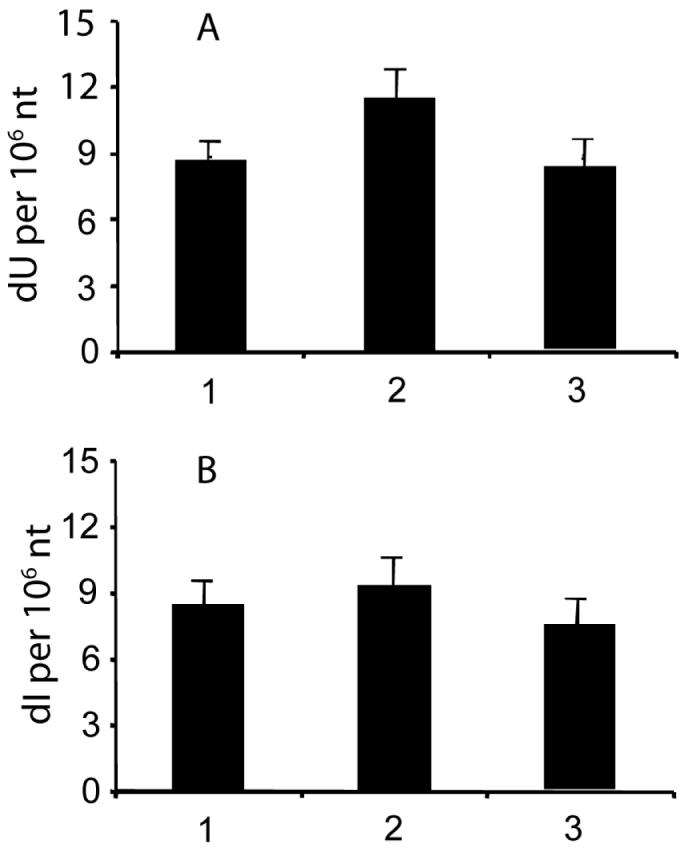
Levels of dU (A) and dI (B) in plasmid pUC19 DNA after incubation with TK6 cell extract. (1) Untreated plasmid; (2) plasmid treated with TK6 cell extract; (3) plasmid treated with boiled TK6 cell extract. Data represent mean ± SD of three independent experiments.
To assess the effectiveness of THU and coformycin during the cell and DNA processing steps, we added uniformly 15N- and 13C-labeled dG, dA and dC at various stages of the DNA isolation process (see Scheme 1) and quantified [15N,13C]-labeled dX, dO, dI and dU. At all stages of nucleus isolation, DNA purification and hydrolysis, there was no detectable formation of dX, dO, dI or dU to the limit of detection of the assay (see Supplemental Information). This indicated that the deaminase inhibitors were effective at reducing adventitious formation of the nucleobase deamination products.
Nucleobase deamination in DNA in TK6 cells exposed to NO and O2
Following exposure of TK6 cells to steady-state levels of NO and O2 of 1.75 μM and 186 μM, respectively, the DNA was isolated in the presence of deaminase inhibitors and the levels of dX, dO, dI and dU quantified by LC/MS. As shown in Figure 4, statistically significant increases in dX, dI and dU were observed at NO doses above 420 μM•min. When measured immediately after a 12 hr exposure (dose of 1230 μM•min), there were 3.5-, 3.8-, and 4.1-fold increases in dX, dI and dU, respectively, which resulted in the following levels: dX, 7 (±1) per 106 nt; dI, 25 (±2.1) per 106 nt; and dU, 40 (±3.8) per 106 per nt. A recovery period of 24 hr produced modest changes in the levels of nucleobase products in DNA, with dI and dU being repaired more efficiently than dX (Figure 4). A 12 hr exposure to lower steady-state levels of 0.65 μM NO and 186 μM O2 (468 μM•min dose) caused 1.7-, 1.8-, and 2.0-fold increases in dX, dI and dU, respectively, which results in the following levels: dX, 3.3 (±1.7) per 106 nt; dI, 10.5 (±1.9) per 106 nt; and dU, 23.1 (±4.0) per 106 nt. This dose of NO (468 μM•min) caused cytotoxicity similar to the same dose delivered at higher steady-state concentrations shown in Figure 1 (∼15% reduction in viability). In all cases, dO was not detected at the 6 dO per 107 nt limit of the assay with 50 μg of DNA.
Figure 4.
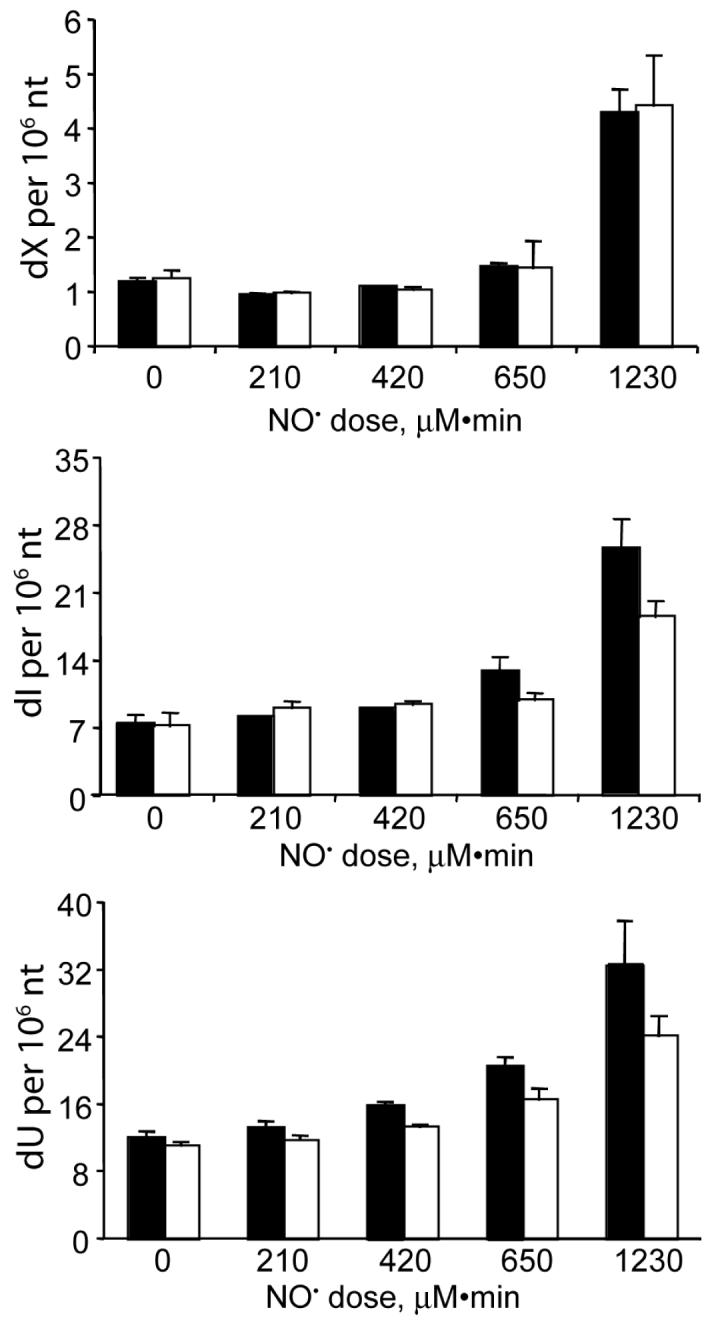
Nucleobase deamination in genomic DNA from TK6 cells exposed to steady-state levels of 1.75 μM NO and 186 μM O2.
DISCUSSION
Toward the goal of understanding the chemical link between chronic inflammation and cancer (5,41,42), we have undertaken studies of the reactions of NO and its oxidizing and nitrosating derivatives with DNA, lipids, proteins and carbohydrates (5). Our previous studies of nitrosative DNA damage in isolated DNA exposed to steady-state concentrations of 1.3 μM NO and 190 μM O2 revealed that dX, dI and dU were formed at similar rates (∼1 × 10⁵ M−1s−1) with undetectable levels of dO and the emergence of abasic sites as a result of nitrosatively-induced depurination (14). We have now moved these studies into cultured cells exposed to DNA under conditions approaching those occurring in chronically inflamed tissues. With careful attention to adventitious formation of nucleobase deamination products in DNA, we have observed modest increases in dX, dI and dU in DNA only at toxic doses of NO.
Adventitious nucleobase deamination
In addition to sensitivity and specificity, one of the major challenges in the development of bioanalytical methods for biomarker quantification is the adventitious generation of the analyte. This has been most apparent for DNA biomarkers with oxidative artifacts that both generate 8-oxo-dG (39) and consume it (5), problems that are avoided by DNA isolation from cells using the sodium iodide chaotropic method (43), manipulation of DNA in Chelex-treated buffers (43), addition of antioxidants such as desferal (43,44) or TEMPO (2,2,6,6-tetramethylperidinoxyl) (45).
In contrast to oxidative artifacts, the risk of adventitious generation of deamination products during DNA isolation and processing has largely been unrecognized. The problem became apparent to us during development of an LC/MS method to quantify DNA deamination products (14), with the observation of extremely high levels of dI arising from dA during enzymatic hydrolysis and dephosphorylation of DNA. That this artifact was due to contaminating dA deaminase activity was confirmed by the absence of dI formation when coformycin, a specific inhibitor of dA/A deaminase, was added during DNA processing steps (14). The presence of dA deaminase activity is not surprising given the role of adenine deaminase in purine metabolism, the adenosine deaminase (ADA) associated with cell surface glycoproteins to regulate adenosine receptor signaling (46), and the adenosine deaminases termed ADARs that mediate RNA editing (47-50). Among the known ADARs, ADAR1 was found to recognize Z-DNA when flanked by B-DNA (51).
In the present studies, we systematically assessed the potential for adventitious deamination reactions at all steps of nucleus isolation, DNA purification and DNA processing for LC/MS analysis. With regard to DNA processing, we observed adventitious formation of dU when acid phosphatase was used for the dephosphorylation of hydrolytically released nucleotides (Figure 2). This activity was effectively inhibited by the addition of tetrahydrouridine (THU), a cytidine deaminase inhibitor previously used as a means of enhancing the therapeutic antitumor efficacy of cytosine arabinoside, 5-chloro-2'-deoxycytidine, and other cytidine analogs through the inhibition of cytidine deaminase (52-54). THU is also an effective inhibitor of the recently discovered activation-induced cytidine deaminase (AID), an enzyme required for three facets of immunoglobulin diversification: class switch recombination, somatic hypermutation, and gene conversion (40,55). The AID protein, which shuttles between the nucleus and cytoplasm (56), was originally thought only to deaminate cytidine in single-stranded DNA (57,58), but has recently been shown to target supercoiled plasmid DNA (59), which could account for our observations in the plasmid incubation experiment (Figure 3).
The results of the studies using cell extracts and the quantification of background levels of nucleobase deamination products demonstrated coformycin- and THU-inhibitable dA and dC deaminase activities (Figures 3 and 4). However, these studies did not reveal the effectiveness of the inhibition. To establish this, we added a set of uniformly 15N- and 13C-labeled deoxynucleosides to solutions used at various stages of nucleus isolation and DNA purification from TK6 cells. Subsequent quantification of labeled dX, dO, dI and dU in supernatants from the various processing steps revealed no detectable formation of any of these deamination products at a level of 6 lesions per 107 nt in 50 μg of DNA (see Supplemental Information; data not shown). This indicates that deaminase inhibition was effectively complete and that changes in the levels of dX, dO, dI and dU are due to non-adventitious mechanisms.
Nucleobase deamination in human cells exposed to NO under biological conditions
The cytotoxicity of NO under biologically relevant conditions of exposure has been the subject of several recent studies that have employed the Silastic tubing-based reactor (24,37,38). The precise control of NO and O2 concentrations permitted by this system revealed a threshold effect for NO-induced cytotoxicity, with significant toxicity observed at NO steady-state concentrations and doses greater than threshold values of ∼0.5 μM steady-state concentration and a total dose of ∼150 μM•min, respectively. The present studies were conducted under conditions in which this threshold effect would not be observed, partly as a result of the relatively high doses of NO required to produce detectable increases in DNA deamination products. Nonetheless, the steady-state NO concentration of 1.75 μM employed here is within the range of 0.1- 10 μM predicted to occur at sites of inflammation in vivo (60,61).
The relationship between cytotoxicity and nucleobase deamination in TK6 cells exposed to NO/O2 is illustrated in Figure 5, which represents a composite of the toxicity and nucleobase deamination data from Figures 1 and 4. The major conclusion to be drawn from this data is that significant increases in the steady-state levels of nucleobase deamination products in DNA occurred only at relatively toxic doses of NO. While there have been several studies of NO-induced DNA damage (reviewed in ref. 5), the only comparable study in terms of NO dose appears to be that of Tannenbaum and coworkers, who observed a ∼6-fold increase in dX to 5 (±0.9) per 106 nt in activated macrophages relative to unstimulated controls (22). The background levels of dX detected in the two studies are quite similar. However, the basis for the difference in the increase in dX is not clear, but it is possible that generation of NO in the stimulated macrophages leads to intracellular, local concentrations that greatly exceed 1-2 μM.
Figure 5.
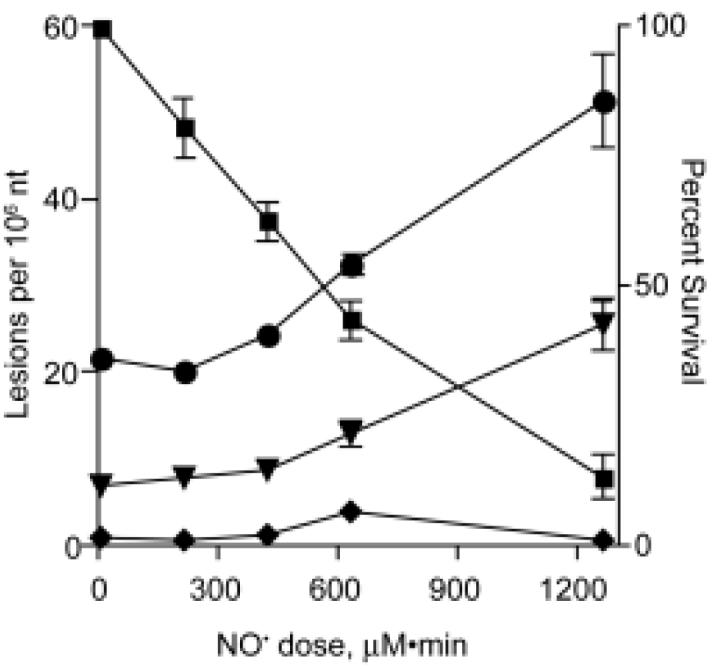
The relationship between cytotoxicity and DNA deamination in TK6 cells exposed to various total doses of NO delivered at a steady-state concentration of 1.75 μM. This figure represents an overlay of data from Figures 1 (percent survival, ■) and 4 (dX, ◆; dI, ▼; dU, ●).
With regard to uracil levels in cellular DNA, Ames and coworkers developed a rigorous GC-MS assay for uracil in cellular DNA that revealed a background level of dU in human mononuclear cells of 4.5 per 106 nt (62). This is about 2-fold lower than our measurements in the TK6 cells (10.5 ± 1.5 per 106 nt). However, TK6 cells may possess higher endogenous levels of dU due to the presence of AID activity in this B-cell-derived cell line (36).
Finally, we were unable to detect dO at a level of >6 lesions per 107 nt in 50 μg of DNA from cells exposed to NO, which is consistent with the results of our studies in purified DNA. While we might not expect to see an increase in dO, which forms at lower levels than dX even under the acidic conditions that are optimal for its formation (14), in light of the relatively small increases in the other nucleobase deamination products, our previous in vitro studies were performed with NO concentrations that produced significant increases in dX, dI and dU (14).
The results obtained with TK6 cells differ substantially from our previous studies of nucleobase deamination in purified DNA exposed to similar doses of NO and O2, in which we observed 8- to 10-fold increases in dX, dI and dU after 12 h exposure to 1.3 μM NO and 190 μM O2 (936 μM•min dose). This compares to 3- to 4-fold increases in these lesions in TK6 cells exposed to higher doses of NO/O2 (1260 μM•min dose). There are several explanations for the observation of smaller increases in the steady-state levels of DNA deamination products in cells exposed to cytotoxic doses of NO. The first involves limited access of NO or its reactive derivatives to DNA in the nucleus due to the biochemical environment of the cell, such as the presence of proteins, glutathione and other nucleophilic or reducing species. Alternatively, there may be significant rates of formation of DNA deamination products in the NO exposed cells that are balanced by efficient repair of the lesions by DNA repair proteins present during the exposure. This model is weakened by the observation of a modest reduction in the levels of dX, dI and dU in DNA from cells allowed to recover for 24 hr (Figure 4), which is consistent with either the limited damage model or with published observations of NO-induced inhibition of DNA repair (63-66). Definitive proof requires the determination of the kinetics of repair of dX, dI or dU in NO exposed cells.
Conclusions
Toward the goal of defining the chemical link between inflammation and cancer, we have quantified (by LC/MS) the formation of DNA deamination products in human TK6 cells exposed to biologically relevant concentrations of NO and O2. These studies revealed the presence of adventitious deamination of DNA during DNA isolation and processing steps of the LC/MS method, a phenomenon that is essentially completely controlled by the deaminase inhibitors THU and coformycin. Following a 12 hour exposure of TK6 cells to steady-state levels of NO and O2 of 1.75 μM and 186 μM that produced a 87% loss of viability (24 hr post-exposure), there were 3- to 4-fold increases in the levels of dX, dI and dU, respectively, with little detectable repair after 24 hr and no detectable dO.
Supplementary Material
ACKNOWLEDGMENTS
The authors wish to thank Dr. Chunqi Li and Ms. Laura Trudel for assistance with cell culture and nitric oxide exposure, and Dr. Koli Taghizadeh and Ms. Elaine Plummer-Turano for their assistance with chromatography and mass spectrometry. This work was supported by a grant from the National Cancer Institute (RO1 CA26735). Flow cytometry studies were performed in the MIT Center for Cancer Research. LC/MS analyses were performed in the Bioanalytical Facilities Core of the Center for Environmental Health Sciences at MIT, which is supported by a Center grant from the NIEHS (PO1 ES002109).
Footnotes
SUPPORTING INFORMATION
Supporting Information available: LC/MS/MS analyses of synthetic U-13C/15N-dG, -dA and –dC; LC/MS/MS analyses of deamination products formed from U-13C/15N-dG, -dA and –dC.
Abbreviations
Bp, base pair; dA, 2′-deoxyadenosine; dC, 2′-deoxycytidine; dG, 2′-deoxyguanosine; dI, 2′-deoxyinosine; dO, 2′-deoxyoxanosine; dU, 2′-deoxyuridine; dX, 2′-deoxyxanthosine; I, hypoxanthine; nt, 2′-deoxynucleotides; LC/MS, liquid chromatography/mass spectrometry; O, oxanine; U, uracil; THU, tetrahydrouridine; X, xanthine.
Data taken from ref. 14.
REFERENCES
- 1.Moncada S, Palmer RM, Higgs EA. Nitric oxide: physiology, pathophysiology, and pharmacology. Pharmacol. Rev. 1991;43:109–142. [PubMed] [Google Scholar]
- 2.Nathan C, Xie QW. Nitric oxide synthases: roles, tolls, and controls. Cell. 1994;78:915–918. doi: 10.1016/0092-8674(94)90266-6. [DOI] [PubMed] [Google Scholar]
- 3.Schmidt HHHW, Walter U. NO at work. Cell. 1994;78:919–925. doi: 10.1016/0092-8674(94)90267-4. [DOI] [PubMed] [Google Scholar]
- 4.Ohshima H. Genetic and epigenetic damage induced by reactive nitrogen species: implications in carcinogenesis. Toxicol. Lett. 2003;140-141:99–104. doi: 10.1016/s0378-4274(02)00506-4. [DOI] [PubMed] [Google Scholar]
- 5.Dedon PC, Tannenbaum SR. Reactive nitrogen species in the chemical biology of inflammation. Arch. Biochem. Biophys. 2004;423:12–22. doi: 10.1016/j.abb.2003.12.017. [DOI] [PubMed] [Google Scholar]
- 6.Suzuki T, Yamaoka R, Nishi M, Ide H, Makino K. Isolation and characterization of a novel product, 2′-deoxyoxanosine, from 2′-deoxyguanosine, oligodeoxynucleotide, and calf thymus DNA treated with nitrous acid and nitric oxide. J. Am. Chem. Soc. 1996;118:2515–2516. [Google Scholar]
- 7.Suzuki T, Kanaori K, Tajima K, Makino K. Mechanism and intermediate for formation of 2′-deoxyoxanosine. Nucleic Acids Symp. Ser. 1997:313–314. [PubMed] [Google Scholar]
- 8.Suzuki T, Matsumura Y, Ide H, Kanaori K, Tajima K, Makino K. Deglycosylation susceptibility and base-pairing stability of 2′-deoxyoxanosine in oligodeoxynucleotide. Biochemistry. 1997;36:8013–8019. doi: 10.1021/bi970166l. [DOI] [PubMed] [Google Scholar]
- 9.Suzuki T, Ide H, Yamada M, Endo N, Kanaori K, Tajima K, Morii T, Makino K. Formation of 2′-deoxyoxanosine from 2′-deoxyguanosine and nitrous acid: mechanism and intermediates. Nucleic Acids Res. 2000;28:544–551. doi: 10.1093/nar/28.2.544. [DOI] [PMC free article] [PubMed] [Google Scholar]
- 10.Nakano T, Asagoshi K, Terato H, Suzuki T, Ide H. Assessment of the genotoxic potential of nitric oxide-induced guanine lesions by in vitro reactions with Escherichia coli DNA polymerase I. Mutagenesis. 2005;20:209–216. doi: 10.1093/mutage/gei027. [DOI] [PubMed] [Google Scholar]
- 11.Nakano T, Terato H, Asagoshi K, Masaoka A, Mukuta M, Ohyama Y, Suzuki T, Makino K, Ide H. DNA-protein cross-link formation mediated by oxanine. A novel genotoxic mechanism of nitric oxide-induced DNA damage. J. Biol. Chem. 2003;278:25264–25272. doi: 10.1074/jbc.M212847200. [DOI] [PubMed] [Google Scholar]
- 12.Lucas LT, Gatehouse D, Jones GDD, Shuker DEG. Characterization of DNA damage at purine residues in oligonucleotides and calf thymus DNA induced by the mutagen 1-nitrosoindole-3-acetonitrile. Chem. Res. Toxicol. 2001;14:158–164. doi: 10.1021/tx000179r. [DOI] [PubMed] [Google Scholar]
- 13.Lucas LT, Gatehouse D, Shuker DE. Efficient nitroso group transfer from N-nitrosoindoles to nucleotides and 2′-deoxyguanosine at physiological pH. A new pathway for N-nitrosocompounds to exert genotoxicity. J. Biol. Chem. 1999;274:18319–18326. doi: 10.1074/jbc.274.26.18319. [DOI] [PubMed] [Google Scholar]
- 14.Dong M, Wang C, Deen WM, Dedon PC. Absence of 2′-deoxyoxanosine and presence of abasic sites in DNA exposed to nitric oxide at controlled physiological concentrations. Chem. Res. Toxicol. 2003;16:1044–1055. doi: 10.1021/tx034046s. [DOI] [PubMed] [Google Scholar]
- 15.Wang C, Deen WM. Nitric oxide delivery system for cell culture studies. Ann. Biomed. Eng. 2003;31:65–79. doi: 10.1114/1.1533072. [DOI] [PubMed] [Google Scholar]
- 16.Mirvish SS. Formation of N-nitroso compounds: chemistry, kinetics, and in vivo occurrence. Toxicol. Appl. Pharmacol. 1975;31:325–351. doi: 10.1016/0041-008x(75)90255-0. [DOI] [PubMed] [Google Scholar]
- 17.Challis BC, Shuker DEG, Fine DH, Goff EU, Hoffman GA. Amine nitration and nitrosation by gaseous nitrogen dioxide. In: Bartsch H, O'Neill IK, Castegnaro M, Okada M, editors. N-nitroso Compounds: Occurrence and Biological Effects. IARC; Lyon: 1981. pp. 11–20. [Google Scholar]
- 18.Glaser R, Wu H, Lewis M. Cytosine catalysis of nitrosative guanine deamination and interstrand cross-link formation. J. Am. Chem. Soc. 2005;127:7346–7358. doi: 10.1021/ja0501159. [DOI] [PubMed] [Google Scholar]
- 19.Wink DA, Kasprzak KS, Maragos CM, Elespuru RK, Misra M, Dunams TM, Cebula TA, Koch WH, Andrews AW, Allen JS, Keefer LK. DNA deaminating ability and genotoxicity of nitric oxide and its progenitors. Science. 1991;254:1001–1003. doi: 10.1126/science.1948068. [DOI] [PubMed] [Google Scholar]
- 20.Nguyen T, Brunson D, Crespi CL, Penman BW, Wishnok JS, Tannenbaum SR. DNA damage and mutation in human cells exposed to nitric oxide in vitro. Proc. Natl. Acad. Sci. USA. 1992;89:3030–3034. doi: 10.1073/pnas.89.7.3030. [DOI] [PMC free article] [PubMed] [Google Scholar]
- 21.Lewis RS, Tamir S, Tannenbaum SR, Deen WM. Kinetic analysis of the fate of nitric oxide synthesized by macrophages in vitro. J. Biol. Chem. 1995;270:29350–29355. doi: 10.1074/jbc.270.49.29350. [DOI] [PubMed] [Google Scholar]
- 22.deRojas-Walker T, Tamir S, Ji H, Wishnok JS, Tannenbaum SR. Nitric oxide induces oxidative damage in addition to deamination in macrophages. Chem. Res. Toxicol. 1995;8:473–477. doi: 10.1021/tx00045a020. [DOI] [PubMed] [Google Scholar]
- 23.Burney S, Tamir S, Gal A, Tannenbaum SR. A mechanistic analysis of nitric oxide-induced cellular toxicity. Nitric Oxide. 1997;1:130–144. doi: 10.1006/niox.1996.0114. [DOI] [PubMed] [Google Scholar]
- 24.Li CQ, Trudel LJ, Wogan GN. Nitric oxide-induced genotoxicity, mitochondrial damage, and apoptosis in human lymphoblastoid cells expressing wild-type and mutant p53. Proc. Natl. Acad. Sci. U S A. 2002;99:10364–10369. doi: 10.1073/pnas.162356399. [DOI] [PMC free article] [PubMed] [Google Scholar]
- 25.Delaney CA, Eizirik DL. Intracellular targets for nitric oxide toxicity to pancreatic beta-cells. Braz. J. Med. Biol. Res. 1996;29:569–579. [PubMed] [Google Scholar]
- 26.Grishko VI, Druzhyna N, LeDoux SP, Wilson GL. Nitric oxide-induced damage to mtDNA and its subsequent repair. Nucleic Acids Res. 1999;27:4510–4516. doi: 10.1093/nar/27.22.4510. [DOI] [PMC free article] [PubMed] [Google Scholar]
- 27.Miwa M, Stuehr DJ, Marletta MA, Wishnok JS, Tannenbaum SR. Nitrosation of amines by stimulated macrophages. Carcinogenesis. 1987;8:955–958. doi: 10.1093/carcin/8.7.955. [DOI] [PubMed] [Google Scholar]
- 28.Stuehr DJ, Marletta MA. Synthesis of nitrite and nitrate in murine macrophage cell lines. Cancer Res. 1987;47:5590–5594. [PubMed] [Google Scholar]
- 29.Keefer LK, Nims RW, Davies KM, Wink DA. “NONOates” (1-substituted diazen-1-ium-1,2-diolates) as nitric oxide donors: convenient nitric oxide dosage forms. Methods Enzymol. 1996;268:281–293. doi: 10.1016/s0076-6879(96)68030-6. [DOI] [PubMed] [Google Scholar]
- 30.Zhuang JC, Lin D, Lin C, Jethwaney D, Wogan GN. Genotoxicity associated with NO production in macrophages and co-cultured target cells. Free Radic. Biol. Med. 2002;33:94–102. doi: 10.1016/s0891-5849(02)00866-3. [DOI] [PubMed] [Google Scholar]
- 31.Tamir S, Lewis RS, de Rojas Walker T, Deen WM, Wishnok JS, Tannenbaum SR. The influence of delivery rate on the chemistry and biological effects of nitric oxide. Chem. Res. Toxicol. 1993;6:895–899. doi: 10.1021/tx00036a021. [DOI] [PubMed] [Google Scholar]
- 32.Luperchio S, Tamir S, Tannenbaum SR. No-induced oxidative stress and glutathione metabolism in rodent and human cells. Free Radic. Biol. Med. 1996;21:513–519. doi: 10.1016/0891-5849(96)00219-5. [DOI] [PubMed] [Google Scholar]
- 33.Peng S, Padva A, LeBreton PR. Ultraviolet photoelectron studies of biological purines: the valence electronic structure of adenine. Proc. Natl. Acad. Sci. U S A. 1976;73:2966–2968. doi: 10.1073/pnas.73.9.2966. [DOI] [PMC free article] [PubMed] [Google Scholar]
- 34.Dizdaroglu M. Formation of an 8-hydroxyguanine moiety in deoxyribonucleic acid on gamma-irradiation in aqueous solution. Biochemistry. 1985;24:4476–4481. doi: 10.1021/bi00337a032. [DOI] [PubMed] [Google Scholar]
- 35.Trumbore CN, Hyde CT, Hudson RD, Jurman LA, Gehring AG, Masselink JK. Ultraviolet difference spectral studies in the gamma radiolysis of DNA and model compounds. I. Aqueous solutions of DNA bases. Int. J. Radiat. Biol. 1989;56:923–941. doi: 10.1080/09553008914552391. [DOI] [PubMed] [Google Scholar]
- 36.Liber HL, Thilly WG. Mutation assay at the thymidine kinase locus in diploid human lymphoblasts. Mutat. Res. 1982;94:467–485. doi: 10.1016/0027-5107(82)90308-6. [DOI] [PubMed] [Google Scholar]
- 37.Li CQ, Trudel LJ, Wogan GN. Genotoxicity, mitochondrial damage, and apoptosis in human lymphoblastoid cells exposed to peroxynitrite generated from SIN-1. Chem. Res. Toxicol. 2002;15:527–535. doi: 10.1021/tx010171x. [DOI] [PubMed] [Google Scholar]
- 38.Wang C, Trudel LJ, Wogan GN, Deen WM. Thresholds of nitric oxide-mediated toxicity in human lymphoblastoid cells. Chem. Res. Toxicol. 2003;16:1004–1013. doi: 10.1021/tx0340448. [DOI] [PubMed] [Google Scholar]
- 39.Cadet J, D'Ham C, Douki T, Pouget JP, Ravanat JL, Sauvaigo S. Facts and artifacts in the measurement of oxidative base damage to DNA. Free Radic. Res. 1998;29:541–550. doi: 10.1080/10715769800300581. [DOI] [PubMed] [Google Scholar]
- 40.Pham P, Bransteitter R, Goodman MF. Reward versus risk: DNA cytidine deaminases triggering immunity and disease. Biochemistry. 2005;44:2703–2715. doi: 10.1021/bi047481+. [DOI] [PubMed] [Google Scholar]
- 41.Macarthur M, Hold GL, El-Omar EM. Inflammation and Cancer II. Role of chronic inflammation and cytokine gene polymorphisms in the pathogenesis of gastrointestinal malignancy. Am. J. Physiol. Gastrointest. Liver Physiol. 2004;286:G515–G520. doi: 10.1152/ajpgi.00475.2003. [DOI] [PubMed] [Google Scholar]
- 42.Ohshima H, Tatemichi M, Sawa T. Chemical basis of inflammation-induced carcinogenesis. Arch. Biochem. Biophys. 2003;417:3–11. doi: 10.1016/s0003-9861(03)00283-2. [DOI] [PubMed] [Google Scholar]
- 43.Helbock HJ, Beckman KB, Shigenaga MK, Walter PB, Woodall AA, Yeo HC, Ames BN. DNA oxidation matters: the HPLC-electrochemical detection assay of 8-oxodeoxyguanosine and 8-oxoguanine. Proc. Natl. Acad. Sci. USA. 1998;95:288–293. doi: 10.1073/pnas.95.1.288. [DOI] [PMC free article] [PubMed] [Google Scholar]
- 44.Atamna H, Cheung I, Ames BN. A method for detecting abasic sites in living cells: age-dependent changes in base excision repair. Proc. Natl. Acad. Sci. USA. 2000;97:686–691. doi: 10.1073/pnas.97.2.686. [DOI] [PMC free article] [PubMed] [Google Scholar]
- 45.Nakamura J, La DK, Swenberg JA. 5′-nicked apurinic/apyrimidinic sites are resistant to beta-elimination by beta-polymerase and are persistent in human cultured cells after oxidative stress. J. Biol. Chem. 2000;275:5323–5328. doi: 10.1074/jbc.275.8.5323. [DOI] [PubMed] [Google Scholar]
- 46.Gonzalez-Gronow M, Hershfield MS, Arredondo-Vega FX, Pizzo SV. Cell surface adenosine deaminase binds and stimulates plasminogen activation on 1-LN human prostate cancer cells. J. Biol. Chem. 2004;279:20993–20998. doi: 10.1074/jbc.M401023200. [DOI] [PubMed] [Google Scholar]
- 47.Gerber AP, Keller W. RNA editing by base deamination: more enzymes, more targets, new mysteries. Trends Biochem. Sci. 2001;26:376–384. doi: 10.1016/s0968-0004(01)01827-8. [DOI] [PubMed] [Google Scholar]
- 48.Anant S, Davidson NO. Hydrolytic nucleoside and nucleotide deamination, and genetic instability: a possible link between RNA-editing enzymes and cancer? Trends Mol. Med. 2003;9:147–152. doi: 10.1016/s1471-4914(03)00032-7. [DOI] [PubMed] [Google Scholar]
- 49.Gott JM, Emeson RB. Functions and mechanisms of RNA editing. Annu. Rev. Genet. 2000;34:499–531. doi: 10.1146/annurev.genet.34.1.499. [DOI] [PubMed] [Google Scholar]
- 50.Maas S, Rich A. Changing genetic information through RNA editing. Bioessays. 2000;22:790–802. doi: 10.1002/1521-1878(200009)22:9<790::AID-BIES4>3.0.CO;2-0. [DOI] [PubMed] [Google Scholar]
- 51.Kim YG, Lowenhaupt K, Maas S, Herbert A, Schwartz T, Rich A. The zab domain of the human RNA editing enzyme ADAR1 recognizes Z-DNA when surrounded by BDNA. J. Biol. Chem. 2000;275:26828–26833. doi: 10.1074/jbc.M003477200. [DOI] [PubMed] [Google Scholar]
- 52.Hanze AR. Nucleic acids. IV. The catalytic reduction of pyrimidine nucleosides (human liver deaminase inhibitors) J. Am. Chem. Soc. 1967;89:6720–6725. doi: 10.1021/ja01001a057. [DOI] [PubMed] [Google Scholar]
- 53.Greer S, Schwade J, Marion HS. Five-chlorodeoxycytidine and biomodulators of its metabolism result in fifty to eighty percent cures of advanced EMT-6 tumors when used with fractionated radiation. Int. J. Radiat. Oncol. Biol. Phys. 1995;32:1059–1069. doi: 10.1016/0360-3016(94)00596-d. [DOI] [PubMed] [Google Scholar]
- 54.Laliberte J, Marquez VE, Momparler RL. Potent inhibitors for the deamination of cytosine arabinoside and 5-aza-2′-deoxycytidine by human cytidine deaminase. Cancer Chemother. Pharmacol. 1992;30:7–11. doi: 10.1007/BF00686478. [DOI] [PubMed] [Google Scholar]
- 55.Reynaud CA, Aoufouchi S, Faili A, Weill JC. What role for AID: mutator, or assembler of the immunoglobulin mutasome? Nat. Immunol. 2003;4:631–638. doi: 10.1038/ni0703-631. [DOI] [PubMed] [Google Scholar]
- 56.Ito S, Nagaoka H, Shinkura R, Begum N, Muramatsu M, Nakata M, Honjo T. Activation-induced cytidine deaminase shuttles between nucleus and cytoplasm like apolipoprotein B mRNA editing catalytic polypeptide 1. Proc. Natl. Acad. Sci. U S A. 2004;101:1975–1980. doi: 10.1073/pnas.0307335101. [DOI] [PMC free article] [PubMed] [Google Scholar]
- 57.Bransteitter R, Pham P, Scharff MD, Goodman MF. Activation-induced cytidine deaminase deaminates deoxycytidine on single-stranded DNA but requires the action of RNase. Proc. Natl. Acad. Sci. U S A. 2003;100:4102–4107. doi: 10.1073/pnas.0730835100. [DOI] [PMC free article] [PubMed] [Google Scholar]
- 58.Pham P, Bransteitter R, Petruska J, Goodman MF. Processive AID-catalysed cytosine deamination on single-stranded DNA simulates somatic hypermutation. Nature. 2003;424:103–107. doi: 10.1038/nature01760. [DOI] [PubMed] [Google Scholar]
- 59.Shen HM, Storb U. Activation-induced cytidine deaminase (AID) can target both DNA strands when the DNA is supercoiled. Proc. Natl. Acad. Sci. U S A. 2004;101:12997–13002. doi: 10.1073/pnas.0404974101. [DOI] [PMC free article] [PubMed] [Google Scholar]
- 60.Brookes PS, Salinas EP, Darley-Usmar K, Eiserich JP, Freeman BA, Darley-Usmar VM, Anderson PG. Concentration-dependent effects of nitric oxide on mitochondrial permeability transition and cytochrome c release. J. Biol. Chem. 2000;275:20474–20479. doi: 10.1074/jbc.M001077200. [DOI] [PubMed] [Google Scholar]
- 61.Beckman JS, Beckman TW, Chen J, Marshall PA, Freeman BA. Apparent hydroxyl radical production by peroxynitrite: Implications for endothelial injury from nitric oxide and superoxide. Proc. Natl. Acad. Sci. USA. 1990;87:1620–1624. doi: 10.1073/pnas.87.4.1620. [DOI] [PMC free article] [PubMed] [Google Scholar]
- 62.Mashiyama ST, Courtemanche C, Elson-Schwab I, Crott J, Lee BL, Ong CN, Fenech M, Ames BN. Uracil in DNA, determined by an improved assay, is increased when deoxynucleosides are added to folate-deficient cultured human lymphocytes. Anal. Biochem. 2004;330:58–69. doi: 10.1016/j.ab.2004.03.065. [DOI] [PubMed] [Google Scholar]
- 63.Laval F, Wink DA. Inhibition by nitric oxide of the repair protein, O6-methylguanine-DNA-methyltransferase. Carcinogenesis. 1994;15:443–447. doi: 10.1093/carcin/15.3.443. [DOI] [PubMed] [Google Scholar]
- 64.Laval F, Wink DA, Laval J. A discussion of mechanisms of NO genotoxicity: implication of inhibition of DNA repair proteins. Rev Physiol. Biochem. Pharmacol. 1997;131:175–191. doi: 10.1007/3-540-61992-5_8. [DOI] [PubMed] [Google Scholar]
- 65.Liu L, Xu-Welliver M, Kanugula S, Pegg AE. Inactivation and degradation of O(6)-alkylguanine-DNA alkyltransferase after reaction with nitric oxide. Cancer Res. 2002;62:3037–3043. [PubMed] [Google Scholar]
- 66.Jaiswal M, LaRusso NF, Burgart LJ, Gores GJ. Inflammatory cytokines induce DNA damage and inhibit DNA repair in cholangiocarcinoma cells by a nitric oxide-dependent mechanism. Cancer Res. 2000;60:184–190. [PubMed] [Google Scholar]
Associated Data
This section collects any data citations, data availability statements, or supplementary materials included in this article.