Abstract
Resonance Raman spectroscopy offers a mechanism for the non-invasive measurement of in vivo and in situ hemoglobin oxygen saturation (HbO2Sat) in living tissue. Clinically informative signals can be provided by resonance enhancement with deep violet excitation. It is notable that fluorescence does not significantly degrade the quality of the signals. During the controlled hemorrhage and resuscitation of rats, signal intensity ratios of oxy- vs deoxyhemoglobin from sublingual mucosa correlated with co-oximetry values of blood withdrawn from a central venous catheter. The spectroscopic application described here has potential as a non-invasive method for the diagnosis of clinical shock and guidance of its therapy.
INTRODUCTION
Hemoglobin (Hb) oxygen saturation percentages (HbO2Sat) of mixed and central venous blood are important clinical indices of the health of individual organs, and of the adequacy of whole body oxygenation. During clinical shock, oxygen delivery is insufficient to support oxygen consumption of tissue1, 2. Measurements of HbO2Sat should ideally reflect oxygen delivery at the cellular level, both for the clinical diagnosis of shock per se, and to assess the adequacy of its treatment1, 3.
Within clinical settings the non-invasive determination of HbO2Sat of venous blood being returned from critical organ systems remains a challenge. Optical detection can be obscured by competing background signals, such as from myoglobin in muscle tissue, or other absorbing chromophores4–6. The now common procedure known as pulse oximetry is in fact able to discriminate against background absorptions, and is widely employed for the non-invasive determination of the fractional oxygen saturation of arterial blood7, 8. However, arterial HbO2sat does not reflect tissue oxygen utilization in the microcirculation7. Arterial HbO2sat levels of a victim of injury or sepsis can be normal despite severe oxygen deficits elsewhere within the deeper vasculature9.
Raman spectroscopy has demonstrated promise for the analysis of vascularized tissues in situ10. The interference from fluorescence that generally arises with laser excitation at visual wavelengths11 has prompted the development of instrumentation utilizing CCD and Fourier transform detectors with red and near-infrared sensitivity12–14. The 830–850 nm wavelength region has been suggested as an optimal excitation wavelength region, serving as a compromise between long wavelength fluorescence suppression and instrumental efficiency15. It has been demonstrated that oxy- and deoxyhemoglobin can be differentiated by Raman spectroscopy with 860 nm excitation16. However, we have observed that the diminished resonance enhancement afforded by near-infrared excitation results in weak signals that must still contend with the background noise levels of even the quietest photometric detectors. Moreover, substantial incident laser power, 100 mW or more, appears to be required for the detection of hemoglobin signals in the near infrared17–19. The still higher laser power requirements for the longer wavelength 1064 nm Nd:YAG fundamental have been noted to cause problems with sample degradation20. In contrast, we find that clinically informative Raman signals can be obtained via resonance enhancement with low-intensity excitation wavelengths in the deep violet.
EXPERIMENTAL SECTION
Resonance Raman spectra were obtained with a krypton ion laser at 406.7 nm (Spectra-Physics, model 171-01; Mountain View CA), or an external cavity line-narrowed 405 nm diode laser (Sacher Lasertechnik, model TEC 100; Marburg, Germany). Raman excitation of samples was performed by oblique focusing of the laser beam to form a 2 mm oval that conformed to the linear disposition of the spectrometer slit. Incident laser intensities at the sample interrogation point were ≤ 5 mW. The detection system consisted of a liquid-N2 cooled 400 × 1340 CCD detector (Princeton Instruments, Roper Scientific, Trenton NJ), and a 0.5 m spectrograph (Spex model 1870; Horiba/Jobin-Yvon, Edison NJ) set to 100-μm slit width and fitted with an 1800 or 2400 l/mm holographic grating (Jobin-Yvon). Ion laser plasma lines were removed by dispersion of the laser emission with a borosilicate glass prism (Melles Griot, Carlsbad CA), followed by selection of the laser line with a 100-μm slit placed at a focal point in the optical train. Raman scattered light was collected by an f/0.95 50 mm Canon lens. Reflective scattering of incident laser light from the sample was attenuated when necessary with interference (Omega Optical, Brattleboro VT) or holographic (Kaiser Optical, Ann Arbor MI) filters. Signals were accumulated from the target by summing six scans of 5 sec each, allowing for continuous real-time monitoring of signals over a 30 sec interval.
Spectral baseline leveling was performed by a 5th order polynomial routine contained within the GRAMS/AI version 7.0 software package (Thermo-Electron, Waltham MA). Bandshapes were deconvoluted via mathematical peak fitting21 within GRAMS/AI or the peak fitting module of Origin Pro version 7.5 (Origin Lab, Northampton MA). No data smoothing was performed.
Animal experiments were approved in advance by the Virginia Commonwealth University Institutional Animal Care and Use Committee, and have been described previously22, 23. Sprague-Dawley rats were instrumented for measurement of arterial and central venous blood gases by cannulation of the right femoral artery, femoral vein, and jugular vein under sterile conditions. Controlled hemorrhagic shock was induced by sequential removal of blood in increments of 5% total blood volume until 50% of total blood volume was removed or the central venous blood saturation became less than 50%. Animals were hemorrhaged at a rate of 1 ml/min, then resuscitated with equal volumes of 0.9% NaCl solution infused at 1 ml/min, followed by all shed blood, infused at 0.5 ml/min. Raman measurements were obtained in situ at the sublingual surface of the tongue. Simultaneous with Raman measurements, HbO2Sat, as well as total Hb and metHb levels, were determined by sampling of 100-μL aliquots of arterial and central venous blood via co-oximetry (ABL 725, Radiometer America, Westlake, OH).
Human whole blood samples were acquired from a member of our investigative team. Baseline samples (1 ml) were drawn from the radial artery and the antecubital vein, respectively. To assess the effects of progressive tissue deoxygenation on the relative concentrations of oxyHb and deoxyHb in whole blood in real time, blood flow through the brachial artery was restricted briefly by inflating an arm cuff to 150 torr. Venous blood samples were drawn at 1 min. intervals over 5 min. Blood samples were placed in capillary tubes and immediately sealed for analysis by co-oximetry (OSM3; Radiometer Copenhagen, Denmark). For Raman measurements the tubes were gently oscillated longitudinally to preclude local photo-induced effects.
Equine hemoglobin and horse heart myoglobin in the crystalline met-form were obtained from Sigma (St. Louis, MO). Samples were dissolved in 1.0 ml of 0.02 M Tris buffer (pH 7.4, Sigma) at a concentration of 100 μM, and contained in a septum-sealed 3 ml cylindrical quartz spinning Raman cell of our own construction. To form deoxyHb, a solution of metHb was gently swirled under N2 for a few minutes, followed by the addition of a few crystals of sodium dithionite while maintaining a nitrogen atmosphere. OxyHb samples were formed by gently swirling freshly prepared deoxyHb under O2. Resonance Raman band assignments24, 25 for the oxy-, deoxy, and met forms of equine Hb are listed in a table contained within the Supporting Information.
RESULTS AND DISCUSSION
We explored the potential of many external tissue surfaces as monitoring sites for ultimate clinical use. Partially exposed vasculature not covered by a stratum corneum layer can be found in the oral cavity, and has been explored as a promising site for surface capnometry and video microscopy14, 26–31. A readily accessible oral mucosal surface in small animals such as rats is the sublingual surface of the tongue.
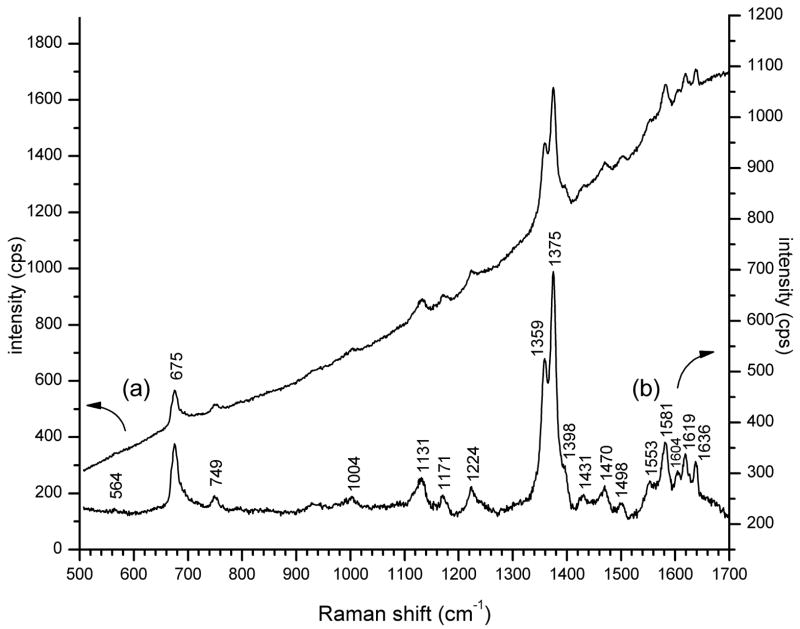
Fluorescence from the complex constituents of blood and tissue has been considered to be a major impediment to applications of resonance Raman with laser excitation at visible wavelengths10. Nonetheless, we have found that deep violet excitation of externally accessible rat mucosal tissue affords strong enhancement of signals from hemoglobin that can surmount fluorescence, without the need for potentially toxic reporter compounds. A modest fluorescence background, rising to longer wavelength, was evident in resonance Raman spectra obtained from the rat sublingual surface (Fig. 1a). Subtraction of the sloping spectral baseline shows that the 5 fluorescence background did not substantially impact the quality of the Raman signals (Fig. 1b). To avoid interference from specular reflection of incident laser light in low light level applications, resonance Raman spectra of heme proteins are obtained preferentially from aqueous solution32. But due to the intense absorption of heme at Soret absorption wavelengths, we found that the moist irregular surfaces of mucosal tissue diminish much stray scattered laser light, resulting in a substantial reduction of dependence on extensive light filtration by tandem coupled spectrometers or optical filters.
Figure 1. Resonance Raman spectrum at 5 mW, 406.7 nm excitation from the rat sublingual surface preliminary to hemorrhage.
(a) Unprocessed spectral baseline (intensity is left axis); (b) Spectral baseline leveled by subtraction of a fitted polynomial (intensity is right axis).
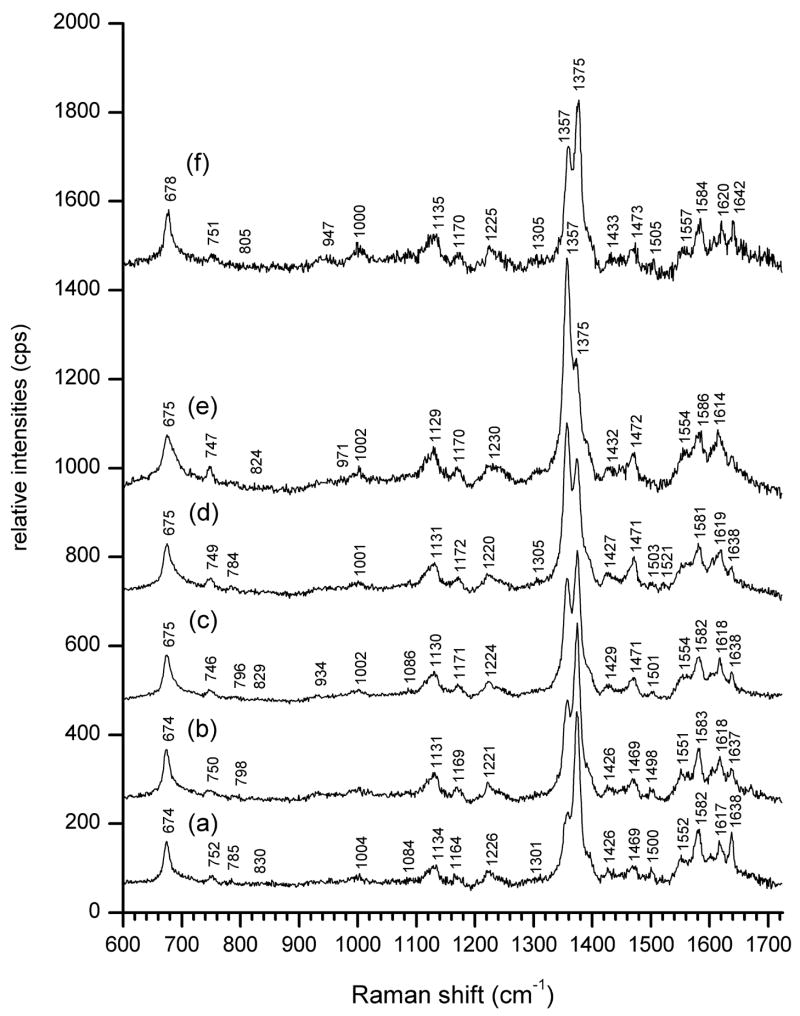
A sequence of resonance Raman spectra obtained with 406.7 nm excitation from the sublingual surface of a rat tongue upon controlled hemorrhage is shown in Figure 2. Among other readily identifiable characteristics, the most prominent are systematic changes in the relative intensities of the bands designated as ν4, known to be sensitive to heme oxygenation24, 25. These appear at 1357 cm−1 for deoxyHb and 1375 cm−1 for oxyHb (Figures. 2a through 2e). Resuscitation by reinfusion of withdrawn blood resulted in recovery of the intensity of the oxyHb signal at 1375 cm−1 relative to that of deoxyHb at 1357 cm−1 (Fig. 2f).
Figure 2. Resonance Raman spectra (5 mw 406.7 nm excitation, 30 sec accumulation) of a rat sublingual surface during controlled hemorrhage and resuscitation. Central venous saturations (ScvO2) were determined by co-oximetry. The traces are offset along the vertical intensity scale for clarity.
(a) Pre-hemorrhage baseline. ScvO2 = 0.811
(b) - (e) Progressive hemorrhage in terms of increments of total blood volume (TBV): (b) 10% TBV (2.24 ml), ScvO2 = 0.789, (c) 20% TBV (4.48 ml), ScvO2 = 0.546, (d) 25 % TBV (5.60 ml), ScvO2 = 0.463, e) 30% TBV (6.72 ml), ScvO2 = 0.379
(f) Resuscitation with 6.6 ml of previously withdrawn blood, ScvO2 = 0.628
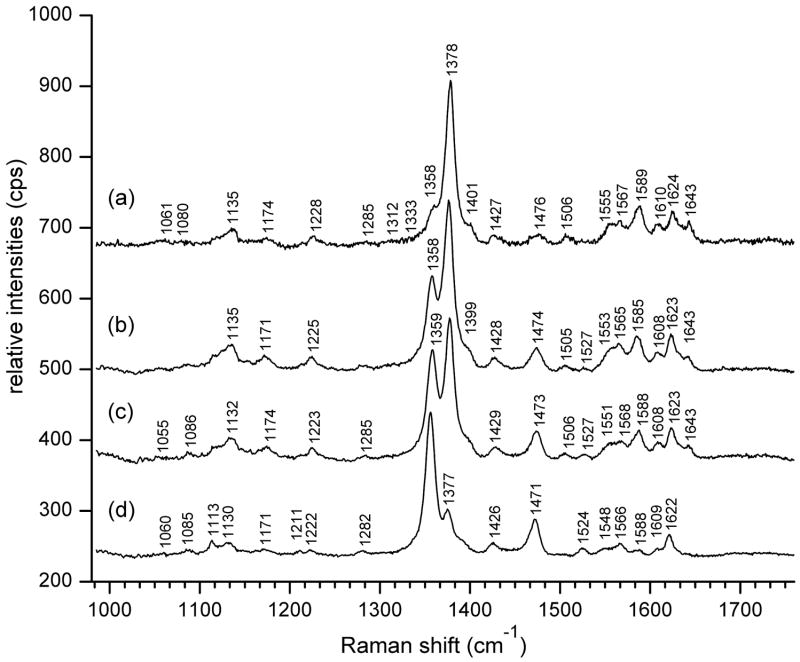
Initial calibration was obtained from resonance Raman spectra of human whole blood (Figure 3) at levels of oxygenation determined by co-oximetry. Maximal relative intensity of the oxyHb ν4 band at 1378 cm−1 occurs for human arterial blood with HbO2Sat of 98.6% (Fig. 3a). Venous blood with declining HbO2Sat levels exhibited a progressive increase of the deoxyHb ν4 band at 1358 cm−1 relative to 1378 cm−1. Values for HbO2Sat determined by Raman were obtained by utilizing the expression:
| [1] |
where Ioxy and Ideoxy are the deconvoluted (vide infra) peak intensities of the respective ν4 bands, and α was an empirically derived parameter that accommodated for differences in scattering intensities of oxy- and deoxyHb at a single excitation wavelength.
Figure 3. Resonance Raman spectra (5 mW, 406.7 nm excitation) of whole human blood at Hb saturation levels determined by co-oximetry.
Arterial blood: (a) HbO2Sat = 98.6%.
Venous blood: (b) HbO2Sat = 77.9%, (c) HbO2Sat = 67.6%, and (d) HbO2Sat = 25.8%.
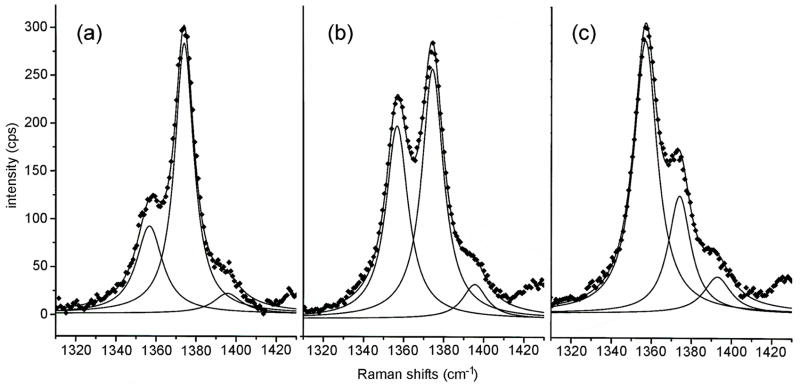
Although the peak positions of the strong ν4 bands of deoxy- and oxyHb are comparatively well separated and resolved, it is clear that observed peak intensities result from the summation of band envelopes in the immediate vicinity. To extract operative HbO2Sat values we deconvoluted the Raman bandshapes by peak fitting procedures. Simulation of the bandshapes as Lorentzians provided deconvoluted bands whose re-summation closely corresponded to the original data points (Fig. 4). From Fig. 4 it is evident that the deconvoluted peak intensities of the respective ν4 bands can vary significantly from direct readings of intensity values at local intensity maxima.
Figure 4.
Spectral deconvolution of representative resonance Raman traces (data from Figure 2).(a) pre-hemorrhage (b) 20% blood volume hemorrhage, and (c) 30% blood volume hemorrhage. The original data points are shown as diamonds ◆ Deconvolutions and their summations are represented by solid lines.
For the in vitro human blood samples (Fig 3) there was a strong positive linear association between HbO2Sat calculated from eqn. [1] using Raman intensities, and via oximetry. The correlation coefficient, r, was 0.99. For in vivo measurements at rat sublingual surfaces, such as in Fig. 2, the correlation, r, corrected for multiple subjects, was 0.7923. A reason for the lower correlations can at least in part be attributed to catheter placement and a resulting bias in the relative oxygenation levels of blood from discrepancies in sampling site. With a catheter tip placed close to the superior vena cava, the blood sampled at this site will be returning from the brain and will exhibit higher HbO2Sat than if blood is sampled in closer proximity to the inferior vena cava, which will be more representative of central venous saturations. The most appropriate sampling site would have been the lingual vein, but sampling from this vessel in a small animal such as a rat would have compromised the local tissue integrity.
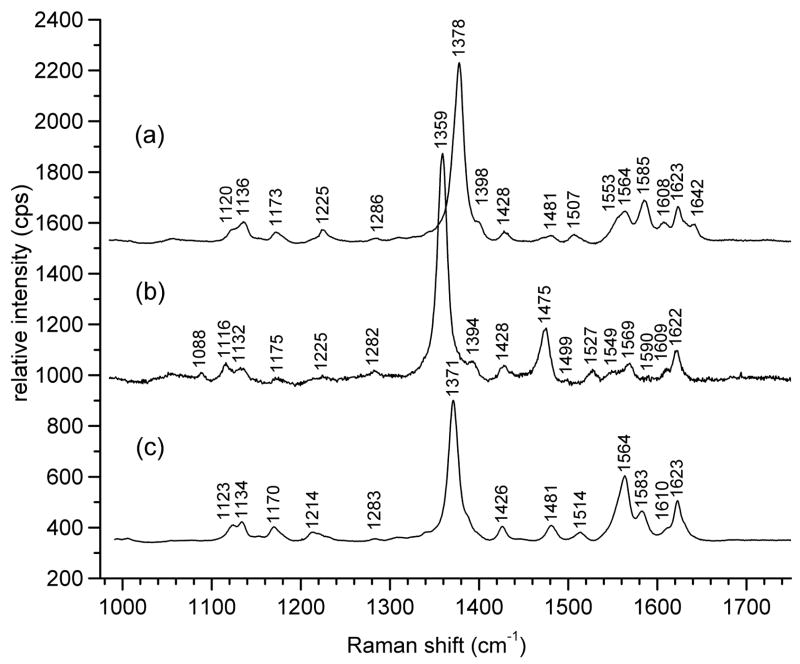
Though the deoxy- and oxyHb ν4 bands are spaced 20 cm−1 apart, a form of hemoglobin known as met-hemoglobin (metHb) exhibits a third ν4 frequency, at 1371 cm−1, shown in Fig. 5c for equine hemoglobin, that is comparatively close to the 1378 cm−1 frequency for oxyHb (Fig. 5a), and can be difficult to notice when both are present33. Though metHb is normally found as only a small percentage in blood in vivo, minor heme components have been know to exhibit resonance enhancement disproportionate to their concentrations, depending on excitation wavelength32. Furthermore, metHb is formed quickly in drawn blood upon standing. Nevertheless, resonance Raman spectral markers of metHb allow for its ready identification (Fig. 5c). The presence of a metHb component within a sample of predominantly oxyHb is signaled by increased intensity of a polarized band at 1564 cm−1, which is the ν2 band of metHb, along with broadening of the 1378 cm−1 ν4 band of oxyHb.
Figure 5.
Resonance Raman bands of equine (a) oxyhemoglobin, (b) deoxyhemoglobin and (c) met-hemoglobin, pH 7.4, 5 mw, with 406.7 nm excitation.
A difficulty encountered by differential near-infrared (NIR) absorption methods for the measurement of HbO2Sat in tissue vasculature has been to discriminate hemoglobin (Hb) absorptions from those of myoglobin (Mb) in muscle tissue 6, 34. Near-infrared (NIR) wavelengths penetrate tissue, and the NIR absorption properties of oxy- and deoxyMb are similar to those of hemoglobin. Signals from myoglobin can complicate the assessment of tissue oxygenation by NIR absorption since the P50 of myoglobin is only 3–4 torr 35. We note here, that as with the respective NIR absorptions, resonance Raman signals of myoglobin (provided in supporting information) are very similar to those of hemoglobin (Fig. 5), and it may not be practical to differentiate these during a clinical measurement if both were present. In this report we have made use of the fact that active tissue vasculature at certain mucosal surfaces in the oral cavity is not covered by a stratum corneum layer. Muscle myoglobin lies in a deeper layer 23, 34. By utilizing low powered deep violet laser excitation with limited tissue penetration, interfering resonance Raman signals from myoglobin in deeper tissue are avoided.
Supplementary Material
A table containing the resonance Raman band assignments for Figure 5, and a figure containing resonance Raman spectra of oxy, deoxy- and met-myoglobin with 406.7 nm excitation is available as Supporting Information. Current ordering information is found on any masthead page.
Acknowledgments
This work was supported by NIH grant GM57042, and instrumentation grant N00014-02-1-0642 from the Office of Naval Research, Arlington, VA.
References
- 1.Ward KR, Ivatury R, Barbee RW. J Intens Care Med. 2001;16:55–75. [Google Scholar]
- 2.Brown JW, Whitehurst ME, Gordon CJ, Carroll RG. Shock. 2005;23:239–242. [PubMed] [Google Scholar]
- 3.Crookes BA, Cohn SM, Bloch S, Amortegui J, Manning R, Li P, Proctor MS, Hallal A, Blackbourne LH, Benjamin R, Soffer D, Habib F, Schulman CI, Duncan R, Proctor KG. J Trauma. 2005;58:806–813. doi: 10.1097/01.ta.0000158269.68409.1c. discussion 813–806. [DOI] [PubMed] [Google Scholar]
- 4.Beilman GJ, Myers D, Cerra FB, Lazaron V, Dahms RA, Conroy MJ, Hammer BE. Shock. 2001;15:392–397. doi: 10.1097/00024382-200115050-00010. [DOI] [PubMed] [Google Scholar]
- 5.Chance B, Wang NG, Maris M, Nioka S, Sevick E. Adv Exp Med Biol. 1992;317:297–304. doi: 10.1007/978-1-4615-3428-0_31. [DOI] [PubMed] [Google Scholar]
- 6.Nighswander-Rempel SP, Kupriyanov VV, Shaw RA. Appl Spectrosc. 2005;59:190–193. doi: 10.1366/0003702053085106. [DOI] [PubMed] [Google Scholar]
- 7.Severinghaus JW, Kelleher JF. Anesthesiol. 1992;76:1018–1038. doi: 10.1097/00000542-199206000-00024. [DOI] [PubMed] [Google Scholar]
- 8.Yoshiya I, Shimada Y, Tanaka K. Med Biol Eng Comput. 1980;18:27–32. doi: 10.1007/BF02442476. [DOI] [PubMed] [Google Scholar]
- 9.Mancini DM, Wilson JR, Bolinger L, Li H, Kendrick K, Chance B, Leigh JS. Circulation. 1994;90:500–508. doi: 10.1161/01.cir.90.1.500. [DOI] [PubMed] [Google Scholar]
- 10.Hanlon EB, Manoharan R, Koo TW, Shafer KE, Motz JT, Fitzmaurice M, Kramer JR, Itzkan I, Dasari RR, Feld MS. Phys Med Biol. 2000;45:R1–59. doi: 10.1088/0031-9155/45/2/201. [DOI] [PubMed] [Google Scholar]
- 11.Ozaki Y, Mizuno A, Sato H, Kawauchi K, Muraishi S. Appl Spectrosc. 1992;46:533–536. [Google Scholar]
- 12.Baraga JJ, Feld MS, Rava RP. Proc Natl Acad Sci USA. 1992;89:3473–3477. doi: 10.1073/pnas.89.8.3473. [DOI] [PMC free article] [PubMed] [Google Scholar]
- 13.Baraga JJ, Feld MS, Rava RP. Appl Spectrosc. 1992;46:187–190. [Google Scholar]
- 14.Pernat A, Weil MX, Tang W, Yanaguchi H, Pernat AM, Sun S, Bisera J. J Appl Physiol. 1999;87:933–937. doi: 10.1152/jappl.1999.87.3.933. [DOI] [PubMed] [Google Scholar]
- 15.Wolthuis R, Bakker Schut T, Caspers PJ, Buschmann HPJ, Romer TJ, Bruining HA, Puppels G. In: Fluorescent and Luminescent Probes. Mason R, editor. Academic Press; London: 1999. pp. 433–455. [Google Scholar]
- 16.Sato H, Wada S, Ozaki Y, Tashiro H. Vib Spectrosc. 2004;34:149–156. [Google Scholar]
- 17.de Jong BWD, Bakker Schut TC, Wolffenbuttel KP, Nijman JM, Kok DJ, Puppels GJ. J Urology. 2002;168:1771–1778. doi: 10.1097/01.ju.0000030059.28948.c6. [DOI] [PubMed] [Google Scholar]
- 18.Shim MG, Song L, Marcon NE, Wilson BC. Photochem Photobiol. 2000;72:146–150. doi: 10.1562/0031-8655(2000)072<0146:IVNIRS>2.0.CO;2. [DOI] [PubMed] [Google Scholar]
- 19.van de Poll SWE, Kastelijn K, Bakker Schut TC, Strijder C, Pasterkamp G, Puppels GJ, van der Laarse A. Heart. 2003;89:1078–1082. doi: 10.1136/heart.89.9.1078. [DOI] [PMC free article] [PubMed] [Google Scholar]
- 20.Venkatesh B, Ramasamy S, Mylrajan M, Asokan R, Manoharan PT, Rifkind JM. Spectrochim Acta A. 1999;55:1691–1697. doi: 10.1016/s1386-1425(99)00008-6. [DOI] [PubMed] [Google Scholar]
- 21.Smith SJ, Munro AW, Smith WE. Biopolymers. 2003;70:620–627. doi: 10.1002/bip.10502. [DOI] [PubMed] [Google Scholar]
- 22.Torres Filho IP, Terner J, Pittman RN, Somera LG, Ward KR. Am J Physiol- Heart Circ Physiol. 2005;289:H488–H495. doi: 10.1152/ajpheart.01171.2004. [DOI] [PubMed] [Google Scholar]
- 23.Ward KR, Torres Filho I, Barbee RW, Torres L, Tiba MH, Reynolds PS, Pittman RN, Ivatury R, Terner J. Crit Care Med. 2006;34:792–799. doi: 10.1097/01.ccm.0000201898.43135.3f. [DOI] [PubMed] [Google Scholar]
- 24.Choi S, Spiro TG, Langry KC, Smith KM, Budd DL, La Mar GN. J Am Chem Soc. 1982;104:4345–4351. [Google Scholar]
- 25.Hu S, Smith KM, Spiro TG. J Amer Chem Soc. 1996;118:12638–12646. [Google Scholar]
- 26.Nakagawa Y, Weil MH, Tang W, Sun S, Yamaguchi H, Jin X, Bisera J. Am J Respir Crit Care Med. 1998;157:1838–1843. doi: 10.1164/ajrccm.157.6.9710029. [DOI] [PubMed] [Google Scholar]
- 27.Povoas HP, Weil MH, Tang W, Moran B, Kamohara T, Bisera J. Chest. 2000;118:1127–1132. doi: 10.1378/chest.118.4.1127. [DOI] [PubMed] [Google Scholar]
- 28.Sato Y, Weil MH, Tang W, Sun S, Xie J, Bisera J, Hosaka H. J Appl Physiol. 1997;82:558–562. doi: 10.1152/jappl.1997.82.2.558. [DOI] [PubMed] [Google Scholar]
- 29.Tang W, Weil MH, Sun S, Noc M, Gazmuri RJ, Bisera J. J Appl Physiol. 1994;76:572–577. doi: 10.1152/jappl.1994.76.2.572. [DOI] [PubMed] [Google Scholar]
- 30.Weil MH, Nakagawa Y, Tang W, Sato Y, Ercoli F, Finegan R, Grayman G, Bisera J. Crit Care Med. 1999;27:1225–1229. doi: 10.1097/00003246-199907000-00001. [DOI] [PubMed] [Google Scholar]
- 31.Weil MH, Bisera J, Trevino RP, Rackow EC. Crit Care Med. 1985;13:907–909. doi: 10.1097/00003246-198511000-00011. [DOI] [PubMed] [Google Scholar]
- 32.Terner J, Palaniappan V, Gold A, Weiss R, Fitzgerald MM, Sullivan AM, Hosten CM. J Inorg Biochem. 2006;100:480–501. doi: 10.1016/j.jinorgbio.2006.01.008. [DOI] [PubMed] [Google Scholar]
- 33.Ramser K, Bjerneld EJ, Fant C, Kall M. J Biomed Opt. 2003;8:173–178. doi: 10.1117/1.1559730. [DOI] [PubMed] [Google Scholar]
- 34.Ward KR, Ivatury RR, Barbee RW, Terner J, Pittman R, Torres IP, Spiess B. Resuscitation. 2006;68:27–44. doi: 10.1016/j.resuscitation.2005.06.022. [DOI] [PubMed] [Google Scholar]
- 35.Richardson RS, Duteil S, Wary C, Wray DW, Hoff J, Carlier PG. J Physiol. 2006;571:415–424. doi: 10.1113/jphysiol.2005.102327. [DOI] [PMC free article] [PubMed] [Google Scholar]
Associated Data
This section collects any data citations, data availability statements, or supplementary materials included in this article.
Supplementary Materials
A table containing the resonance Raman band assignments for Figure 5, and a figure containing resonance Raman spectra of oxy, deoxy- and met-myoglobin with 406.7 nm excitation is available as Supporting Information. Current ordering information is found on any masthead page.


