Abstract
A general strategy for the rapid structural analysis of DNA binding ligands is described as it was applied to the study of RT29, a new benzimidazole-diamidine compound containing a highly twisted diphenyl ether linkage. By combining the existing high-throughput fluorescent intercalator displacement (HT-FID) assay developed by Boger et al. and a high-resolution (HR) host-guest crystallographic technique, a system was produced that was capable of determining detailed structural information pertaining to RT29-DNA interactions within ~ 3 days. Our application of the HT-HR strategy immediately revealed that RT29 has a preference for four-base pair, A/T-rich sites (AATT) and a similar tolerance and affinity for three A·T-base pair sites (such as ATTC) containing a G·C base pair. Based on these selectivities, oligonucleotides were designed and the host-guest crystallographic method was used to generate diffraction quality crystals. Analysis of the resulting crystal structures revealed that the diphenyl ether moiety of RT29 undergoes conformational changes that allow it to adopt a crescent shape that now complements the minor groove structure. The presence of a G·C base pair in the RT29 binding site of ATTC did not overly perturb its interaction with DNA - the compound adjusted to the nucleobases that were available through water-mediated interactions. Our analyses suggest that the HT-HR strategy may be used to expedite the screening of novel minor groove binding compounds leading to a direct, HR structural determination.
Introduction
The DNA minor groove continues to be an important target for the development of anti-cancer, antiviral, and anti-microbial compounds. Indeed, many examples of DNA binding natural products and synthetic agents with potent biological and/or clinical activities are targeted to this prominent DNA feature.1–8 The development and analysis of new minor groove-targeted compounds is of further timely importance given our passage into the post-genomic era and accelerating efforts towards the understanding of the genomes of other organisms. Thus, to attempt to make direct therapeutic benefit of the wealth of information concerning gene sequences, protein binding sites, and other DNA-based targets provided by these sequencing efforts, it is equally important to be able to explore novel classes of DNA-targeted compounds at a similar pace.9, 10
Accelerating the investigation of DNA-targeted compounds is particularly important in light of expanding efforts towards the development of combinatorial libraries of DNA-targeted compounds.11–15 Combinatorial syntheses generate many DNA binding agents for comparison and discovery of activities and, importantly, the data necessary to carry out meaningful structure-activity relationship (SAR) studies if performed at high resolution. Unfortunately, these endeavors have made it apparent that the ability to generate potential DNA binding compounds has far out-paced the throughput capabilities of the traditional techniques used to study DNA binding agents.16 The methodologies still most often employed are those that evolved at a time when the discovery of a DNA binding compound required years of often conflicting effort to fully elucidate a mechanism of action or site-selectivity through a combination of “slow-throughput” strategies.16
Given the above limitations, new approaches need to be developed to enable the high-throughput (HT) and high-resolution (HR) analysis of DNA binding compounds to augment the protocols currently in use. In one effort aimed at developing an HT method of DNA binding agent analysis, the fluorescent intercalator displacement (FID) assay permits the rapid identification of DNA binding site preferences for low molecular weight ligands.15 Importantly, the HT-FID technique can reveal binding site preferences and relative affinities to all possible DNA binding sites of a certain size within hours, while traditional footprinting techniques would require weeks or even longer periods of time, often without examining all possible DNA sequences.
While the HT-FID method can rapidly identify DNA binding site preferences or “lead” agents targeted to a particular DNA site of interest from a library of compounds, it cannot generate high-resolution (HR) structural information to evaluate a ligand-DNA binding interaction. Thus, we have sought to couple an existing HR analysis protocol17–22 to the FID technique to provide an atomic-level visualization of DNA binding. To fulfill this need, we have applied our host-guest (H-G) crystallographic method for DNA oligonucleotides18–22 to the crystallization and analysis of site-selective DNA binding ligands.17 This method18–22 has been shown to facilitate the study of any desired DNA sequence in the presence and absence of DNA ligands,17 requiring just 2–3 days to complete the initial analysis. While not impacting the study of DNA oligonucleotides nor their binding to low molecular weight ligands, we note that contemporary efforts by others have also led to host-guest crystallization strategies for the elucidation of RNA-RNA23 and RNA-protein24 interactions.
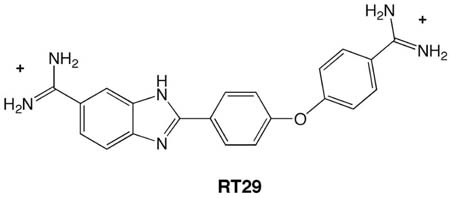
In light of the HT nature of the FID assay15 and the capabilities of our host-guest crystallographic method,17–22 we combined these two techniques into a single “pathway” for the examination and analysis of DNA binding agents, an “HT-HR” analysis system. In the initial application presented herein, we used the HT-HR method to determine preferred DNA binding sites of RT29 and structures of these same DNA sequences bound to this compound, a diamidine structure related to phenylamidine compounds that are currently entering Phase III trials against parasitic diseases.1, 8 RT29 differs from previously studied compounds in that it contains a highly twisted diphenyl ether that appears superficially to be too highly curved to bind to the minor groove by a classical mode; however, preliminary biological testing has revealed that the compound has excellent anti-trypanosomal activity (unpublished). Here, we illustrate that our HT-HR analysis system, as applied to RT29, can quickly reveal the structure of RT29 bound to a drug-selected four base pair A/T site. In addition we show the structural basis for the tolerance of a G/C base pair flanking a similarly preferred, albeit three A/T base pair, binding site.
Results and Discussion
HT-HR strategy for rapid analysis of DNA-binding ligands
The documented speed at which the FID analysis can determine the ability of a ligand to bind to DNA, and simultaneously its sequence preferences, combined with our H-G crystallographic method for deoxyoligonucleotides, results in a strategy that enables one to go from an unknown DNA binding agent to a determination of its HR structure within several days. In contrast, the current timeframe for such an analysis is months, or years, in some instances. This time advantage could do much to expedite the field of DNA binding agent design and analysis, facilitating the development of compounds for further biological testing.
In brief, our particular host-guest crystallographic method employs the N-terminal fragment of Moloney murine leukemia virus (MMLV) reverse transcriptase (RT) as the host and the DNA, in the presence or absence of ligand as the guest. In previous work, we have used the host-guest method to crystallize and analyze nucleic acid molecules of interest18–22 and recently have extended this methodology to the analysis of netropsin bound to DNA.17 The crystals used in the H-G approach include one RT protein molecule and one half of the intact 16 base pair duplex in the asymmetric unit, the unique repeating unit within the crystal. Therefore, the 16 base pair oligonucleotides used for the study are self-complementary and will contain two identical binding sites for RT29.
Advantages of the H-G crystallographic method include the ability to: (1) obtain diffraction quality crystals of the desired complex overnight by employing microseeding techniques; (2) measure and process high resolution diffraction data (1.8–2.0 Å) using a home X-ray source and R-axis IV ++ image plate detector in one day; and (3) solve the phase problem by molecular replacement using the N-terminal fragment as the search model and obtain an unbiased electron density map for the DNA with bound ligand within an hour of completing the data collection.25 Traditional methods of obtaining crystals of DNA-ligand complexes require weeks to months to obtain diffraction quality crystals and thus are not amenable to high-throughput analyses. Preparation of the reagents required for the analysis is straightforward; we routinely obtain large quantities (~ 50 mg) of highly purified N-terminal RT fragment, and oligonucleotides are purchased commercially and purified in micromolar quantities using standard HPLC methods. Once the reagents have been prepared, the method is quite rapid.
The strategy and approximate time-line for analyzing the DNA-binding properties of RT29 are outlined in Scheme 1. HT-FID analyses were used to rank-order the binding preferences of RT29 for every possible combination of 4 base pair binding sites within a library of 136 hairpin DNA molecules.15 Then, two high affinity DNA binding sites were selected for comparative analysis by H-G crystallography, and crystal structures of each high-affinity binding site within a 16 base pair DNA duplex in the presence and absence of RT29 were determined. As illustrated, high-resolution information after initial refinement and modeling can be achieved within ~ 3 days of obtaining a compound for study.
Scheme 1.
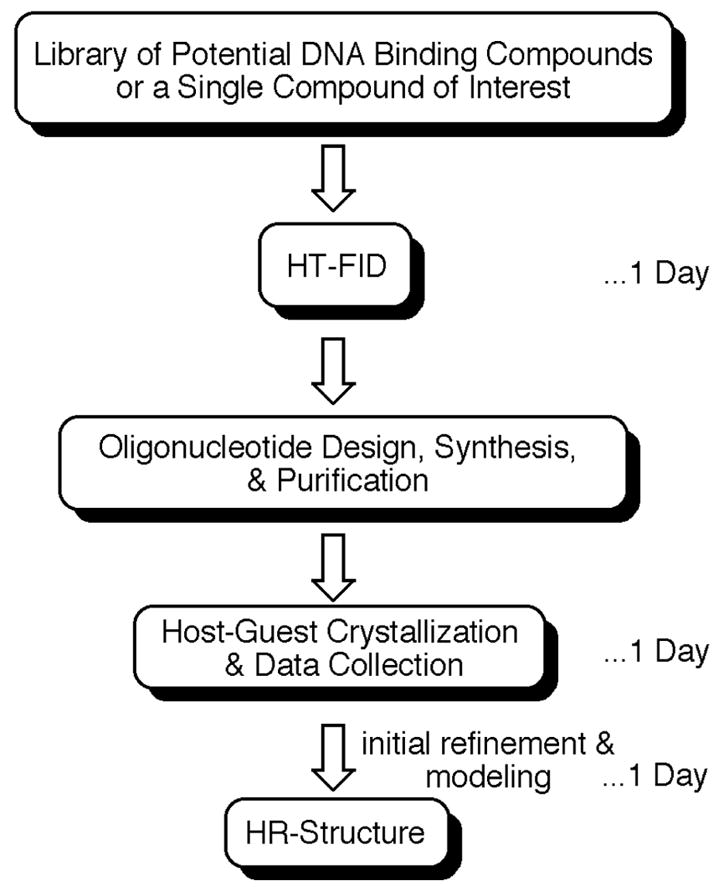
The HT-HR strategy.
HT-FID identification of high affinity binding sites
Compound RT29 was analyzed initially via the HT-FID technique, as outlined in Scheme 1. Analyses were performed using 1.5 μM hairpin oligonucleotide and 4.5 μM ethidium bromide.15 As shown in Fig. 1, the HT-FID analysis of RT29 (at 0.75 and 1.5 μM concentrations) yielded merged-bar histograms of the rank-ordered 136 hairpin library that were similar with regards to plot curvature in comparison to FID plots reported earlier for netropsin.15, 26 With RT29, there is steep plot curvature associated with the hairpin sequences providing preferred binding sites and the expected horizontal and vertical FID profile displacement as a function of increasing drug concentration. Additionally, given the color-coding employed in our presentation of the HT-FID analysis, where the red and blue bars are exclusively G/C-only and A/T-only 4 base pair cassette hairpin oligonucleotides, respectively, the overall A/T preference of RT29 is immediately revealed: The blue A/T-only hairpins are all displayed at the preferred end of the rank order while the red G/C-only bars are distributed throughout the highest ranked end of the histogram.
Figure 1.
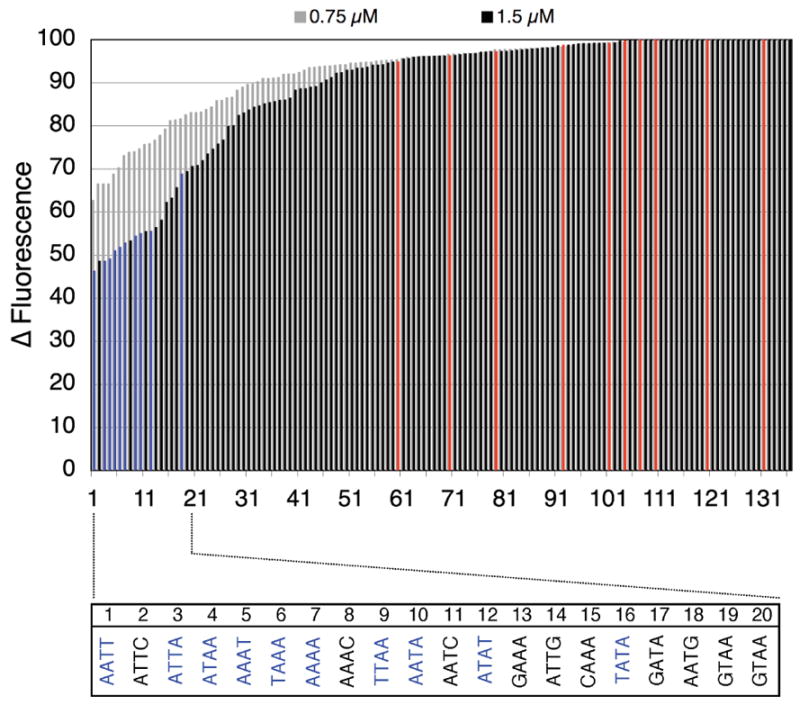
HT-FID analysis of RT29. Blue bars represent A/T-only 4-base pair cassette sequences while the red bars represent G/C-only 4 base pair cassette sequences.
As noted above and illustrated in Fig. 1, for 1.5 μM RT29, A/T-only and A/T-rich (defined as 3-out-of-4 of the base pairs of the cassette being A/T) oligonucleotide hairpins provided preferred binding sites. Indeed, the 10 possible A/T-only (blue) hairpin cassettes are all contained within the top 16 of the rank-order with AATT being the top-ranked site. As also observed in the analyses of netropsin, the TATA cassette oligonucleotide was the lowest ranked of the A/T-only hairpin cassettes and separated from the remainder of the A/T-only by several mixed, A/T-rich hairpins in the rank order.15, 26
Upon further examination of the actual sequences that constitute the top-ranked sites of RT29 binding, we find that, among the A/T-only hairpin cassettes, there is a conspicuous presence of 4 base pair hairpin oligonucleotides that contain 3 A·T base pairs and a flanking G·C base pair; however, none of the 4 base pair cassettes selected contained a G·C base pair in an “interior” position. For example, within the top 20 of the rank order, ATTC, AAAC, AATC, GAAA, ATTG, CAAA, GATA, AATG, GTAA, and GTAA were selected. Significantly, the top three sequences of this list were ranked 2, 8, and 11 suggesting they present binding sites to RT29 that are nearly as favorable as the A/T-only sequences. While these analyses superficially suggest that RT29 has a < 4 base pair A/T binding site preference, the consistency of the observation of 3 A/T base pairs + 1 flanking G·C base pair interspersed among the top-ranked hairpins suggests that RT29 somehow adjusts to the presence of these sequences.
While the qualitative data described above indicate that AATT and ATTC, and other A/T-only or G·C-flanked-A/T cassettes, present preferred and targeted sequences for drug interaction, verification of the rank order revealed by the histogram in Fig. 1 requires a separate quantitative comparison.15 To this end, quantitative analyses via surface plasmon resonance (SPR) revealed that RT29 bound to AATT with an affinity of 6 × 10⁸ M−1 and ATTC with an affinity of 4 × 10⁷ M−1.27 These data nicely agree with the rank ordering of the sites from the HT-FID assay and suggest that relative binding affinities measured by the HT-FID reflect the true binding preferences of RT29 to the hairpin molecules. Thus, RT29 appears to be capable of interacting with both A/T-only and G·C flanked A/T sites with high affinity, dissimilar from other benzimidazole-based minor groove binding compounds.1 Thus, as the next step (Scheme 1), we determined H-G crystal structures of RT29 bound to both AATT and ATTC sites to provide a structural analysis via our HT-HR strategy.
Host-guest Crystallography
Two 16 base pair oligonucleotides were designed based on the results from the HT-FID analysis, one containing two AATT sites, the other two ATTC sites. The resulting oligonucleotide sequences were: 5′-CTTAATTCGAATTAAG and 5′-CTTGAATGCATTCAAG (Fig. 2). Following purification of the oligonucleotides, host-guest crystallization was carried out by microseeding complexes of the protein, the N-terminal fragment of MMLV RT (referred to as RT in subsequent discussion), with each oligonucleotide resulting in diffraction quality crystals overnight. RT29 was pre-complexed with each oligonucleotide and subsequently with the protein. Crystals suitable for data collection grew overnight following microseeding with crystals of the corresponding protein-oligonucleotide. High-resolution data were collected for the RT-AATT-RT29, RT-ATTC-RT29, and RT-ATTC complexes as summarized in Table 1. The RT-AATT complex was reported previously.17 Structures were determined by molecular replacement and subjected to crystallographic refinement. Following initial refinement, electron density was apparent for RT29 in the minor groove of the DNA. Thus, an initial structural analysis of the RT29-DNA complexes was completed within 3–4 days.
Figure 2.
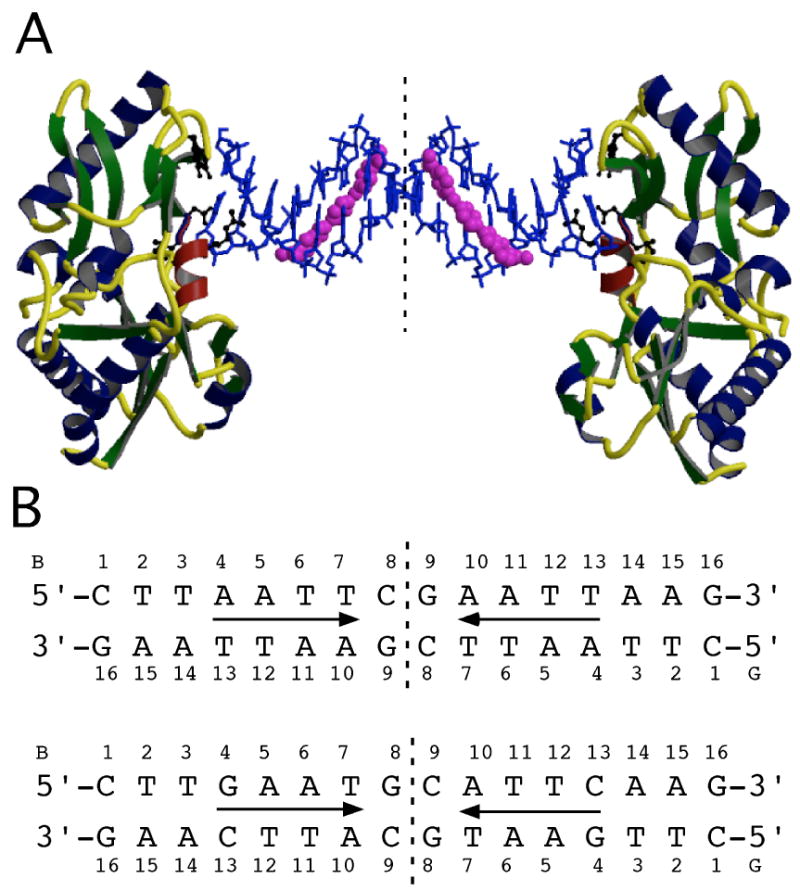
(A) The crystal structure of the RT fragment-ATTC-RT29 complex. The asymmetric unit consists of one molecule, an 8 bp oligonucleotide duplex and one RT29 molecule representing half of the symmetric complex. The dashed vertical line represents the dyad. The DNA oligonucleotide is shown in a blue sticks model, and RT29 is shown in a magenta CPK model. RT is shown as a ribbon rendering with beta-strands in green, coils in yellow and alpha-helices in navy except for the αD helix in red. Residues Tyr64, Asp114, Leu115, Arg116 and Gly191 make contacts with the DNA and are shown in black ball-and-sticks models. (B) Schematics of the oligonucleotide duplexes with the two complementary strands (B and G) and the numbering scheme referred to in the text. Arrows denote RT29 molecules oriented from benzimidazole diamidine (tail) to phenylamidine (head).
Table 1.
Summary of crystallographic and refinement data.
| Cell Parameters | RT-AATTa | RT-AATT-RT29 | RT-ATTC | RT-ATTC-RT29 |
|---|---|---|---|---|
| Cell constants (Å) | a=54.93 | a=54.55 | a=54.95 | a=54.75 |
| b=145.75 | b=145.65 | b=145.65 | b=145.45 | |
| c=46.86 | c=46.84 | c=46.81 | c=46.86 | |
| Space Group | P21212 | P21212 | P21212 | P21212 |
| Statistics | ||||
| Maximum Resolution | 1.8 Å | 2.05 Å | 1.95 Å | 1.8 Å |
| Reflections (unique) | 35,445 | 23,358 | 28,321 | 35,649 |
| (total) | 169,451 | 204,634 | 146,298 | 160,158 |
| Completeness (%) | 98.9 (97.6) | 96.2 (94.7) | 99.6 (99.6) | 98.8 (92.0) |
| Rsymb (%) | 5.2 (32.3) | 9.1 (56.5) | 6.6 (50.2) | 3.5 (29.2) |
| I/s | 19.7 (4.4) | 22.9 (4.1) | 22.1 (3.1) | 37.1 (3.4) |
| Refinement | ||||
| Resolution range (Å) | 50-1.8 | 50-2.05 | 50–1.95 | 50–1.8 |
| Number of Waters | 237 | 226 | 216 | 226 |
| Average B-factor (Å2): | ||||
| Protein | 29.2 | 30.6 | 38.2 | 34.0 |
| DNA | 56.5 | 48.3 | 60.2 | 52.3 |
| Water | 31.9 | 32.9 | 37.1 | 35.0 |
| RT29 | N/A | 73.1 | N/A | 80.0 |
| Rvaluec (%) | 22.7 | 22.8 | 23.7 | 23.4 |
| Rfree (%) | 26.4 | 28.1 | 25.5 | 26.7 |
The RT-AATT structure was reported previously.17 Data in ( ) are for highest resolution shell.
Rsym= __i|Ii-<I>|/_<I> where I is the integrated intensity of a reflection.
Rvalue=_hkl||Fobs − kFcalc|/_hkl|Fobs|. 5% of all reflections were omitted from refinement and Rfree is the same statistic calculated for these reflections.
Crystal structure of RT29 bound to AATT
Electron density for RT29 bound to DNA was apparent in initial 2Fo-Fc maps phased only with the protein model and improved upon inclusion of the DNA model in the refinement (Figure 3A). Details regarding determination of the correct orientation of RT29 are discussed in the Experimental Section. As expected, two RT29 molecules were bound identically to the DNA complexed with MMLV RT in the structure (Fig. 2), placing one RT29 molecule within the asymmetric unit. RT29 is bound in the minor groove of the DNA within the AATT site in a water-mediated interaction with the phenylamidine moiety of the molecule (Figure 3B).
Figure 3.
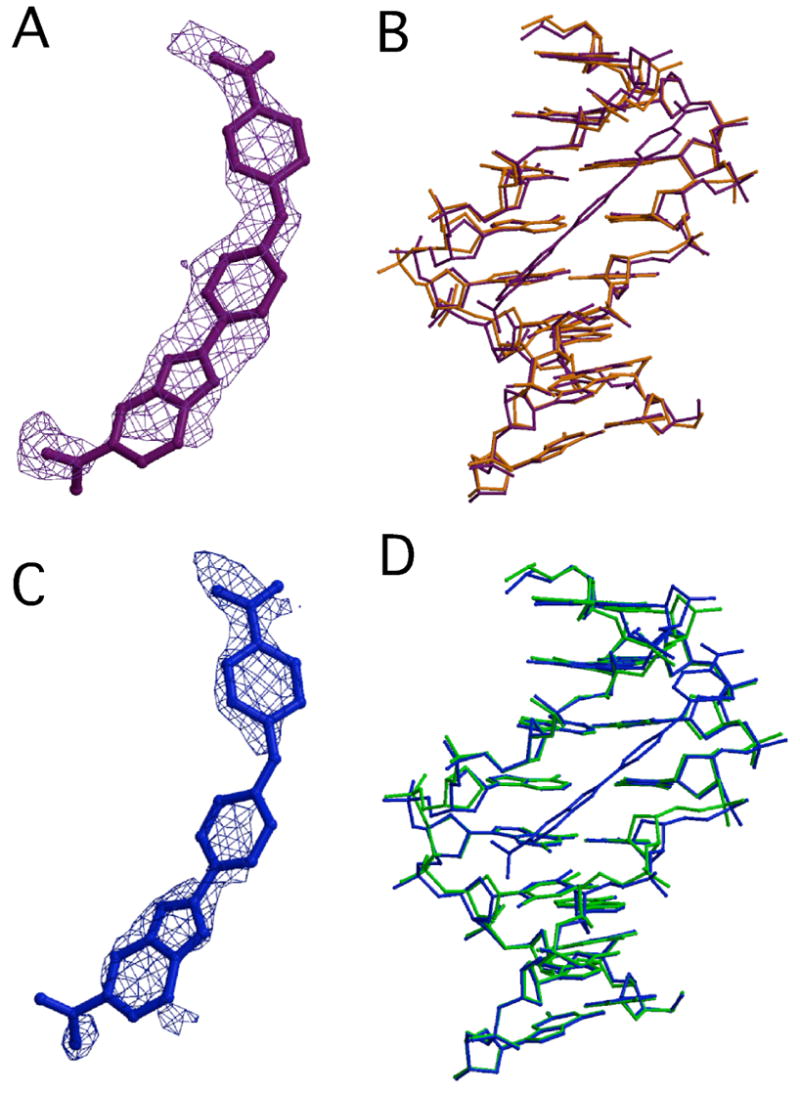
(A) Final 2Fo-Fc map of RT29 density contoured at 1 σ is shown in a violet cage rendering superimposed on the final RT29 model bound to AATT (purple). (B) Final models of AATT DNA in the presence (purple) and absence (orange) of RT29 (rmsd = 0.38 Å, superimposed in O based on C1’ atoms of all 8 bp). (C) Final 2Fo-Fc map of RT29 density contoured at 1 σ is shown in a blue cage rendering superimposed on the final RT29 model bound to ATTC (blue). (D) Superimposed final models of ATTC DNA in the presence (blue) and absence (green) of RT29 (rmsd = 0.34 Å, superimposed in O based on C1’ atoms of all 8 bp).
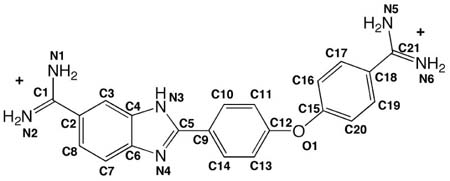
Interactions of RT29 with the AATT-DNA are mediated, in part, by hydrogen bonds involving nitrogen atoms (N1, N3, and N5) of RT29 (Figure 4A and Supporting Information). There are a total of six hydrogen bonds in the interaction of RT29 with the AATT-DNA, three direct hydrogen bonds between RT29 and the DNA, one hydrogen bond between RT29 and a water molecule, and two hydrogen bonds between the drug-bound water molecule and the DNA. The water molecule is associated with the phenylamidine moiety only when RT29 is bound to the DNA. Although RT29 has far fewer hydrogen bonds with the DNA than a minor groove binding compound such as netropsin, which has 14 hydrogen bonds with the AATT sequence,17 it nevertheless binds tightly, as has been observed for other non-peptide-based ligands.1 The N1 atom of RT29 forms a backbone hydrogen-bonding interaction with O4′ sugar atoms of the DNA, while the N3 atom of RT29 forms a bifurcated hydrogen bond to O2 of T13 and the O4′ sugar atom of T6. N5 forms two water-mediated hydrogen bonds, one with N3 of A10 and a second with an O4′ sugar atom.
Figure 4.
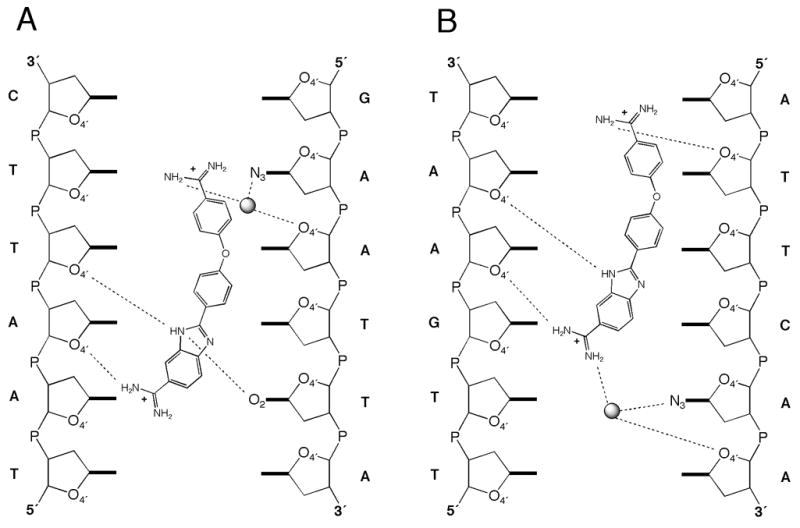
Hydrogen bonding network observed between (A) RT29 and the AATT oligonucleotide and (B) RT29 and the ATTC oligonucleotide.
To further characterize the nature of the binding interactions of RT29 with DNA, we compared the structures of the DNA in the presence and absence of RT29 as well as the structures of RT29 before (calculated structure) and after DNA binding. The structure of the AATT DNA bound to RT29 is similar to the DNA-only structure as shown in Figure 3B (rmsd = 0.38 Å) and displays only minor variations in base pair parameters as analyzed by 3DNA28 (data not shown). However, differences in minor groove width are apparent upon drug binding. The interaction of RT29 with the DNA widens the narrowest part of the minor groove within the binding site by approximately 1 Å where the phenylamidine moiety is bound (Fig. 5), while the benzimidazole-amidine group is bound in the widest part of the groove. The minor groove width differs within the AATT binding site by 3 Å in the absence and 2 Å in the presence of RT29. The compound displays structural flexibility by forming a crescent shape that allows it to fit into the minor groove of the DNA, very different from its predicted structure.29 The phenyl-O-phenyl bond angle is 137.7° in the crystal structure versus 119.0° for the calculated structure. Furthermore, the angle between the phenyl planes adjusts to 20.1° when RT29 is bound to AATT as opposed to 62° for the calculated structure. Thus, the interaction of RT29 with the DNA suggests an “induced fit” in which RT29 conforms to the shape of the minor groove while perturbing the native minor groove width in order to allow association with the DNA.
Figure 5.
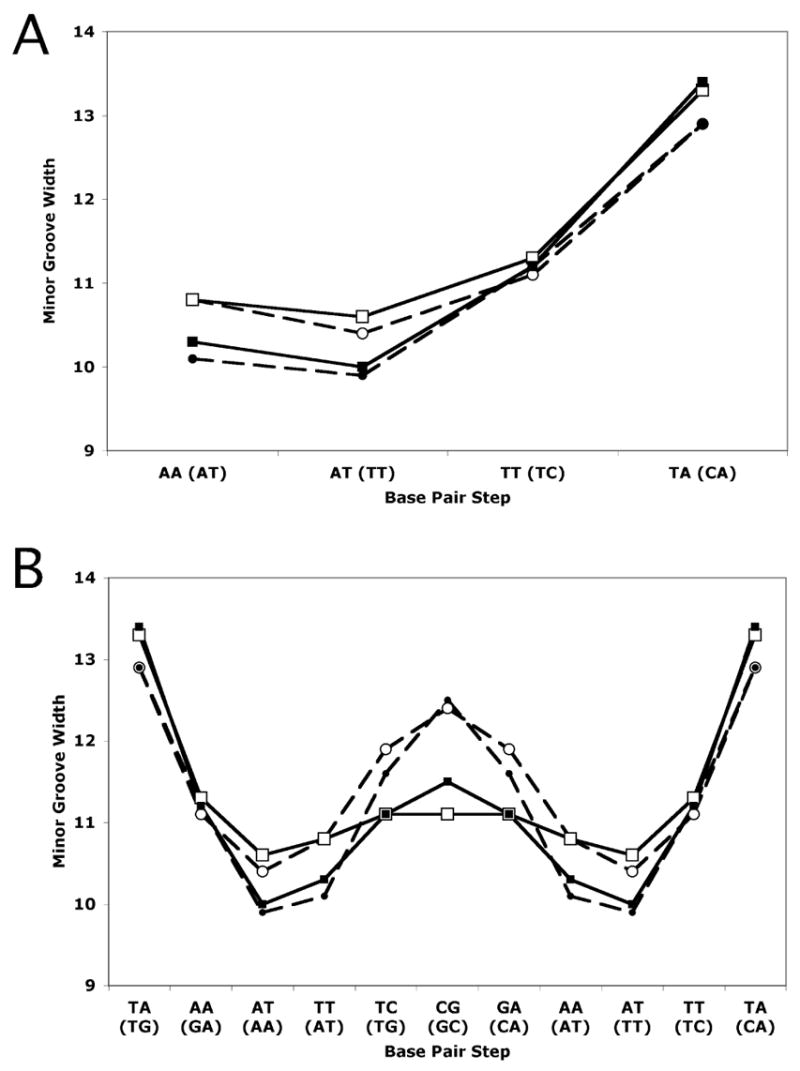
Minor groove widths in Å calculated in 3DNA28 based on cross-strand distances of phosphate groups. (A) Minor groove widths in AATT and ATTC sites. (B) Minor groove widths of entire 16 base pair sequences. Symbols used are open circles for AATT-RT29, filled circles for AATT, open squares for ATTC-RT29, and filled squares for ATTC. Dashed lines represent the AATT structures and solid lines, the ATTC structures. Dinucleotide steps are indicated for each structure, with those of the ATTC structure in parentheses.
Crystal structure of RT29 bound to ATTC
As in the structure of RT29 bound to AATT, density for RT29 was apparent in initial difference maps and improved with the inclusion of the DNA in the structural model, Figure 3C; the density for RT29 bound to ATTC was not as well resolved as for the AATT site. In SPR measurements, RT29 was found to bind less tightly to the ATTC site; however RT29 remains bound in a single orientation, as in the AATT structure (see Experimental Section), with a water-mediated interaction through the benzimidazole amidine. Unexpectedly, interactions of RT29 with the DNA span 5 base pairs, and thus extend beyond the ATTC site. Hydrogen bonding interactions involve N1, N2, N3, and N5 atoms of RT29, with three direct hydrogen bonds between RT29 and the DNA, one between RT29 and a water molecule, and two between the water molecule and the DNA (Figure 4B). Three of the hydrogen bonds are formed directly between N1, N3 and N5 atoms of RT29 and O4′ sugar atoms of the DNA backbone, while a fourth between N2 and O4′ is water-mediated. A single base-specific water-mediated interaction occurs with the base 3′ to the ATTC site between N2 of RT29 and N3 of A14.
In comparing the structures of ATTC in the presence and absence of DNA, we find overall similarity reflected in the rmsd of 0.34 Å (Figure 3D). As was true for the complex of RT29 with AATT, the narrowest part of the minor groove within the site widens when the phenylamidine moiety is bound (Fig. 5). In this case, the narrowest part of the minor groove within the ATTC site is identical to that in the AATT site when RT29 is bound, while the groove widens approximately 0.5 Å upon binding of RT29. The benzimidazole-amidine group is bound in the widest part of the groove and hydrogen bonds to a water molecule that mediates its interaction with the DNA. Differences in the calculated structure of RT29 versus its structure upon binding to the ATTC sequence are also observed: the phenyl-O-phenyl bond angle is 138.7° and the angle between phenyl planes 38.3° (versus 119° and 62° for an energy minimized structure).
Comparison of the AATT-RT29 and ATTC-RT29 structures
Of particular interest was to determine the structural basis of the tolerance of RT29 for a G/C base pair in a high affinity DNA binding site. We have therefore compared the structures of AATT and ATTC in the presence and absence of RT29 as well as the RT29-DNA interactions for each binding site. As expected, there are distinct sequence-specific structural differences between the AATT and ATTC oligonucleotides in the absence of RT29. However, both structures display similar trends in groove widths along the DNA with the minor groove width of the AATT oligonucleotide being somewhat wider near the dyad (12.3 Å) as compared to 11.5 Å for the ATTC DNA (Fig. 5). Groove widths of the DNA-only structures within the RT29 binding site are very similar for both AATT and ATTC sequences despite the presence of the C·G base pair in the ATTC site. It is possible that the C·G pair is minimally disruptive to the minor groove as it is embedded in an AT-rich sequence (CATTCAAG), although the 3′-AAG portion of the oligonucleotide is involved in interactions with the protein (see Supporting Information for details of the protein-DNA interactions in these structures). Thus, the structures of AATT and ATTC oligonucleotides in the presence of RT29 are similar, despite the differences in sequence, with an rmsd of 0.42 Å as shown in Figure 6A. In both structures, the interaction of RT29 with the DNA results in a widening of the narrowest part of the minor groove within the binding site to a similar extent where the phenylamidine moiety is bound, while the benzimidazole amidine group is bound in the widest part of the binding site.
Figure 6.
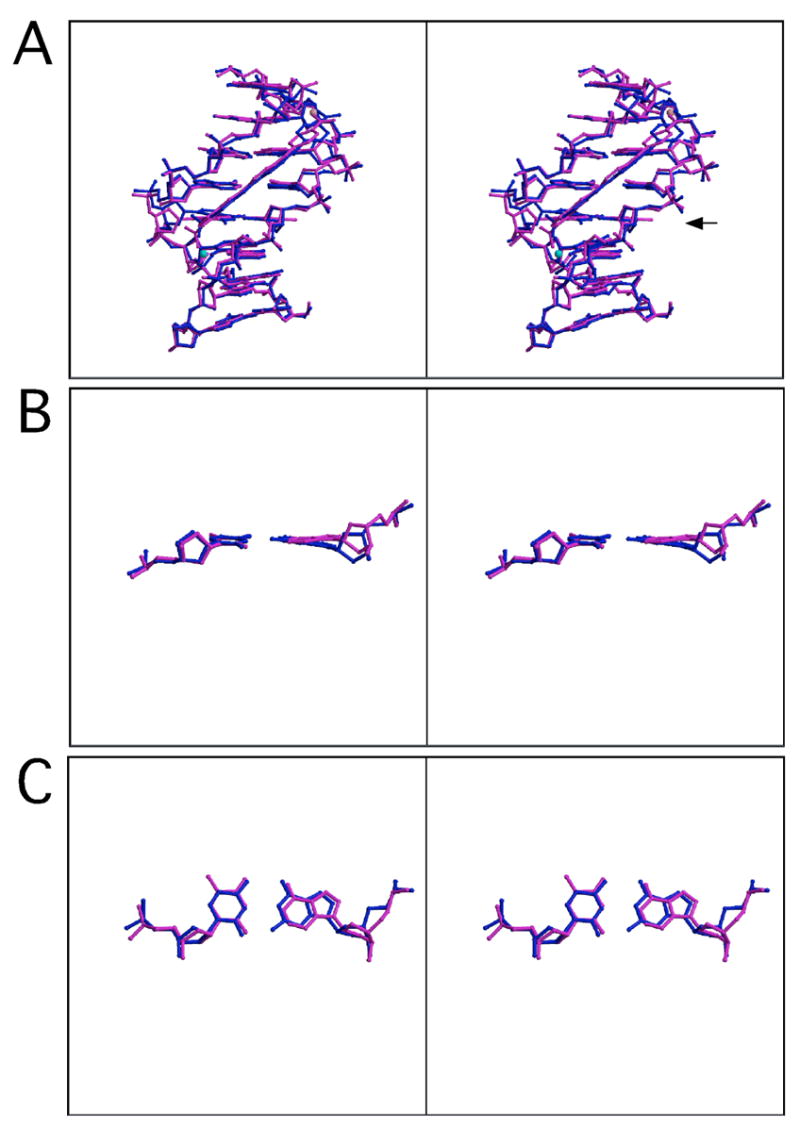
(A) Stereodiagram of structures of DNA bound to RT29 (AATT, magenta; ATTC, blue) superimposed in O using C1’ of all 8 bp (rmsd = 0.42 Å). (B) and (C) Stereodiagrams of A4-T13 (magenta) and G4-C13 (blue) base pairs from superimposed DNA structures. There is a water molecule associated with each complex represented as a cyan sphere for the ATTC structure and a pink sphere for the AATT structure. The view in (B) is rotated ~ 160° from the view in (A) to allow an edge on view of the base pairs. The view in (C) is rotated ~ 90° from the view in (B).
The conformations of RT29 bound to the AATT and ATTC sites are also similar—both conformations display similar changes in phenyl-O-phenyl bond angle and the angle between the phenyl planes that allow the molecule to fit into the minor groove (Fig. 6). Widening of the narrow part of the groove where the phenylamidine is bound may be due to rotation of the phenylamidine around the phenyl-O-phenyl bond and is specific for RT29 interaction with the DNA. For example, binding of netropsin to the same AATT sequence does not result in significant changes in minor groove width, although minor groove width plays a role in orientation of the drug.17 Thus, independent of sequence, both RT29 and the DNA undergo structural changes that promote a stable interaction; this observation of ligand “induced fit” is not unexpected30 and clearly compensated for energetically through formation of stable DNA-bound complexes.
The comparison of interactions between RT29 and the two different DNA sequences also reveals that the compound is able to adjust its conformation to the bases that are presented and utilizes different water-mediated hydrogen bonding strategies31 to increase interactions with the different DNA sequences. In each structure, RT29 hydrogen bonds primarily with the DNA backbone. Two base-specific contacts are observed between RT29 and AATT (one is water-mediated), whereas only one base-specific, water-mediated hydrogen bond occurs when RT29 is bound to ATTC. The hydrogen bonding pattern of RT29 with the AATT site spans four base pairs, while that with the ATTC sequence spans 5 base pairs through a water-mediated interaction. This, in part, results from a sliding of RT29 within the minor groove in the ATTC structure as compared to its position in the AATT structure. RT29 is shifted closer to the dyad axis of the 16 base pair oligonucleotide in the complex with ATTC relative to its position in the complex with AATT as shown in Figure 6A. The N2 of the guanine in the G4-C13 pair (equivalent to the A4-T13 pair in the AATT structure) does not prevent RT29 from binding to the DNA. Rather, the RT29 molecule recruits a water molecule at the benzimidazole-amidine end to mediate hydrogen bonds with a base 3′ to the ATTC site (ATTCA). In each case, a “highly twisted” RT29 molecule is able to conform to the structure of the minor groove of the DNA to promote a stable complex. Importantly, in comparing the structures of the A4-T13 step with that of the G4-C13 step, we note that the positions of the pyrimidines are quite similar. However, the position of G4 suggests a rotation and slide of this base, relative to the position of A4 from the AATT structure, placing G4 deeper in the groove (Figure 6B and C) and potentially minimizing the effects of N2 in disrupting the interaction.
Comparison to other benzimidazole derivatives
The benzimidazole group of RT29 is bound in the widest part of the minor groove, while the well-established benzimidazole-containing compound, Hoechst 33258 is known to bind A-tract sequences with the benzimidazole group in the narrowest part of the minor groove.1 This variation may result from the moieties that differentiate these molecules. For example, H33258 contains two benzimidazole groups, one connected to an N-methylpiperazine ring and the other containing a terminal phenyl group. The planar phenyl-benzimidazole group is located in the narrowest part of the groove. In contrast, RT29 contains a benzimidazole-amidine linked to a phenylamidine group through a phenyl-O-phenyl bond. The phenylamidine group is able to adjust its orientation through this bond allowing it to fit into the narrowest part of the minor groove. The larger benzimidazole-amidine moiety rests in the wider part of the groove where it may display slight torsional twists that require a wider groove.
Summary & Conclusions
The HT-HR strategy has facilitated the rapid structural analysis of a new DNA-binding compound, RT29. This compound exhibits the ability to accommodate a G·C base pair flanking an A/T-rich site through a structural “by-pass” in which steric hindrance from the N2 of the guanine is minimized by its deeper position within the groove relative to a comparable A·T pair. The DNA binding of RT29 is as strong as related compounds that fit the classical rules for formation of minor groove complexes. Crystallographic studies of the DNA complexes of RT29 provide part of the explanation for the strong and specific binding. As the compound binds to the minor groove, it undergoes a number of changes in torsional and bond angles that induce a shape that can fit into the minor groove. Finally, a water molecule is incorporated into the complex interface, like other systems,1, 31 to complete the H-bonding that links the compound and DNA. Through our investigation of RT29, the HT-HR strategy has proven to be a viable approach to the elucidation of drug-DNA structural interactions. As noted, the formative analyses performed herein required ~ 3 days, revealing much about an unknown compound. While the HT-HR strategy can reveal details of a drug-DNA structural interaction, a full characterization of drug binding requires, as before, further biophysical analyses. Thus, a full analysis of RT29-DNA binding is forthcoming, including an analysis of five base pair binding sites. Having successfully applied our HT-HR method to the structural characterization of RT29, we plan now to further expedite this strategy through automation to attempt the screening of libraries of new minor groove binding compounds.
Experimental Section
Synthesis of RT29
RT29 was synthesized as the HCl salt as described previously.32
HT-Fluorescence Intercalator Displacement Analyses
The DNA library of 136 different oligonucleotide hairpins was purchased from Trilink Biotechnologies, Inc. as individual lyophilized solids. Concentrations of the hairpin deoxyoligonucleotides were determined by the method described by Boger15 using UV at 90 °C and single-strand extinction coefficients to ensure accurate concentration determination.
To carry out the assay, each well of a Costar black 96-well plate was loaded with Tris buffer containing ethidium bromide (150 μL of 5.5 μM EtBr, 0.12 M NaCl, and 0.012 M Tris pH 8.0 (identical results were obtained at pH 7.4). To each well was added one hairpin deoxyoligonucleotide of the library (25 μL of 11.1 μM hairpin solution, 77.7 μM in base pairs, in H2O). Final concentrations in each well were 1.5 μM DNA-hairpin, 4.5 μM EtBr, and 0.75 to 3 μM of DNA binding agent. The final buffer consisted of 10 mM Tris, pH 8.0, 100 mM NaCl. After incubation at 25 °C for 30 min, for each well fluorescence measurements were made (average of three measurements) on a Varian Cary Eclipse fluorescence plate reader (λEx 545 nm, λEm 595 nm). Compound assessments were conducted in triplicate (or more) with each well acting as its own control well (no agent = 100% fluorescence, no DNA = 0% fluorescence). Fluorescence readings are reported as a percent fluorescence decrease relative to the control wells.
Crystallization and Data Collection
The DNA oligonucleotides 5′-CTTAATTCGAATTAAG-3′ and 5′-CTTGAATGCATTCAAG-3′ containing two RT29 binding sites were synthesized by TriLink Biotechnologies (San Diego, CA) and purified in our laboratory. The RT29 binding site was placed four bases from the terminus to allow space for the drug to interact with the DNA (the first three base pairs of the oligonucleotide are involved in interactions with the protein). The “trityl-on” fraction was purified by reverse-phase HPLC, the trityl group was cleaved by treatment with acetic acid, and the oligonucleotide was extracted with ether. The “trityl-off” oligonucleotide was purified by HPLC, resuspended in 10 mM MgCl2/10mM HEPES pH 7.0, and annealed for crystallization studies by heating to 80°C followed by a slow cool to room temperature. The RT fragment (residues 24–278) was purified as described previously.22 Briefly, the N-terminal-6XHis-tagged protein was overexpressed in E. coli and purified using Ni-NTA superflow followed by Mono-S ion-exchange chromatography. The 6XHis-tag was removed by thrombin digestion, and the protein was purified again by Mono-S ion-exchange chromatography (about 5–10 mg per 1L culture). Finally, the protein was concentrated to about 2 mM in 0.3 M NaCl/100 mM HEPES pH 7.5 for use in crystallization experiments.
RT-DNA crystals were grown by hanging drop vapor crystallization at 20° C in 7% PEG 4000, 5mM magnesium acetate and 50 mM ADA pH 6.5 from a 1:1.8 ratio of protein:DNA. The crystals were approximately 60 × 160 × 200 μm3. These crystals were used to microseed RT-DNA-RT29 crystals containing RT29 in 2-fold AATT or 3-fold ATTC excess of the DNA that crystallized under the same conditions by addition of RT29 to the DNA prior to crystallization. Using the microseeding technique allows us to crystallize any sequence of DNA and obtain diffraction-quality crystals within several days. Stock concentrations of the components were 1.8 mM RT in 50 mM MES pH 6.0/0.3 M NaCl, 2.5 mM oligonucleotide in 10 mM HEPES pH 7.0/10 mM MgCl2, and 25 mM RT29 in 25% DMSO/10 mM HEPES pH 7.0/10 mM MgCl2. Final concentrations in the drop were 0.4 mM RT, 0.7 mM DNA and 1.5 mM AATT or 2 mM ATTC RT29. The RT-DNA crystals were stabilized in 20% ethylene glycol, 9% PEG 4000, 5 mM magnesium acetate and 100 mM HEPES pH 8.0. Additional cryosoaks containing 0.5 mM and 1 mM RT29 were performed for the drug complex crystals. A 1.8 Å data set for the RT-AATT crystals was previously collected at beamline 19-BM of the Advanced Photon Source (APS) (Argonne, IL) (space group P21212, unit cell parameters a = 54.93 Å, b = 145.75 Å, c = 46.86 Å).17 Data for the RT-AATT-RT29 crystals were collected at home on an R-axis IV++ image plate detector mounted on an RU-H2R rotating anode with an X-stream cryo-cooling system (Table 1). The limit of usable diffraction data for the RT29 complex was 2.05 Å on the R-axis IV++, which is of sufficiently high resolution to determine a detailed structure of the complex (unit cell parameters a = 54.55, b = 145.65, c = 46.84 Å). The RT-ATTC crystal was also collected at home and diffracted to ~1.95 Å (unit cell parameters a = 54.95 Å, b = 145.65 Å, c = 46.81 Å), while data for the RT-ATTC-RT29 crystals were collected at the APS beamline 19-ID to 1.8 Å resolution (unit cell parameters a = 54.75 Å, b = 145.45 Å, c = 46.86 Å). Data were integrated and processed with the HKL2000 package.33 See Table 1 for data processing and refinement statistics.
Structure Determination and Refinement
The crystal structures of RT-AATT, RT-ATTC and complexes with RT29 were determined by molecular replacement with AmoRe34 using the refined model of the N-terminal fragment of MMLV RT as the search model (1N4L.pdb20). This model was subjected to rigid-body, positional, and B-factor refinement using the data collected from protein-DNA crystals to obtain unbiased electron density of the DNA. Coordinates for the B-form DNA model of the desired DNA sequence were generated using Nucleic Acid Builder35 and subsequently manually adjusted to fit the electron density using O36 followed by addition of the water molecules and further refinement. For data collected from crystals containing RT29, we performed molecular replacement and DNA modeling as described above followed by initial addition of water molecules. Next we modeled RT29 into the density map starting with an energy minimized model of RT29. Previous structural studies of netropsin-DNA interactions using the host-guest approach revealed that the best way to identify drug orientation in this system is according to the initial electron density difference maps.17 Our initial Fo-Fc map calculated before addition of the RT29 molecule displayed density suggesting the position of the phenylamidine and the phenyl-linked benzimidazole moieties. Initial refinement of the RT29 in the reverse orientation resulted in positive peaks near the phenylamidine (where the benzimidazole nitrogen and amidine tail are positioned in the correct RT29 orientation) and a negative peak at the benzimidazole moiety (where the smaller phenylamidine moiety is located in the correct RT29 orientation) (data not shown). Thus, we were able to determine the directionality of RT29 based on the density after addition of the DNA to the starting model. RT29 density improved with refinement for each DNA-RT29 complex. Alternate cycles of model building using O36 and refinement using calculations in CNS37 were completed until the observed and calculated structure factors were close to convergence and there were no large peaks remaining in the Fo-Fc electron density maps. The final RT29 model was verified using SA omit map analysis.37
Coordinates have been deposited with the PDB and have the following accession numbers: RT-AATT, 1ZTW; RT-AATT-RT29, 2FJV; RT-ATTC, 2FJW; and RT-ATTC-RT29, 2FJX.
Supplementary Material
SPR sensorgrams, the conditions employed, and four tables of crystallographic details. This material is available free of charge via the Internet at http://pubs.acs.org.
Acknowledgments
We thank Steve Ginell, Marianne Cuff and Andrzej Joachimiak from the Structural Biology Center Collaborative Access Team at the Advanced Photon Source and the members of the Georgiadis and Long laboratories for helpful discussions. Data were collected at beamlines 19-BM and 19-ID in the facilities of the SBC-CAT at APS. Use of the Argonne National Laboratory Structural Biology Center beamline at the Advanced Photon Source was supported by the U. S. Department of Energy, Office of Energy Research, under Contract No. W-31-109-ENG-38. We thank the National Institutes of Health for financial support of this work (GM 62831 to E.C.L., GM 55026 to M.M.G., and AI 064200 to W.D.W).
References
- 1.Neidle S. Nat Prod Rep. 2001;18:291–309. doi: 10.1039/a705982e. [DOI] [PubMed] [Google Scholar]
- 2.Zimmer C, Wahnert U. Prog Biophys Mol Biol. 1986;47:31–112. doi: 10.1016/0079-6107(86)90005-2. [DOI] [PubMed] [Google Scholar]
- 3.Bailly C, Chaires JB. Bioconj Chem. 1998;9:513–538. doi: 10.1021/bc980008m. [DOI] [PubMed] [Google Scholar]
- 4.Waring MJ. In: Molecular Aspects of Anticancer Drug-DNA Interactions. Neidle S, Waring MJ, editors. Vol. 1. Macmillan; London, UK: 1993. pp. 212–242. [Google Scholar]
- 5.Claussen CA, Long EC. Chem Rev. 1999;99:2797–2816. doi: 10.1021/cr980449z. [DOI] [PubMed] [Google Scholar]
- 6.Dervan PB, Burli RW. Curr Opin Chem Biol. 1999;3:688–693. doi: 10.1016/s1367-5931(99)00027-7. [DOI] [PubMed] [Google Scholar]
- 7.Reddy BS, Sondhi SM, Lown JW. Pharmacol Ther. 1999;84:1–111. doi: 10.1016/s0163-7258(99)00021-2. [DOI] [PubMed] [Google Scholar]
- 8.Tidwell RR, Boykin DW. In: DNA and RNA Binders: From small molecules to drugs. Demeunynck M, Bailly C, Wilson DD, editors. Vol. 2. Wiley-VCH; Weinheim: 2003. pp. 414–460. [Google Scholar]
- 9.Thurston DE. Br J Cancer. 1999;80(Suppl 1):65–85. [PubMed] [Google Scholar]
- 10.Browne MJ, Thurlbey PL. Genomes, Molecular Biology and Dug Discovery. Academic; London: 1996. [Google Scholar]
- 11.Huang X, Pieczko ME, Long EC. Biochemistry. 1999;38:2160–2166. doi: 10.1021/bi982587o. [DOI] [PubMed] [Google Scholar]
- 12.Boger DL, Fink BE, Hedrick MP. J Am Chem Soc. 2000;122:6382–6394. [Google Scholar]
- 13.Boger DL, Dechantsreiter MA, Ishii T, Fink BE, Hedrick MP. Bioorg Med Chem. 2000;8:2049–2057. doi: 10.1016/s0968-0896(00)00137-1. [DOI] [PubMed] [Google Scholar]
- 14.Hecht SM. Eur J Cancer. 2002;38:S13–S14. [Google Scholar]
- 15.Tse W, Boger DL. Acc Chem Res. 2004;37:61–69. doi: 10.1021/ar030113y. [DOI] [PubMed] [Google Scholar]
- 16.Fox KR. In: Methods in Molecular Biology. Fox KR, editor. Humana Press; Totowa, NJ: 1997. p. 90. [Google Scholar]
- 17.Goodwin KD, Long EC, Georgiadis MM. Nucleic Acids Res. 2005;33:4106–4116. doi: 10.1093/nar/gki717. [DOI] [PMC free article] [PubMed] [Google Scholar]
- 18.Cote ML, Yohannan SJ, Georgiadis MM. Acta Cryst D. 2000;56( Pt 9):1120–1131. doi: 10.1107/s0907444900008246. [DOI] [PubMed] [Google Scholar]
- 19.Cote ML, Georgiadis MM. Acta Cryst D. 2001;57:1238–1250. doi: 10.1107/s090744490100943x. [DOI] [PubMed] [Google Scholar]
- 20.Cote ML, Pflomm M, Georgiadis MM. J Mol Biol. 2003;330:57–74. doi: 10.1016/s0022-2836(03)00554-0. [DOI] [PubMed] [Google Scholar]
- 21.Najmudin S, Cote ML, Sun D, Yohannan S, Montano SP, Gu J, Georgiadis MM. J Mol Biol. 2000;296:613–632. doi: 10.1006/jmbi.1999.3477. [DOI] [PubMed] [Google Scholar]
- 22.Sun D, Jessen S, Liu C, Liu X, Najmudin S, Georgiadis MM. Protein Sci. 1998;7:1575–1582. doi: 10.1002/pro.5560070711. [DOI] [PMC free article] [PubMed] [Google Scholar]
- 23.Ferre-D’Amare AR, Zhou K, Doudna JA. J Mol Biol. 1998;279:621–631. doi: 10.1006/jmbi.1998.1789. [DOI] [PubMed] [Google Scholar]
- 24.Ferre-D’Amare AR, Doudna JA. J Mol Biol. 2000;295:541–556. doi: 10.1006/jmbi.1999.3398. [DOI] [PubMed] [Google Scholar]
- 25.The H-G method does not include any time advantage for completion of the crystallographic refinement, which takes approximately 2 weeks.
- 26.Lewis MA, Long EC. Bioorg Med Chem. 2006;14:3481–3490. doi: 10.1016/j.bmc.2006.01.006. [DOI] [PubMed] [Google Scholar]
- 27.Three sequences were analyzed by SPR: AATT and ATTC, representing high affinity sites discovered by the HT-FID analysis, and AGAT representing a “scrambled” control sequence not among the top 20 sites identified. The association constants determined (in 0.2 M NaCl) for these sites were: AATT, K = 6 × 10⁸ M−1; ATTC, K = 4 × 10⁷ M−1; and AGAT, K = 3 × 10⁶ M−1. Additional information and SPR sensorgrams are provided in Supporting Information.
- 28.Lu XJ, Olson WK. Nucleic Acids Res. 2003;31:5108–5121. doi: 10.1093/nar/gkg680. [DOI] [PMC free article] [PubMed] [Google Scholar]
- 29.Geometry-optimized structures were obtained by means of ab initio calculations with the Hartree Fock approximation at the 321G* basis set level. Calculations were performed with the Spartan ‘04 software package (Wavefunction, Inc.).
- 30.Bostock-Smith CE, Harris SA, Laughton CA, Searle MS. Nucleic Acids Res. 2001;29:693–702. doi: 10.1093/nar/29.3.693. [DOI] [PMC free article] [PubMed] [Google Scholar]
- 31.Bailly C, Chessari G, Carrasco C, Joubert A, Mann J, Wilson WD, Neidle S. Nucleic Acids Res. 2003;31:1514–1524. doi: 10.1093/nar/gkg237. [DOI] [PMC free article] [PubMed] [Google Scholar]
- 32.Tidwell RR, Geratz JD, Dann O, Volz G, Zeh D, Loewe H. J Med Chem. 1978;21:613–623. doi: 10.1021/jm00205a005. [DOI] [PubMed] [Google Scholar]
- 33.Otwinowski Z, Minor W. In: Macromolecular Crystallography, part A. Carter JCW, Sweet RM, editors. Vol. 276. Academic Press; New York: 1997. pp. 307–326. [Google Scholar]
- 34.Navaza J. Acta Cryst A. 1994;50:157–163. [Google Scholar]
- 35.Macke T, Case DA. In: Molecular Modeling of Nucleic Acids. Leontes NB, SantaLucia JJ, editors. Vol. 1. American Chemical Society; Washington, D.C: 1998. pp. 379–393. [Google Scholar]
- 36.Jones TA, Zou JY, Cowan SW, Kjeldgaard M. Acta Cryst A. 1991;47:110–119. doi: 10.1107/s0108767390010224. [DOI] [PubMed] [Google Scholar]
- 37.Brunger AT, Adams PD, Clore GM, DeLano WL, Gros P, Grosse-Kunstleve RW, Jiang JS, Kuszewski J, Nilges M, Pannu NS, Read RJ, Rice LM, Simonson T, Warren GL. Acta Cryst D. 1998;54:905–921. doi: 10.1107/s0907444998003254. [DOI] [PubMed] [Google Scholar]
Associated Data
This section collects any data citations, data availability statements, or supplementary materials included in this article.
Supplementary Materials
SPR sensorgrams, the conditions employed, and four tables of crystallographic details. This material is available free of charge via the Internet at http://pubs.acs.org.


