

Abstract
A series of iron chelators, three (S)-4,5-dihydro-2-(2-hydroxyphenyl)-4-methyl-4-thiazolecarboxylic acid (DADFT) and three (S)-4,5-dihydro-2-(2-hydroxyphenyl)-4-thiazolecarboxylic acid (DADMDFT) analogues are synthesized and assessed for their lipophilicity (log Papp), iron-clearing efficiency (ICE) in rodents and iron-loaded primates (Cebus apella), toxicity in rodents, and organ distribution in rodents. The results lead to a number of generalizations useful in chelator design strategies. In rodents, while log Papp is a good predictor of a chelator’s ICE, chelator liver concentration is a better tool. In primates, log Papp is a good predictor of ICE, but only when comparing structurally very similar chelators. There is a profound difference in toxicity between the DADMDFT and DADFT series: DADMDFTs are less toxic. Within the DADFT family of ligands, the more lipophilic ligands are generally more toxic. Lipophilicity can have a profound effect on ligand organ distribution, and ligands can thus be targeted to organs compromised in iron overload disease, e.g., the heart.
Introduction
Iron is essential to redox processes in all prokaryotes and eukaryotes. Although this element comprises 5% of the earth’s crust, living systems have great difficulty in accessing and managing this vital micronutrient. The low solubility of Fe(III) hydroxide (Ksp = 1 × 10−39),1 the predominant form of the metal in the biosphere, has led to the development of sophisticated iron storage and transport systems in nature. Microorganisms utilize low molecular weight, virtually ferric iron-specific ligands, siderophores;2 higher eukaryotes tend to employ proteins to transport and store iron (e.g., transferrin and ferritin, respectively).3–5
Higher life forms, e.g., humans, have developed a highly efficient iron management system in which we absorb and excrete only about 1 mg of the metal daily; there is no mechanism for the excretion of excess iron.6 Whether a systemic or a focal problem, the toxicity associated with excess iron derives from its interaction with reactive oxygen species, for instance, endogenous hydrogen peroxide (H2O2).7–10 In the presence of Fe(II), H2O2 is reduced to the hydroxyl radical (HO•) and HO−, a process known as the Fenton reaction. The hydroxyl radical reacts very quickly with a variety of cellular constituents and can initiate free radicals and radical-mediated chain processes that damage DNA and membranes, as well as produce carcinogens.8,11,12 The Fe(III) liberated in the peroxide reduction can be converted back to Fe(II) via a variety of biological reductants (e.g., ascorbate), a problematic cycle.
Whether derived from transfused red blood cells13–15 or from increased absorption of dietary iron,16,17 without effective treatment, body iron progressively increases with deposition in the liver, heart, pancreas, and elsewhere. Iron accumulation eventually produces liver disease that may progress to cirrhosis,18–20 diabetes related both to iron-induced decreases in pancreatic β-cell secretion and increases in hepatic insulin resistance,21,22 and heart disease, still the leading cause of death in thalassemia major and related forms of transfusional iron overload.6,23,24 The precise pathways of iron deposition and its regulation are incompletely understood, but the available evidence suggests that these differ in the liver, physiologically a major systemic iron depot, and in the pancreas and heart, which normally do not serve as iron storage sites. Nontransferrin-bound plasma iron (NTBI), a heterogeneous pool of iron in the circulation that is not bound to the physiological iron transporter, transferrin, seems to be a principal source of the abnormal tissue distribution of iron that develops with chronic iron overload. NTBI is rapidly taken up by hepatocytes in the liver, the major iron storage organ, perhaps through the divalent metal transporter 125 and other pathways that remain poorly characterized. NTBI also seems to gain entry into cardiomyocytes, pancreatic β-cells, and anterior pituitary cells specifically via L-type voltage-dependent Ca2+ channels not found in hepatocytes or Kupffer cells.26 These differences in modes of iron uptake also may underlie clinical observations of differences in the course and pace of iron deposition and damage to the liver, pancreas, and heart in patients with all forms of iron overload.6
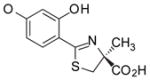
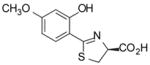
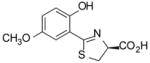
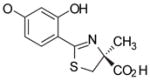
In the majority of patients with thalassemia major or other transfusion-dependent refractory anemias, the severity of the anemia precludes phlebotomy therapy as a means of removing toxic accumulations of iron. Treatment with a chelating agent capable of sequestering iron and permitting its excretion from the body is then the only therapeutic approach available. The iron-chelating agents now in use or under clinical evaluation are desferrioxamine B mesylate (DFO), 1,2-dimethyl-3-hydroxypyridin-4-one (deferiprone, L1), 4-[3,5-bis(2-hydroxyphenyl)-1,2,4-triazol-1-yl]benzoic acid (deferasirox, ICL670A), and our own desferrithiocin (DFT) analogue, (S)-2-(2,4-dihydroxyphenyl)-4,5-dihydro-4-methyl-4-thiazolecarboxylic acid [deferitrin, (S)-4′-(HO)-DADFT, 1, Table 1] Each of these agents chelates iron derived predominantly from systemic storage sites, either from iron released by macrophages after catabolism of senescent red blood cells, from iron in hepatic pools, or from both.27
Table 1.
Desferrithiocin Analogues’ Iron-Clearing Activity when Administered Orally to Rodents and the Partition Coefficients of the Compounds
| Desaza Series | Desazadesmethyl Series | ||||
|---|---|---|---|---|---|
| Desferrithiocin Analogue | Iron Clearing Efficiency (%)a | log Pappb | Desferrithiocin Analogue | Iron Clearing Efficiency (%)a | log Pappb |
(S)-4′-(HO)-DADFT, 1 |
1.1 ± 0.8c [100/0] | −1.05 |
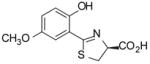
(S)-4′-(HO)-DADMDFT, 7 |
2.9 ± 2.8d [100/0] | −1.33 |
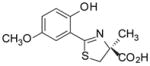
(S)-4′-(CH3O)-DADFT, 2 |
6.6 ± 2.8c [98/2] | −0.70 |

(S)-4′-(CH3O)-DADMDFT, 8 |
11.6 ± 5.1 [99/1] | −0.89 |
(S)-5′-(HO)-DADFT, 3 |
1.0 ± 0.9 [99/1] | −1.14 |
(S)-5′-(HO)-DADMDFT, 9 |
< 0.05 | −1.52 |
(S)-5′-(CH3O)-DADFT, 4 |
6.3 ± 1.2 [95/5] | −0.61 |
(S)-5′-(CH3O)-DADMDFT, 10 |
8.9 ± 3.8 [97/3] | −0.81 |
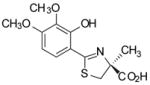
(S)-3′,4′-(CH3O)2-DADFT, 5 |
16.6 ± 8.6e [99/1] | −0.95 |
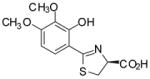
(S)-3′,4′-(CH3O)2-DADMDFT, 11 |
11.9 ± 1.0 [97/3] | −1.28 |

(S)-4′-(HO)-DADFT-PE, 6 |
5.5 ± 1.9c [90/10] | −1.10 | |||
In the rodents [n = 3 (9), 4 (2, 3, 4, 7, 8, 11), 5 (5, 6, 10), or 8 (1)], the dose was 150 μmol/kg for 9 and 300 μmol/kg for 1–8, 10–11. The compounds were solubilized in either distilled water (6), 40% Cremophor (7 and 9), or were given as their monosodium salts, prepared by the addition of 1 equivalent of NaOH to a suspension of the free acid in distilled water (1–5, 8, 10–11). The efficiency of each compound was calculated by subtracting the iron excretion of control animals from the iron excretion of the treated animals. This number was then divided by the theoretical output; the result is expressed as a percent. The relative percentages of the iron excreted in the bile and urine are in brackets.
Data are expressed as the log of the fraction in the octanol layer (log Papp); measurements were done in TRIS buffer, pH 7.4, using a “shake flask” direct method. The values obtained for compounds 1, 2, 7, 8 are from ref 38; the value for 6 is from ref 39.
Data are from ref 39.
Data are from ref 52.
ICE is based on a 48 h sample collection.
In patients, treatment with DFO can sometimes improve cardiomyopathy within days, before the total iron burden could have changed appreciably.28 Nonetheless, the amounts of iron removed from the heart are small; daily 24-hour infusions of DFO are then required for periods of years to reverse iron-induced heart disease completely.28 The efficacy of deferiprone in patients with heart disease remains uncertain, and deferasirox likely does not enter the heart in appreciable amounts. In any event, almost daily administration of near maximal tolerated doses of the first three agents is required to keep pace with rates of transfusional iron loading in patients with thalassemia major and other refractory anemias29 and thereby minimize the amounts of circulating NTBI. Consequently, there is a pressing need for the continued development of new iron-chelating agents that are more efficient and that can selectively remove iron from organs and tissues especially vulnerable to iron-induced toxicity. Ligands that are more efficient would be able to more rapidly reduce dangerous body iron burdens to safer levels and forestall the development or progression of complications. Iron-chelating agents that could selectively enter cardiac, pancreatic, or hepatic cells could help immediately reduce toxic iron pools and provide prompt protection against the progression of injury. This is especially true with respect to heart disease, still the cause of death in 70% or more of patients with thalassemia major;13,23,24 the development of such agents could be life-saving.
Results and Discussion
Design Concept
DFT is a tridentate siderophore30 that forms a stable 2:1 complex with Fe(III)31,32 and clears the metal well when the ligand is given orally (po) in both the bile duct-cannulated rodent model (iron-clearing efficiency, ICE, 5.5%)33 and in the iron-overloaded Cebus apella primate (ICE, 16%).34,35 However, DFT is severely nephrotoxic.35 Nevertheless, its oral activity spurred a structure–activity study focused on identifying an orally active and safe DFT analogue.
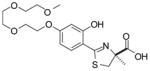
The structure–activity study first entailed simplifying the platform. For example, removal of the pyridine nitrogen of DFT led to (S)-4,5-dihydro-2-(2-hydroxyphenyl)-4-methyl-4-thiazolecarboxylic acid [(S)-DADFT], still a very effective iron chelator, although the ligand now presented with gastrointestinal toxicity rather than nephrotoxicity.36 It was next demonstrated that hydroxylation of this and related desaza ligands was compatible with iron clearance in the primate model and provided much less toxic chelators.36–38 As previously mentioned, one of these ligands, (S)-4′-(HO)-DADFT (1) (Table 1), is now in clinical trials for treatment of iron overload. However, animal studies indicate that the dose-limiting toxicity of this chelator will still likely be nephrotoxicity.37 Although the origin of the nephrotoxicity is unclear, the target seems to be centered largely in the proximal tubules. Recently, we were able to show that conversion of 1 to the corresponding polyether (S)-4,5-dihydro-2-[2-hydroxy-4-(3,6,9-trioxadecyloxy)phenyl]-4-methyl-4-thiazolecarboxylic acid [(S)-4′-(HO)-DADFT-PE, 6, Table 1] ameliorated much of the problem simply by reducing the level of drug in the kidney. The polyether had a substantially better ICE in both the rat and the primate than the parent drug (1) and greatly reduced nephrotoxicity.39
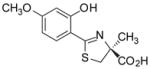
In the course of our structure–activity studies focused on developing an acceptable toxicity profile, the significance of lipophilicity, log Papp, in chelator design became apparent. The ligands’ log Papp often correlated with iron-clearing efficiency (Tables 1 and 2), toxicity (Table 3), and organ distribution (Figures 1 and 2). Within a series, or family, of ligands the more lipophilic compounds generally have better iron-clearing efficiency, i.e., the larger the log Papp value of the compound, the greater the iron-clearing efficiency. As will be seen below, the impact of lipophilicity on chelator toxicity can be very significant although it is very much dependent on the family of ligands. Finally, data consistently shows lipophilicity to have a profound effect on organ distribution of the chelator (Figures 1 and 2); the more lipophilic ligands typically achieve higher concentrations of drug and/or remain longer in organs. For example, (S)-4,5-dihydro-2-(2-hydroxy-4-methoxyphenyl)-4-methyl-4-thiazolecarboxylic acid [(S)-4′-(CH3O)-DADFT, 2] achieves between two and three times the concentration of chelator in the heart and pancreas than does administration of the parent (S)-4′-(HO)-DADFT (1) (Figure 1). If it were not for the poor toxicity profile of 2,39 it might be of great value for removing cardiac iron.
Table 2.
Desferrithiocin Analogues’ Iron-Clearing Activity when Administered Orally to Cebus apella Primates and the Partition Coefficients of the Compounds
| Desaza Series | Desazadesmethyl Series | ||||
|---|---|---|---|---|---|
| Desferrithiocin Analogue | Iron Clearing Efficiency (%)a | log Pappb | Desferrithiocin Analogue | Iron Clearing Efficiency (%)a | log Pappb |
(S)-4′-(HO)-DADFT, 1 |
16.8 ± 7.2c [88/12] | −1.05 |
(S)-4′-(HO)-DADMDFT, 7 |
4.2 ± 1.4d [70/30] | −1.33 |
(S)-4′-(CH3O)-DADFT, 2 |
24.4 ± 10.8e [91/9] | −0.70 |
(S)-4′-(CH3O)-DADMDFT, 8 |
16.2 ± 3.2e [81/19] | −0.89 |
(S)-5′-(HO)-DADFT, 3 |
12.6 ± 3.0 [88/12] | −1.14 |
(S)-5′-(HO)-DADMDFT, 9 |
1.8 ± 0.8 [97/3] | −1.52 |
(S)-5′-(CH3O)-DADFT, 4 |
18.9 ± 2.3 [94/6] | −0.61 |
(S)-5′-(CH3O)-DADMDFT, 10 |
12.0 ± 6.6 [97/3] | −0.81 |
(S)-3′,4′-(CH3O)2-DADFT, 5 |
Not Testedf | −0.95 |
(S)-3′,4′-(CH3O)2-DADMDFT, 11 |
12.4 ± 6.3 | −1.28 |
(S)-4′-(HO)-DADFT-PE, 6 |
25.4 ± 7.4g [96/4] | −1.10 | |||
In the monkeys [n = 4 (3, 4, 6–9), 3 (10), 6 (1, 11), or 7 (2)], the dose was 150 μmol/kg. The compounds were solubilized in either distilled water (6), 40% Cremophor (2, 7, 8), or were given as their monosodium salts, prepared by the addition of 1 equivalent of NaOH to a suspension of the free acid in distilled water (1, 3, 4, 9–11). The efficiency of each compound was calculated by averaging the iron output for 4 days before the administration of the drug, subtracting these numbers from the 2-day iron clearance after the administration of the drug, and then dividing by the theoretical output; the result is expressed as a percent. The relative percentages of the iron excreted in the stool and urine are in brackets.
Data are expressed as the log of the fraction in the octanol layer (log Papp); measurements were done in TRIS buffer, pH 7.4, using a “shake flask” direct method. The values obtained for compounds 1, 2, 7, 8 are from ref 38; the value for 6 is from ref 39.
Data are from ref 37.
Data are from ref 36.
Data are from ref 38.
Not tested in the primates due to acute toxicity in mice (data not shown).
Data are from ref 39.
Table 3.
Partition Coefficients and Rodent Tolerability of DADFT and DADMDFT Analogues
| Desaza Series | Desazadesmethyl Series | ||||
|---|---|---|---|---|---|
| Desferrithiocin Analogue | Log Pappb | Tolerabilitya | Desferrithiocin Analogue | Log Pappb | Tolerabilitya |
(S)-4′-(HO)-DADFT, 1 |
−1.05 | All survived.b |
(S)-4′-(HO)-DADMDFT, 7 |
−1.33 | All survived.b |
(S)-4′-(CH3O)-DADFT, 2 |
−0.70 | All dead by day 6.c |

(S)-4′-(CH3O)-DADMDFT, 8 |
−0.89 | All survived.d |
(S)-5′-(HO)-DADFT, 3 |
−1.14 | All survived. |

(S)-5′-(HO)-DADMDFT, 9 |
−1.52 | All survived. |
(S)-5′-(CH3O)-DADFT, 4 |
−0.61 | All dead by day 7. |
(S)-5′-(CH3O)-DADMDFT, 10 |
−0.81 | All survived. |
(S)-3′,4′-(CH3O)2-DADFT, 5 |
−0.95 | All dead by day 10. |
(S)-3′,4′-(CH3O)2-DADMDFT, 11 |
−1.28 | All survived. |
(S)-4′-(HO)-DADFT-PE, 6 |
−1.10 | All survived.c | |||
Figure 1.

Tissue distribution in plasma, kidney, liver, heart and pancreas of rats treated with DADFT analogues 1–5 given sc at a dose of 300 μmol/kg. The concentration (y-axis) are reported as μM (plasma) or as nmol compound per g wet weight of tissue. For all time points, n = 3. The demethylation in the liver of 2 ⇒ 1 is also shown.
Figure 2.

Tissue distribution in plasma, kidney, liver, heart and pancreas of rats treated with DADMDFT analogues 7–11 given sc at a dose of 300 μmol/kg. The concentration (y-axis) are reported as μM (plasma) or as nmol compound per g wet weight of tissue. For all time points, n = 3. The demethylation in the liver of 8 ⇒ 7 is also shown.
The current study further defines the role of ligand lipophilicity in iron-clearing efficiency, toxicity, and organ distribution with the intent of identifying ligands that achieve high and prolonged cardiac levels and present with an acceptable toxicity profile. Again, iron-mediated cardiac damage is the main cause of mortality in iron overload disease.
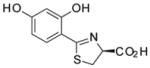
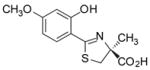
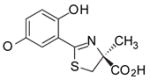
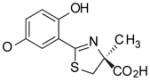
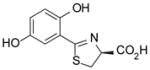
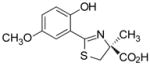
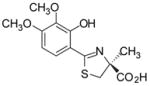
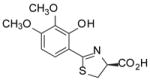
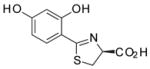
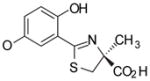
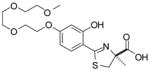
Two ligand families are assessed, the (S)-4,5-dihydro-2-(2-hydroxyphenyl)-4-methyl-4-thiazolecarboxylic acids (DADFTs, 1–6) and the (S)-4,5-dihydro-2-(2-hydroxyphenyl)-4-thiazolecarboxylic acids (DADMDFTs, 7–11) (Table 1). The new ligands in the DADFT series include (S)-2-(2,5-dihydroxyphenyl)-4,5-dihydro-4-methyl-4-thiazolecarboxylic acid [(S)-5′-(HO)-DADFT, 3], (S)-4,5-dihydro-2-(2-hydroxy-5-methoxyphenyl)-4-methyl-4-thiazolecarboxylic acid [(S)-5′-(CH3O)-DADFT, 4], and (S)-4,5-dihydro-2-(3,4-dimethoxy-2-hydroxyphenyl)-4-methyl-4-thiazolecarboxylic acid [(S)-3′,4′-(CH3O)2-DADFT, 5]. The new ligands in the DADMDFT series include (S)-2-(2,5-dihydroxyphenyl)-4,5-dihydro-4-thiazolecarboxylic acid [(S)-5′-(HO)-DADMDFT, 9], (S)-4,5-dihydro-2-(2-hydroxy-5-methoxyphenyl)-4-thiazolecarboxylic acid [(S)-5′-(CH3O)-DADMDFT, 10], and (S)-4–5-dihydro-2-(3,4-dimethoxy-2-hydroxyphenyl)-4-thiazolecarboxylic acid [(S)-3′,4′-(CH3O)2-DADMDFT, 11]. The DADMDFT chelators previously studied in this laboratory consist of (S)-2-(2,4-dihydroxyphenyl)-4,5-dihydro-4-thiazolecarboxylic acid [(S)-4′-(HO)-DADMDFT, 7]36 and (S)-4,5-dihydro-2-(2-hydroxy-4-methoxyphenyl)-4-thiazolecarboxylic acid [(S)-4′-(CH3O)-DADMDFT, 8].38
Synthetic Methods
Cyclocondensation of the appropriately substituted 2-hydroxybenzonitrile (12–14) with (S)-α-methyl cysteine (15) in aqueous CH3OH buffered at pH 6 furnished DADFTs 3–5; use of (S)-cysteine (16) instead gave the corresponding DADMDFTs 9–11 (Scheme 1). Treatment of 2,5-dimethoxybenzonitrile (17) with boron tribromide in CH2Cl2 produced 2,5-dihydroxybenzonitrile (12) in 80% yield (Scheme 2). Upon heating nitrile 12 with amino acid 15 or 16 near neutrality, (S)-5′-(HO)-DADFT (3) (97% yield) or (S)-5′-(HO)-DADMDFT (9) (75% yield), respectively, was obtained. 2-Hydroxy-5-methoxybenzonitrile (13),40 when heated with amino acid 15, led to (S)-5′-(CH3O)-DADFT (4) in 99% yield. Condensation of nitrile 13 with D-cysteine 16 gave (S)-5′-(CH3O)-DADMDFT (10) in 77% yield (Scheme 1). 3,4-Dimethoxy-2-hydroxybenzaldehyde (18)41,42 was converted to its oxime 19 in with refluxing 84% yield using hydroxylamine hydrochloride and NaOAc in CH3OH. Dehydration of 19 acetic anhydride and saponification of the aryl acetate intermediate gave 3,4-dimethoxy-2-hydroxybenzonitrile (14) in 82% yield (Scheme 3). Cyclization of amino acid 15 or 16 with aryl cyanide 14 at pH 6 produced (S)-3′,4′-(CH3O)2-DADFT (5) (60% yield) or (S)-3′,4′-(CH3O)2-DADMDFT (11) (76% yield), respectively (Scheme 1).
Scheme 1.

Synthesis of DADFTs 3–5 and DADMDFTs 9–11.a
aReagents: (a) CH3OH (aq), pH 6, heat, > 1 d.
Scheme 2.
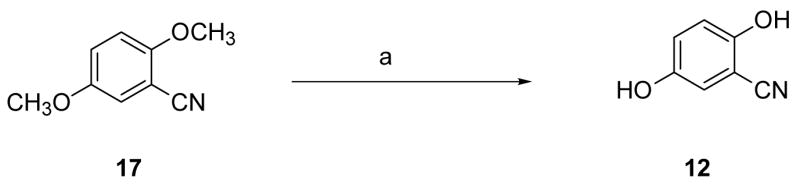
Preparation of 2,5-Dihydroxybenzonitrile (12).a
a Reagents: (a) BBr3, CH2Cl2 (80%).
Scheme 3.

Preparation of 3,4-Dimethoxy-2-hydroxybenzonitrile (14).a
a Reagents: (a) H2NOH HCl, NaOAc, CH3OH (84%); (b) Ac2O, reflux; (c) NaOH, CH3OH (aq) (82%).
Chelator-Induced Iron Clearance in Non Iron-Overloaded Rodents
Iron-clearing efficiencies of the compounds in rats are shown (Table 1), along with the relative fractions of the iron excreted in the bile and in the urine. A single 150 μmol/kg (9) or 300 μmol/kg (1–8, 10, 11) dose of drug was administered orally by gavage to male Sprague-Dawley rats. The data will be discussed within the sets of ligands, i.e., DADFT chelators [1, 2], [3, 4], [5], [6] and DADMDFT ligands [7, 8], [9, 10], [11]. Recall that iron clearing efficiency (ICE) is defined as (net iron excretion)/(total iron-binding capacity of the chelator), expressed as a percent. The previous studies with ligands [1, 2] and [7, 8] clearly indicated that the more lipophilic chelators had greater ICE values.43 In the current study with [3, 4] and [9, 10], again the more lipophilic ligand was the more efficient (4 > 3, p < 0.001 and 10 > 9, p < 0.003). While the polyether (6) follows the expected trend, the dimethoxy systems 5 and 11 were not well behaved within the DADFT and DADMDFT families; their ICEs were higher than anticipated. However, this apparent discrepancy may be explained by liver chelator concentrations (Figures 1 and 2). This is consistent with the idea that for the lipophilicity/ICE relationship to hold, the extent of aromatic ring functionalization must remain similar. Additionally, there was no clear trend between log Papp and modes of iron excretion, e.g., urinary vs biliary. Finally, it is noteworthy that moving 4′-hydroxyl of 7 to the 5′-position providing ligand 9 had a significant effect on both decreasing lipophilicity and reducing the ICE, 3% to < 0.05%, p < 0.05. This was not the case with ligands 1 and 3 of the DADFT series (Table 1). Although the log Papp of these ligands changed by a similar magnitude as 7 to 9, there was little effect on ICE (p > 0.05).
Relationship between Rodent ICE and Liver Chelator Concentration
In rodents, while the ICE of the monosubstituted DADFT and DADMDFT analogues correlated well with the lipophilicity of the ligands, this was not the case with the disubstituted chelators 5 and 11; their ICE was much higher than expected. However, an examination of the liver concentration of the DADFT ligands 0.5 h post-drug vs the ICE of the drugs (Figure 3) reveals that as the liver tissue concentration of the chelators increases, the ICE also increases (r2 = 0.965). This scenario was also seen with the DADMDFT analogues (r2 = 0.953, data not shown). Note that although the chelators were given sc in the tissue distribution studies and po in the ICE experiments, we have previously demonstrated, e.g., (S)-4′-(CH3O)-DADFT (2), that the ligands have a very high oral bioavailability and that there was little difference in the tissue distribution of po vs sc administered chelators.43 Thus, liver chelator concentration may be a more predictive tool of ICE in rodents than log Papp.
Figure 3.

Iron-clearing efficiency of DADFT analogues 1–5 plotted versus the liver chelator concentration. The rats were given a single 300 μmol/kg dose of the compounds po for the ICE determinations and sc for the tissue distribution studies.
Chelator-Induced Iron Clearance in Iron-Overloaded Primates
The drugs were given po to the monkeys at a dose of 150 μmol/kg (Table 2). In every instance the ligands’ ICE values were higher in iron-overloaded primates than in the non-iron-loaded rodents (Table 1). The difference in ICE values between species is not surprising in view of the larger, accessible iron pool in the iron-overloaded primates. Again, looking at the sets of DADFT chelators [1, 2], [3, 4], [6] and DADMDFT ligands [7, 8], [9, 10], [11] (Table 2), the trend is similar to the rodents regarding lipophilicity, with some leveling effect probably due to more available iron for chelation. With the sets [1, 2] and [7, 8], the more lipophilic molecules had the better ICE values.43 Again, the more lipophilic compounds are more active (3 vs 4, p < 0.01) and (9 vs 10, p = 0.05). However, with the polyether (6) there is a rather surprising jump in efficiency (Table 2). This polyether behaves more like its (S)-4′-(CH3O)-DADFT analogue (2) than would be predicted on the basis of lipophilicity. While we were unwilling to evaluate the iron clearance properties of dimethoxy DADFT analogue 5 in primates because of its unexpected acute toxicity in mice (not described), the dimethoxy DADMDFT analogue 11 was more efficient at iron clearance than would be predicted from its log Papp value.
Again, there was no clear relationship between modes of excretion, biliary vs urinary, and log Papp. Once again, it is noteworthy that a simple shift of the 4′-(HO) to the 5′ position decreased the ICE from 4% to 2% for the [7, 9] set (p < 0.02) and from 17% to 13% for the [1, 3] set, although the decrease was not significant (Table 2).
Relationship between Toxicity and Lipophilicity
The toxicity trials were carried out in male Sprague-Dawley rats. The animals were given the chelators orally by gavage at a dose of 384 μmol/kg/d for a maximum of 10 days. The dose, which is equivalent to 100 mg/kg of the DFT monosodium salt, was chosen in order to compare toxicity with previous data.37,39,43 There are two obvious relationships bearing on the toxicity profiles of the DFT analogues evaluated (Table 3): (1) the DADMDFT ligands (7–11) are generally less toxic than the corresponding DADFT series (1–5) and (2) while the DADMDFT ligand toxicity profiles are independent of partition properties, this is not the case with the DADFT analogues. Within the DADFT sets [1 vs 2] and [3 vs 4], the less lipophilic ligand was also the less toxic. When rodents were treated with DADFT chelators with log Papp values greater than −1.05 at 384 μmol/kg/d, all of the animals were dead before the end of the planned 10-day dosing regimen. This same relationship also held up with dimethoxy analogue (5) and the polyether (6). The polyether (log Papp = −1.10) was profoundly less toxic than 5 (Table 3). In each instance of mortality (2, 4, 5), the rats presented with nephrotoxicity, which was acute, diffuse, severe, and characterized by proximal tubular epithelial necrosis and sloughing.
Chelator Tissue Distribution in Rodents
The tissue distribution description will focus first on the DADFT ligands [1, 2], [3, 4], [5] (Figure 1) and next on the DADMDFT analogues [7, 8], [9, 10], [11] (Figure 2). In each instance we will consider plasma, kidney, liver, heart, and pancreas. In these studies, the rats were given a single 300 μmol/kg dose of the drug subcutaneously (sc). Subcutaneous administration was chosen in order to minimize potential complications surrounding differences in oral absorption.
Desazadesferrithiocin analogues
In the case of the DADFT analogues in the plasma (Figure 1), the more lipophilic systems achieve much higher concentrations and maintain them for a longer period of time. The parent drug (S)-4′-(HO)-DADFT (1) reaches a level of 92 μM at 0.5 h and drops to 13 μM at 2 h. The methoxy analogue 2 (plus its metabolite 1) reaches nearly eight times the level of the parent 1 (p < 0.002). Even at 8 h the concentration of the methoxy 2 is still as high as the initial level of the parent 1. A similar scenario is true for (S)-5′-(HO)-DADFT (3) and its methylated analogue (S)-5′-(CH3O)-DADFT (4). At 0.5 h the more lipophilic 4, at a concentration of 803 μM, reaches more than three times the concentration of 3 (p < 0.001). It is noteworthy that the 5′-substituted ligands achieve higher plasma levels than the 4′-substituted ligands (Figure 1). The (S)-3′,4′-(CH3O)2-DADFT analogue (5) achieves the highest initial plasma concentration of all of the DADFT analogues (907 μM, p < 0.001 for 1 and 3 and p < 0.05 for 2 and 4), although it is essentially gone by 8 h.
In the kidney the situation is a little different (Figure 1). The parent 1 and its methoxy analogue 2 achieve similar initial concentrations at 0.5 h (361 vs 282 nmol/g wet weight, respectively, p > 0.05). However at 1 h post-drug, 2 (plus its metabolite 1) is nearly three times the concentration of the parent 1 (518 vs 179 nmol/g wet weight, respectively, p < 0.002), then decreasing, although always at higher levels than the parent 1. A similar scenario holds for 5′-subsituted ligands (Figure 1). The 5′-hydroxy parent ligand 3 (1216 nmol/g wet weight) achieves over twice the concentration of the 5′-methoxy analogue 4 at 0.5 h (p < 0.002), although the parent drug 3 levels drop very quickly, by 98% at 2 h. Finally, the (S)-3′,4′-dimethoxy chelator (5) achieves the highest initial renal tissue concentration of all the DADFT analogues (1375 nmol/g wet weight, p < 0.001 for 1, 2, 4), although it drops quickly, almost mirroring the plasma levels.
The liver tissue concentrations for ligands 1–4 (Figure 1) display a trend similar to plasma at each time point; the more lipophilic methoxylated ligands achieve and maintain greater levels than the hydroxylated parent drugs. The parent 1 reaches 124 nmol/g wet weight at 0.5 h, while its methoxy analogue 2 (plus its metabolite 1) rises to 275 nmol/g wet weight (p < 0.05). The 5′-(HO) analogue 3 at 0.5 h is very similar to 1, while its 5′-(CH3O) analogue 4 achieves 382 nmol/g wet weight, p < 0.001 vs 3, (Figure 1). Again, the (S)-3′,4′-dimethoxy analogue (5) reaches the highest liver concentration (924 nmol/g wet weight, p <0.001 vs 1–4).
Cardiac ligand concentrations are lower than those seen in the plasma, kidney or liver (Figure 1). However, they again mirror both the plasma and liver concentrations with the more lipophilic ligands at higher levels. The highest cardiac levels are achieved by the (S)-3′,4′-dimethoxy analogue (5), 259 nmol/g wet weight at 0.5 h, (p < 0.003 for 1–3 and p < 0.03 vs 4), dropping to 3 nmol/g wet weight at 8 h. The next most effectively concentrated chelator was (S)-5′-(CH3O)-DADFT (4). Although its initial 0.5 h level, 208 nmol/g wet weight, was lower than 5, it surpassed 5 at 1 h and remained higher for 8 h.
Of all the tissues, the pancreas presented with the least amount of ligand accumulation (Figure 1). In this organ (S)-5′-(CH3O)-DADFT (4) achieved the highest tissue levels at all time points, although still reaching only 153 nmol/g wet weight at 1 h.
Desazadesmethyldesferrithiocin analogues
The DADMDFT analogues in the plasma (Figure 2) are similar to their DADFT counterparts (Figure 1); the more lipophilic systems achieve much higher concentrations and maintain them for a longer period of time. The less lipophilic parent drug (S)-4′-(HO)-DADMDFT (7) reaches a level of 209 μM at 0.5 h and drops to 5 μM at 2 h. The more lipophilic (S)-4′-(CH3O)-DADMDFT (8) (plus its metabolite 7) achieves a concentration of 774 μM at 0.5 h post drug (p <0.001). At 2 h the plasma concentration is still greater than 200 μM (Figure 2). A similar scenario is true for (S)-5′-(HO)-DADMDFT (9) and its methoxy analogue (S)-5′-(CH3O)-DADMDFT (10) (p < 0.001). It is noteworthy that while the 5′-substituted parent ligand 9 achieves a higher plasma level than its 4′-substituted counterpart 7, the difference between the 5′-substituted compounds (9 vs 10) is not as great as that seen with the 4′-substituted drugs (7 vs 8). The (S)-3′,4′-(CH3O)2-DADMDFT analogue (11) also achieves a high initial plasma concentration (695 μM), although it is essentially gone by 4 h.
The renal data for the DADMDFT series (Figure 2) is similar to the DADFT findings (Figure 1). Initially, 0.5 h, the less lipophilic parent ligands (S)-4′-(HO)-DADMDFT (7) (667 nmol/g wet weight) and (S)-5′-(HO)-DADMDFT (9) (629 nmol/g wet weight) are at levels slightly higher than their methoxy counterparts (8) and (10) respectively, though this difference was only significant with 9 vs 10, p < 0.05. However, the parent ligands 7 and 9 diminish far more quickly than the methoxy analogues (Figure 2). There is not nearly as great an initial difference in concentration between the dimethoxy analogue 11 and 7–10 as seen in the DADFT series (Figure 1). It is notable that at 0.5 h, (S)-4′-(HO)-DADMDFT (7) and (S)-4′-(CH3O)-DADMDFT (8) both reach over twice the level in kidney tissue as their DADFT counterparts 1 and 2 (Figures 1 and 2).
In the liver (Figure 2), the more lipophilic ligands achieve higher concentrations (8 > 7 and 10 > 9). The difference in concentration between the ligands is greater than in the renal tissue. The 4′-(CH3O) analogue 8 (plus its metabolite 7) rises to a level of 615 nmol/g wet weight, nearly three times that of the parent (7) 0.5 h post-drug (p < 0.001). In the case of the 5′-(CH3O) analogue, the concentration of 10, 564 nmol/g wet weight, reaches over three times that of the parent 9 (p < 0.01). The dimethoxy analogue 11 is greater in concentration than 7–10, (p < 0.001 for 7–9 and p < 0.02 vs 10) but drops off quickly. However, ligand 10 has the longest residence time (Figure 2).
The most notable observation in the DADMDFT series relates to cardiac and pancreatic drug levels (Figure 2). The cardiac tissue presents with the largest differences in concentration between the parent ligands and the methoxylated counterparts (8 ≫ 7, p < 0.002, and 10 ≫ 9, p < 0.002). It is particularly interesting that (S)-5′-(CH3O)-DADMDFT (10) achieves a level of 380 nmol/g wet weight at 0.5 h and remains at 61 nmol/g wet weight even at 4 h. Its parent 9 never rises above 42 nmol/g wet weight Furthermore, ligand 10 also reaches significantly higher concentrations than the (S)-3′,4′-dimethoxy chelator 11 (185 nmol/g wet weight, p < 0.001).
The scenario is slightly different with the pancreas (Figure 2). The concentration of the 4′-methoxylated ligand 8 (102 nmol/g wet weight) is slightly greater than its hydroxylated counterpart 7 (p < 0.05). However, analogue 10 reaches the highest concentration of any of the DADFT or DADMDFT analogues, 198 nmol/g wet weight, and is nearly five times greater than its hydroxylated counterpart 9 (p < 0.02). Even 4 h post-drug the tissue concentration is 45 nmol/g wet weight.
Conclusion
There is a pressing need for the continued development of new iron-chelating agents that are either more effective than currently available therapies and/or that can selectively remove iron from organs and tissues especially vulnerable to iron-induced toxicity. Iron-chelating agents that could selectively enter cardiac, pancreatic, or hepatic cells could help immediately reduce toxic iron pools and provide prompt protection against the progression of injury. This is especially true with respect to heart disease, still the leading cause of death in thalassemia major and related forms of transfusional iron overload; the development of such agents could be life-saving.
With early onset of iron overload in which there is no cardiac involvement, the simplest solution is global iron chelation, e.g., treatment with DFO or the triazole deferasirox. While it is true that neither of these ligands achieves notable levels in cardiac tissue, iron contained in all organ systems ultimately equilibrates as the metal is chelated and removed. Thus, cardiac iron is slowly removed, but is accessible. However, in a scenario in which iron overload has achieved critical levels in cardiac tissue, ligands which can selectively access this compartment become particularly attractive. The current study is focused on identifying chelators with such organ-specific access. A group of tricoordinate desferrithiocin analogues were assembled (Tables 1 and 2). The ligands belonged to one of two different families, (S)-4,5-dihydro-2-(2-hydroxyphenyl)-4-methyl-4-thiazolecarboxylic acid (DADFT) or (S)-4,5-dihydro-2-(2-hydroxyphenyl)-4-thiazolecarboxylic acid (DADMDFT) analogues. The chelators were easily assembled by cyclization of (S)-α-methyl cysteine or (S)-cysteine with the appropriate aromatic nitrile to provide the DADFTs or the DADMDFTs, respectively (Scheme 1). Both the physicochemical properties (log Papp) and biological properties—iron-clearing efficiency (ICE) in rodents and primates, toxicity in rodents, and organ distribution in rodents—were measured. The outcome of these measurements was compared and integrated with previous data on related desferrithiocin chelators. The results have led to a number of findings that are critical to future design strategies aimed at the development of organ-specific desferrithiocin ligands belonging to the DADFT or DADMDFT families.
First of all in rodents, while lipophilicity is a good indicator of how a ligand will perform as an iron chelator, it now seems that the level of the drug achieved in liver tissue (Figure 3) is better. Studies are underway in rodents that will hopefully demonstrate that cardiac ligand tissue levels (Figures 1 and 2) are also a credible indicator for how well a ligand will remove iron from the heart. Although log Papp is a good diagnostic tool for ICE in primates, it is only of value when comparing structurally very similar chelators.
Second, there are profound differences in the toxicity between the two families: the DADMDFTs are less toxic than the DADFTs. However, it is possible to impact the toxicity of the DADFTs by reducing their lipophilicity; the less lipophilic the ligand, the less toxic it is (1, 3, and 6 vs 2, 4, and 5, Table 3). The same changes in lipophilicity can have rather profound effects on organ distribution and residence time.
Finally, in the case of the DADFT set, the more lipophilic ligands (1 vs 2 and 3 vs 4) achieve and maintain the highest tissue levels, with the exception of the 0.5 hour time point in the kidneys. The dimethoxy analogue 5 achieves the highest tissue levels in plasma, kidney, liver, and heart. With the DADMDFT series (7 vs 8 and 9 vs 10), the situation is very similar. However, the dimethoxy ligand 11 no longer consistently achieves the highest tissue concentrations. What is most notable, however, is the level of chelator in the heart tissue in this family; the methoxy analogues 8 and 10 achieve and maintain much higher levels in cardiac tissue than their DADFT counterparts 2 and 4, respectively. The tissue distribution data of (S)-5′-(CH3O)-DADMDFT (10), coupled with its iron-clearing efficiency and toxicity profile, is consistent with the idea that 10 may well serve as an excellent ligand for removing iron from the heart and pancreas, two of the most important organs in iron overload.
Experimental Section
C. apella monkeys were obtained from World Wide Primates (Miami, FL). Male Sprague–Dawley rats were procured from Harlan Sprague–Dawley (Indianapolis, IN). Cremophor RH-40 was acquired from BASF (Parsippany, NJ). Ultrapure salts were purchased from Johnson Matthey Electronics (Royston, UK). All hematological and biochemical studies35 were performed by Antech Diagnostics (Tampa, FL). Atomic absorption (AA) measurements were made on a Perkin-Elmer model 5100 PC (Norwalk, CT). Histopathological analysis was carried out by Florida Vet Path (Bushnell, FL).
Cannulation of Bile Duct in Non-Iron-Overloaded Rats
The cannulation has been described previously.34,35 Bile samples were collected from male Sprague-Dawley rats (400–450 g) at 3-h intervals for up to 48 h. The urine sample(s) was taken at 24 h intervals. Sample collection and handling are as previously described.34,35
Iron Loading of C. apella Monkeys
The monkeys (3.5–4 kg) were iron overloaded with intravenous iron dextran as specified in earlier publications to provide about 500 mg of iron per kg of body weight;44 the serum transferrin iron saturation rose to between 70 and 80%. At least 20 half-lives, 60 d,45 elapsed before any of the animals were used in experiments evaluating iron-chelating agents.
Primate Fecal and Urine Samples
Fecal and urine samples were collected at 24-h intervals and processed as described previously.34,35,46 Briefly, the collections began 4 d prior to the administration of the test drug and continued for an additional 5 d after the drug was given. Iron concentrations were determined by flame atomic absorption spectroscopy as presented in other publications.34,47
Drug Preparation and Administration
In the iron clearing experiments the rats were given a single 150 μmol/kg (9) or 300 μmol/kg (1–8, 10–11) dose of the drugs orally (po). The compounds were administered as (1) a solution in water (6); (2) solubilized in 40% Cremophor RH-40/water (7, 9); or (3) the monosodium salt of the compound of interest (prepared by the addition of 1 equivalent of NaOH to a suspension of the free acid in distilled water) (1–5, 8, 10–11).
The drugs were given to the monkeys po at a dose of 150 μmol/kg. The drugs were prepared as for the rats, except that 2 and 8 were solubilized in 40% Cremophor RH-40/water, and compound 9 was administered as its monosodium salt.
Calculation of Iron Chelator Efficiency
The theoretical iron outputs of the chelators were generated on the basis of a 2:1 complex. The efficiencies in the rats and monkeys were calculated as set forth elsewhere.37 Data are presented as the mean ± the standard error of the mean; P-values were generated via a one-tailed Student’s t-test, in which the inequality of variances was assumed; and a P-value of < 0.05 was considered significant.
Toxicity Evaluation of DADFT and DADMDFT Analogues in Rodents
Male Sprague–Dawley rats (250–300 g) were fasted overnight and were given the DADFT ligands 3–5 and the DADMDFT compounds 9–11 po by gavage once daily for up to 10 d at a dose of 384 μmol/kg/d. This dose is equivalent to 100 mg/kg/d of the DFT sodium salt. The animals were fed ~3 h post-drug and had access to food for 5 h before being fasted overnight. Additional animals served as age-matched controls. The animals were monitored at least three times daily and those found in moribund condition were euthanized. Surviving rodents were sacrificed one day after the last dose and extensive tissues were sent out for histopathological analysis.
Collection of Tissue Distribution Samples from Rodents
Male Sprague–Dawley rats (250–350 g) were given a single sc injection of the monosodium salts of 1–5 and 7–11 prepared as described above at a dose of 300 μmol/kg. At times 0.5, 1, 2, 4, and 8 h after dosing (n = 3 rats per time gas. Blood was obtained via cardiac puncture into point) the animals were euthanized by exposure to CO2 vacutainers containing sodium citrate. The blood was centrifuged and the plasma separated for analysis. The liver, heart, kidneys and pancreas were then removed from the animals.
Tissue Analytical Methods
The tissue samples were prepared for HPLC analysis by homogenizing them in water at a ratio of 1:2 (w/v). Then, to precipitate proteins, three times the volume of CH3OH was added, and the mixture was stored at −20 °C for 20 min. This homogenate was centrifuged; the supernatant was filtered with a 0.2 μm membrane. The filtrate was injected directly onto the column or diluted with mobile phase A (95% buffer [25 mM KH2PO4, pH 3.0]:5% CH3CN), vortexed, and filtered as above prior to injection.
Analytical separation was performed on a Discovery RP Amide C16 HPLC system with UV detection at 310 nm as described previously.48,49 Mobile phase and chromatographic conditions were as follows: solvent A, 5% CH3CN:95% buffer; solvent B, 60% CH3CN:40% buffer.
The concentrations were calculated from the peak area fitted to calibration curves by nonweighted least squares linear regression with Rainin Dynamax HPLC Method Manager software (Rainin Instrument Co.). The method had a detection limit of 0.5 μM and was reproducible and linear over a range of 1–1000 μM.
Tissue distribution data are presented as the mean; P-values were generated via a one-tailed Student’s t-test, in which the inequality of variances was assumed; and a P-value of < 0.05 was considered significant.
Synthetic Methods
Compounds 1, 2, and 6–8 were synthesized using methods published by this laboratory.36–39 Amino acid 16 was obtained from Advanced ChemTech, Louisville, KY. Reagents were purchased from Aldrich Chemical Co. (Milwaukee, WI), and Fisher Optima-grade solvents were routinely used. Phosphate buffer was made up to a concentration of 0.1 M at a pH of 6.50 Reactions were run under a nitrogen atmosphere, and organic extracts were dried with sodium sulfate, which was filtered. Silica gel 40–63 from Silicycle, Inc. (Quebec City, QC, Canada) was used for flash column chromatography. Distilled solvents were employed for reactions involving chelators. Glassware that was presoaked in 3 N HCl for 15 min was used for the isolation of chelators. Melting points are uncorrected. Optical rotations were run at 589 nm (sodium D line) utilizing a Perkin-Elmer 341 polarimeter with c as g of compound per 100 mL of DMF (distilled) solution. 1H NMR spectra were measured at 400 MHz in DMSO-d6 (not indicated) or other deuterated solvents, and chemical shifts (δ) are presented in parts per million downfield from tetramethylsilane. Coupling constants (J) are in hertz. 13C NMR spectra were run at 100 MHz, and chemical shifts (δ) are given in parts per million referenced to the residual solvent resonance in DMSO-d6 (δ 39.52) or CD3OD (δ 49.00). Elemental analyses were performed by Atlantic Microlabs (Norcross, GA).
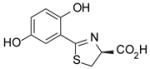
(S)-2-(2,5-Dihydroxyphenyl)-4,5-dihydro-4-methyl-4-thiazolecarboxylic Acid (3)
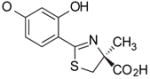
Compound 15 (12.2 g, 64.8 mmol) was added to a solution of 12 (5.40 g, 40.0 mmol) in degassed CH3OH (225 mL). Phosphate buffer (150 mL) and NaHCO3 (6.72 g, 80.0 mmol) were added, and the reactants were heated at 70 °C for 40 h with stirring under nitrogen. The reaction mixture was cooled to room temperature, and the solvents were removed by rotary evaporation. The residue was dissolved in saturated NaHCO3 (600 mL) and was washed with EtOAc (3 × 60 mL). The aqueous portion was acidified to pH 2 with cold concentrated HCl. Extraction with EtOAc (4 × 125 mL), solvent removal in vacuo, and recrystallization from EtOAc/hexanes gave 9.83 g (97%) of 3 as brownish yellow crystals, mp 223–224.5 °C: [α]24 +28.7° (c 1.01); 1H NMR δ 1.56 (s, 3 H), 3.36 (d, 1 H, J = 11.6), 3.79 (d, 1 H, J = 11.6), 6.80 (m, 2 H), 6.88 (m, 1 H), 9.17 (br s, 1 H), 11.72 (br s, 1 H), 13.21 (br s, 1 H); 13C NMR δ 24.04, 39.48, 83.01, 114.69, 115.23, 117.59, 121.54, 149.51, 151.29, 170.27, 173.61; HRMS m/z calcd for C11H12NO4S 254.0487 (M + H), found 254.0479. Anal. (C11H11NO4S) C, H, N.
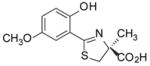
(S)-4,5-Dihydro-2-(2-hydroxy-5-methoxyphenyl)-4-methyl-4-thiazolecarboxylic Acid (4)
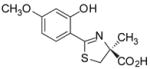
Sodium bicarbonate (3.88 g, 46.2 mmol) was added to a mixture of 1340 (4.607 g, 30.90 mmol), and 15 (6.96 g, 40.6 mmol) in degassed CH3OH (200 mL) and phosphate buffer (200 mL) to a pH of 6, and the reactants were heated at 60 °C for 2 d with stirring under nitrogen. The reaction mixture was cooled to room temperature, and the volume of the reaction mixture was reduced by rotary evaporation. Cold 0.2 M HCl (280 mL) was added to the residue, which was extracted with EtOAc (150 mL, 2 × 100 mL). The EtOAc layers were washed with saturated NaCl and were concentrated in vacuo to generate 8.21 g (99%) of 4 as yellow solid, mp 126.5–127.5 °C: [α]24 +25.9° (c 1.06); 1H NMR δ 1.59 (s, 3 H), 3.41 (d, 1 H, J =11.6), 3.74 (s, 3 H), 3.83 (d, 1 H, J = 12.0), 6.88 (d, 1 H, J= 3.2), 6.94 (d, 1 H, J= 8.8), 7.09 (dd, 1 H, J= 9.2, 3.2), 11.97 (s, 1 H), 13.23 (s, 1 H); 13C NMR (CD3OD) δ 24.65, 40.79, 56.30, 84.86, 114.63, 116.91, 118.86, 121.64, 153.57, 154.39, 172.56, 175.80; HRMS m/z calcd for C12H14NO4S 268.0644 (M + H), found 268.0630. Anal. (C12H13NO4S) C, H, N.
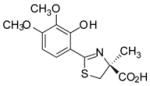
(S)-4,5-Dihydro-2-(3,4-dimethoxy-2-hydroxyphenyl)-4-methyl-4-thiazolecarboxylic Acid (5)
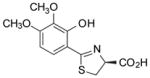
Sodium bicarbonate (3.50 g, 41.7 mmol) was added to a mixture of 14 (4.855 g, 27.09 mmol) and 15 (6.120 g, 35.66 mmol) in degassed CH3OH (180 mL) and phosphate buffer (180 mL) to a pH of 6, and the reactants were heated at 66 °C for 2 d 20 h with stirring under nitrogen. The reaction mixture was cooled to room temperature, and the volume of the reaction mixture was reduced by rotary evaporation. Cold 1 M HCl (70 mL) and saturated NaCl (20 mL) were added to the residue, which was extracted with EtOAc (150 mL, 2 × 50 mL). The EtOAc layers were washed with saturated NaCl (70 mL) and were concentrated in vacuo to crude 5, which was dissolved in DMF (135 mL). Iodoethane (3.0 mL, 38 mmol) and N,N-diisopropylethylamine (6.5 mL, 37 mmol) were introduced, and the solution was stirred for 1 d. After solvent removal under high vacuum, the residue was combined with 1:1 0.5 M citric acid/saturated NaCl (200 mL) and was extracted with EtOAc (200 mL, 3 × 50 mL). The combined extracts were washed with 80-mL portions of 0.25 M citric acid, 1% NaHSO3, H2O, and saturated NaCl, and solvent was evaporated. Purification by flash column chromatography using 24% EtOAc/pet ether gave the ethyl ester of 5 as a yellow oil: 1H NMR (CDCl3) δ 1.30 (t, 3 H, J = 7.0), 1.66 (s, 3 H), 3.20 (d, 1 H, J =11.4), 3.86 (d, 1 H, J = 11.4), 3.90 and 3.91 (2 s, 6 H), 4.19–4.30 (m, 2 H), 6.48 (d, 1 H, J= 9.0), 7.14 (d, 1 H, J= 9.0), 12.72 (s, 1 H). The oil was treated with a solution of 50% NaOH (18.64 g, 0.233 mol) and CH3OH (350 mL) with brief ice bath cooling. After stirring for 1 d at room temperature, solvents were removed by rotary evaporation. Dilute NaCl (210 mL) was added, followed by extraction 60 mL). Cold 2 N HCl (130 mL) was added to the aqueous layer, which was extracted with Et2O (3 × with EtOAc (170 mL, 3 × 80 mL). The EtOAc layers were washed with saturated NaCl (60 mL) and were concentrated in vacuo, furnishing 4.79 g (60%) of 5 as a light green solid: [α]24 +45.7° (c 1.16); 1H NMR δ 1.59 (s, 3 H), 3.37 (d, 1 H, J =11.2), 3.71 (s, 3 H), 3.79 (d, 1 H, J = 11.6), 3.84 (s, 3 H), 6.67 (d, 1 H, J= 8.8), 7.12 (d, 1 H, J= 8.8), 12.72 (s, 1 H), 13.21 (br s, 1 H); 13C NMR (CD3OD) δ 24.70, 40.57, 56.53, 60.89, 84.26, 104.43, 112.34, 127.37, 137.46, 154.49, 157.98, 172.63, 175.87; HRMS m/z calcd for C13H16NO5S 298.0749 (M + H), found 298.0735.
(S)-2-(2,5-Dihydroxyphenyl)-4,5-dihydro-4-thiazolecarboxylic Acid (9)
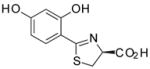
Sodium bicarbonate (4.37 g, 52.0 mmol) was added to a mixture of 12 (4.088 g, 30.26 mmol) and 16 (8.19 g, 46.6 mmol) in degassed CH3OH (220 mL) and phosphate buffer (220 mL) to a pH of 6, and the reactants were heated at 65 °C for 2 d with stirring under nitrogen. The reaction mixture was cooled to room temperature, and the volume of the reaction mixture was reduced by rotary evaporation. Cold 0.5 M HCl (150 mL) was added, followed by extraction with EtOAc (150 mL, 2 × 100 mL). The EtOAc layers were washed with saturated NaCl (80 mL) and were concentrated in vacuo. Recrystallization from aqueous EtOH gave 5.395 g (75%) of 9 as yellow crystals, mp 233–234.5 °C (dec): [α]23 −8.5° (c 1.18); 1H NMR δ 3.62 (dd, 1 H, J = 11.4, 7.4), 3.70 (dd, 1 H, J =11, 9.4), 5.46 (dd, 1 H, J = 9.4, 7.4), 6.81–6.85 (m, 2 H), 6.89 (dd, 1 H, J= 9, 2.6), 9.20 (s, 1 H), 11.74 (s, 1 H), 13.22 (s, 1 H); 13C NMR δ 33.45, 76.56, 114.93, 115.29, 117.65, 121.59, 149.53, 151.30, 171.37, 172.31; HRMS m/z calcd for C10H10NO4S 240.0330 (M + H), found 240.0262. Anal. (C10H9NO4S) C, H, N.
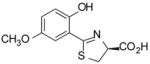
(S)-4,5-Dihydro-2-(2-hydroxy-5-methoxyphenyl)-4-thiazolecarboxylic Acid (10)
Sodium bicarbonate (3.83 g, 45.6 mmol) was added to a mixture of 1340 (4.600 g, 30.85 mmol) and 16 (7.136 g, 40.64 mmol) in degassed CH3OH (200 mL) and phosphate buffer (200 mL) to a pH of 6, and the reactants were heated at 60 °C for 3 d 17 h with stirring under nitrogen. The reaction mixture was cooled to room temperature, and the volume of the reaction mixture was reduced by rotary evaporation. Cold 0.3 M HCl (200 mL) was added, followed by extraction with EtOAc (2 × 150 mL, 3 × 50 mL). The EtOAc layers were washed with saturated NaCl (50 mL) and were concentrated in vacuo. Recrystallization from EtOAc/hexanes afforded 5.999 g (77%) of 10 as a pale green solid, mp 139.5–142 °C: [α]23 −7.1° (c 1.20); 1H NMR δ 3.64 (dd, 1 H, J =11.2, 7.6), 3.69–3.76 (m, 1 H), 3.74 (s, 3 H), 5.48 (dd, 1 H, J = 9.2, 7.6), 6.90 (d, 1 H, J= 3), 6.95 (d, 1 H, J= 9), 7.10 (dd, 1 H, J= 9, 3), 11.97 (s, 1 H), 13.23 (s, 1 H); 13C NMR δ 33.60, 55.67, 76.46, 113.42, 115.36, 117.91, 120.74, 151.68, 152.54, 171.32, 172.35; HRMS m/z calcd for C11H12NO4S 254.0487 (M + H), found 254.0516. Anal. (C11H11NO4S) C, H, N.
(S)-4,5-Dihydro-2-(3,4-dimethoxy-2-hydroxyphenyl)-4-thiazolecarboxylic Acid (11)
Sodium bicarbonate (4.24 g, 50.5 mmol) was added to a mixture of 14 (6.05 g, 33.8 mmol) and 16 (7.95 g, 45.3 mmol) in degassed CH3OH (225 mL) and phosphate buffer (225 mL) to a pH of 6, and the reactants were heated at 65 °C for 2 d 19 h with stirring under nitrogen. The reaction mixture was cooled to room temperature, and the volume of the reaction mixture was reduced by rotary evaporation. Cold 1 M HCl (67 mL) was added to the chilled mixture, which was extracted with EtOAc (200 mL, 4 × 50 mL) while adding salt. The EtOAc layers were washed with saturated NaCl (50 mL) and were concentrated in vacuo. Recrystallization from EtOAc/hexanes afforded 7.317 g (76%) of 11 as pale yellow crystals, mp 124.5–127.5 °C: [α]24 +13.5° (c 0.92); 1H NMR δ 3.61 (dd, 1 H, J =11.2, 7.2), 3.66–3.72 (m + s, 4 H), 3.84 (s, 3 H), 5.44 (dd, 1 H, J = 9.4, 7.4), 6.68 (d, 1 H, J= 8.8), 7.18 (d, 1 H, J= 8.8), 12.71 (s, 1 H), 13.19 (br s, 1 H); 13C NMR δ 33.27, 55.95, 59.82, 75.99, 103.80, 110.54, 126.11, 135.90, 152.94, 156.32, 171.43, 172.46; HRMS m/z calcd for C12H14NO5S 284.0593 (M + H), found 284.0606. Anal. (C12H13NO5S) C, H, N.
2,5-Dihydroxybenzonitrile (12)
Boron tribromide (1 M in CH2Cl2, 300 mL, 0.3 mol) was added dropwise to 17 (12.24 g, 75.00 mmol) in CH2Cl2 (30 mL) with dry ice/acetone cooling. The reaction solution was allowed to warm to room temperature and was stirred for 18 h. After quenching with H2O (100 mL) with ice-bath cooling, solids were filtered, and the layers of the filtrate were separated. The aqueous phase was diluted with H2O (200 mL), was adjusted to pH 2 with 1 N HCl, and was extracted with EtOAc (3 × 150 mL). The extracts were concentrated in vacuo, and the residue was recrystallized from EtOAc/hexanes, producing 8.5 g (80%) of 12 as a pale brown solid, mp 167–169 °C (mp lit51 163–165 °C): 1H NMR (CD3OD) δ 6.78 (d, 1 H, J= 8.8), 6.85 (d, 1 H, J= 2.8), 6.92 (dd, 1 H, J= 3.2, 2.8); 13C NMR (CD3OD) δ 100.27, 117.82, 118.12, 118.71, 123.48, 151.29, 154.70.
3,4-Dimethoxy-2-hydroxybenzonitrile (14)
Compound 19 (21.17 g, 0.1074 mol) and acetic anhydride (96 mL, 1.02 mol) were heated at reflux for 8 h under a Drierite tube. The reaction mixture was concentrated by rotary evaporation and was partitioned between CHCl3 (300 mL) and 8% NaHCO3 (250 mL). After further extraction with CHCl3 (2 × 100 mL), the organic phase was washed with 4% NaHCO3 (100 mL) and saturated NaCl (100 mL), followed by solvent removal in vacuo. The residue was treated with a solution of 50% NaOH (41 mL, 0.78 mol) and CH3OH (300 mL) with brief ice bath cooling. After stirring for 19 h at room temperature, solvents were removed by rotary evaporation. The residue was treated with 2 N HCl (400 mL) and was extracted with EtOAc (300 mL, 2 × 100 mL). The EtOAc layers were washed with saturated NaCl (100 mL) and were concentrated in vacuo. The crude product was purified by flash chromatography (7% acetone/CH2Cl2) and by recrystallization from EtOAc/hexanes to furnish 15.85 g (82%) of 14 as white crystals, mp 153–154.5 °C: 1H NMR δ 3.69 (s, 3 H), 3.86 (s, 3 H), 6.68 (d, 1 H, J= 8.8), 7.34 (d, 1 H, J= 8.8), 10.44 (s, 1 H); 13C NMR δ 56.19, 60.48, 92.72, 104.86, 117.03, 128.63, 136.30, 153.60, 157.21; HRMS m/z calcd for C9H10NO3 180.0661 (M + H), found 180.0681. Anal. (C9H9NO3) C, H, N.
3,4-Dimethoxy-2-hydroxybenzaldehyde Oxime (19)
Hydroxylamine hydrochloride (13.34 g, 0.1920 mol) and NaOAc (15.76 g, 0.1921 mol) were added to a warmed solution of 1841,42 (23.29 g, 0.1278 mol) in CH3OH (150 mL). The reaction mixture was heated at reflux for 1 h under a Drierite tube. The reaction mixture was concentrated by rotary evaporation, and the residue was diluted with saturated NaCl (200 mL) and 0.5 M citric acid (100 mL) and was extracted with EtOAc (300 mL, 2 × 100 mL). The EtOAc layers were washed with H2O (100 mL) and saturated NaCl (100 mL) and were concentrated in vacuo. Recrystallization from EtOAc/hexanes afforded 21.22 g (84%) of 19 as pale yellow crystals, mp 111.5–112 °C: 1H NMR δ 3.69 (s, 3 H), 3.80 (s, 3 H), 6.60 (d, 1 H, J= 8.6), 7.17 (d, 1 H, J= 9.0), 8.25 (s, 1 H), 9.98 (s, 1 H), 11.18 (s, 1 H); 13C NMR δ 55.78, 59.98, 103.94, 112.62, 123.42, 136.10, 148.28, 150.05, 154.12; HRMS m/z calcd for C9H12NO4 198.0766 (M + H), found 198.0759. Anal. (C9H11NO4) C, H, N.
Supplementary Material
Elemental analytical data for synthesized compounds. This material is available free of charge via the Internet at http://pubs.acs.org.
Acknowledgments
Funding was provided by the National Institutes of Health Grant No. R37-DK49108. We thank Elizabeth M. Nelson, Tanaya Lindstrom and Katie Ratliff-Thompson for their technical assistance and Carrie A. Blaustein for her editorial and organizational support. We acknowledge the Spectroscopy Services in the Chemistry Department, University of Florida, for the mass spectrometry analyses.
Footnotes
DADFT, desazadesferrithiocin [(S)-4,5-dihydro-2-(2-hydroxyphenyl)-4-methyl-4-thiazolecarboxylic acid; DADMDFT, desazadesmethyldesferrithiocin [(S)-4,5-dihydro-2-(2-hydroxyphenyl)-4-thiazolecarboxylic acid]; ICE, iron-clearing efficiency; log Papp, octanol-water partition coefficient (lipophilicity); DFO, desferrioxamine B mesylate; DFT, desferrithiocin [(S)-4,5-dihydro-2-(3-hydroxy-2-pyridinyl)-4-methyl-4-thiazolecarboxylic acid]; NTBI, nontransferrin-bound iron; [(S)-4′-(HO)-DADFT, 1], (S)-2-(2,4-dihydroxyphenyl)-4,5-dihydro-4-methyl-4-thiazolecarboxylic acid; [(S)-4′-(CH3O)-DADFT, 2], (S)-4,5-dihydro-2-(2-hydroxy-4-methoxyphenyl)-4-methyl-4-thiazolecarboxylic acid; [(S)-5′-(HO)-DADFT, 3], (S)-2-(2,5-dihydroxyphenyl)-4,5-dihydro-4-methyl-4-thiazolecarboxylic acid; [(S)-5′-(CH3O)-DADFT,4], (S)-4,5-dihydro-2-(2-hydroxy-5-methoxyphenyl)-4-methyl-4-1 thiazolecarboxylic acid; [(S)-3′,4′-(CH3O)2-DADFT, 5], (S)-4,5-dihydro-2-(3,4-dimethoxy-2-hydroxyphenyl)-4-methyl-4-thiazolecarboxylic acid; [(S)-4′-(HO)-DADFT-PE, 6], (S)-4,5-dihydro-2-[2-hydroxy-4-(3,6,9-trioxadecyloxy)phenyl]-4-methyl-4-thiazolecarboxylic acid; [(S)-4′-(HO)-DADMDFT, 7], (S)-2-(2,4-dihydroxyphenyl)-4,5-dihydro-4-thiazolecarboxylic acid; [(S)-4′-(CH3O)-DADMDFT, 8], (S)-4,5-dihydro-2-(2-hydroxy-4-methoxyphenyl)-4-thiazolecarboxylic acid; [(S)-5′-(HO)-DADMDFT, 9], (S)-2-(2,5-dihydroxyphenyl)-4,5-dihydro-4-thiazolecarboxylic acid; [(S)-5′-(CH3O)-DADMDFT, 10], (S)-4,5-dihydro-2-(2-hydroxy-5-methoxyphenyl)-4-thiazolecarboxylic acid; [(S)-3′,4′-(CH3O)2-DADMDFT, 11], (S)-4-5-dihydro-2-(3,4-dimethoxy-2-hydroxyphenyl)-4-thiazolecarboxylic acid
References
- 1.Raymond KN, Carrano CJ. Coordination Chemistry and Microbial Iron Transport. Acc Chem Res. 1979;12:183–190. doi: 10.1021/acs.accounts.5b00301. [DOI] [PMC free article] [PubMed] [Google Scholar]
- 2.Byers BR, Arceneaux JE. Microbial Iron Transport: Iron Acquisition by Pathogenic Microorganisms. Met Ions Biol Syst. 1998;35:37–66. [PubMed] [Google Scholar]
- 3.Bergeron RJ. Iron: A Controlling Nutrient in Proliferative Processes. Trends Biochem Sci. 1986;11:133–136. [Google Scholar]
- 4.Theil EC, Huynh BH. Ferritin Mineralization: Ferroxidation and Beyond. J Inorg Biochem. 1997;67:30. [Google Scholar]
- 5.Kalinowski DS, Richardson DR. The Evolution of Iron Chelators for the Treatment of Iron Overload Disease and Cancer. Pharmacol Rev. 2005;57:547–583. doi: 10.1124/pr.57.4.2. [DOI] [PubMed] [Google Scholar]
- 6.Brittenham GM. Disorders of Iron Metabolism: Iron Deficiency and Overload. In: Hoffman R, Benz EJ, Shattil SJ, Furie B, Cohen HJ, et al., editors. Hematology: Basic Principles and Practice. 3. Churchill Livingstone; New York: 2000. pp. 397–428. [Google Scholar]
- 7.Graf E, Mahoney JR, Bryant RG, Eaton JW. Iron-Catalyzed Hydroxyl Radical Formation. Stringent Requirement for Free Iron Coordination Site. J Biol Chem. 1984;259:3620–3624. [PubMed] [Google Scholar]
- 8.Halliwell B. Free Radicals and Antioxidants: A Personal View. Nutr Rev. 1994;52:253–265. doi: 10.1111/j.1753-4887.1994.tb01453.x. [DOI] [PubMed] [Google Scholar]
- 9.Halliwell B. Iron, Oxidative Damage, and Chelating Agents. In: Bergeron RJ, Brittenham GM, editors. The Development of Iron Chelators for Clinical Use. CRC; Boca Raton: 1994. pp. 33–56. [Google Scholar]
- 10.Koppenol W. Kinetics and Mechanism of the Fenton Reaction: Implications for Iron Toxicity. In: Badman DG, Bergeron RJ, Brittenham GM, editors. Iron Chelators: New Development Strategies. Saratoga; Ponte Vedra Beach, FL: 2000. pp. 3–10. [Google Scholar]
- 11.Babbs CF. Oxygen Radicals in Ulcerative Colitis. Free Radic Biol Med. 1992;13:169–181. doi: 10.1016/0891-5849(92)90079-v. [DOI] [PubMed] [Google Scholar]
- 12.Hazen SL, d’Avignon A, Anderson MM, Hsu FF, Heinecke JW. Human Neutrophils Employ the Myeloperoxidase-Hydrogen Peroxide-Chloride System to Oxidize α-Amino Acids to a Family of Reactive Aldehydes. Mechanistic Studies Identifying Labile Intermediates along the Reaction Pathway. J Biol Chem. 1998;273:4997–5005. doi: 10.1074/jbc.273.9.4997. [DOI] [PubMed] [Google Scholar]
- 13.Olivieri NF, Brittenham GM. Iron-chelating Therapy and the Treatment of Thalassemia. Blood. 1997;89:739–761. [PubMed] [Google Scholar]
- 14.Vichinsky EP. Current Issues with Blood Transfusions in Sickle Cell Disease. Semin Hematol. 2001;38:14–22. doi: 10.1016/s0037-1963(01)90056-3. [DOI] [PubMed] [Google Scholar]
- 15.Kersten MJ, Lange R, Smeets ME, Vreugdenhil G, Roozendaal KJ, Lameijer W, Goudsmit R. Long-Term Treatment of Transfusional Iron Overload with the Oral Iron Chelator Deferiprone (L1): A Dutch Multicenter Trial. Ann Hematol. 1996;73:247–252. doi: 10.1007/s002770050236. [DOI] [PubMed] [Google Scholar]
- 16.Conrad ME, Umbreit JN, Moore EG. Iron Absorption and Transport. Am J Med Sci. 1999;318:213–229. doi: 10.1097/00000441-199910000-00002. [DOI] [PubMed] [Google Scholar]
- 17.Lieu PT, Heiskala M, Peterson PA, Yang Y. The Roles of Iron in Health and Disease. Mol Aspects Med. 2001;22:1–87. doi: 10.1016/s0098-2997(00)00006-6. [DOI] [PubMed] [Google Scholar]
- 18.Angelucci E, Brittenham GM, McLaren CE, Ripalti M, Baronciani D, Giardini C, Galimberti M, Polchi P, Lucarelli G. Hepatic Iron Concentration and Total Body Iron Stores in Thalassemia Major. N Engl J Med. 2000;343:327–331. doi: 10.1056/NEJM200008033430503. [DOI] [PubMed] [Google Scholar]
- 19.Bonkovsky HL, Lambrecht RW. Iron-Induced Liver Injury. Clin Liver Dis. 2000;4:409–429. vi–vii. doi: 10.1016/s1089-3261(05)70116-1. [DOI] [PubMed] [Google Scholar]
- 20.Pietrangelo A. Mechanism of Iron Toxicity. Adv Exp Med Biol. 2002;509:19–43. doi: 10.1007/978-1-4615-0593-8_2. [DOI] [PubMed] [Google Scholar]
- 21.Cario H, Holl RW, Debatin KM, Kohne E. Insulin Sensitivity and β-Cell Secretion in Thalassaemia Major with Secondary Haemochromatosis: Assessment by Oral Glucose Tolerance Test. Eur J Pediatr. 2003;162:139–146. doi: 10.1007/s00431-002-1121-7. [DOI] [PubMed] [Google Scholar]
- 22.Wojcik JP, Speechley MR, Kertesz AE, Chakrabarti S, Adams PC. Natural History of C282Y Homozygotes for Hemochromatosis. Can J Gastroenterol. 2002;16:297–302. doi: 10.1155/2002/161569. [DOI] [PubMed] [Google Scholar]
- 23.Brittenham GM, Griffith PM, Nienhuis AW, McLaren CE, Young NS, Tucker EE, Allen CJ, Farrell DE, Harris JW. Efficacy of Deferoxamine in Preventing Complications of Iron Overload in Patients with Thalassemia Major. N Engl J Med. 1994;331:567–573. doi: 10.1056/NEJM199409013310902. [DOI] [PubMed] [Google Scholar]
- 24.Zurlo MG, De Stefano P, Borgna-Pignatti C, Di Palma A, Piga A, Melevendi C, Di Gregorio F, Burattini MG, Terzoli S. Survival and Causes of Death in Thalassaemia Major. Lancet. 1989;2:27–30. doi: 10.1016/s0140-6736(89)90264-x. [DOI] [PubMed] [Google Scholar]
- 25.Chua ACG, Olynyk JK, Leedman PJ, Trinder D. Nontransferrin-Bound Iron Uptake by Hepatocytes Is Increased in the Hfe Knockout Mouse Model of Hereditary Hemochromatosis. Blood. 2004;104:1519–1525. doi: 10.1182/blood-2003-11-3872. [DOI] [PubMed] [Google Scholar]
- 26.Oudit GY, Sun H, Trivieri MG, Koch SE, Dawood F, Ackerley C, Yazdanpanah M, Wilson GJ, Schwartz A, Liu PP, Backx PH. L-type Ca2+ Channels Provide a Major Pathway for Iron Entry into Cardiomyocytes in Iron-Overload Cardiomyopathy. Nat Med. 2003;9:1187–1194. doi: 10.1038/nm920. [DOI] [PubMed] [Google Scholar]
- 27.Brittenham GM. Iron Chelators and Iron Toxicity. Alcohol. 2003;30:151–158. doi: 10.1016/s0741-8329(03)00101-0. [DOI] [PubMed] [Google Scholar]
- 28.Davis BA, Porter JB. Long-Term Outcome of Continuous 24-Hour Deferoxamine Infusion via Indwelling Intravenous Catheters in High-Risk β-Thalassemia. Blood. 2000;95:1229–1236. [PubMed] [Google Scholar]
- 29.Davis BA, Porter JB. Results of Long Term Iron Chelation Treatment with Deferoxamine. Adv Exp Med Biol. 2002;509:91–125. doi: 10.1007/978-1-4615-0593-8_6. [DOI] [PubMed] [Google Scholar]
- 30.Naegeli H-U, Zähner H. Metabolites of Microorganisms. Part 193. Ferrithiocin. Helv Chim Acta. 1980;63:1400–1406. [Google Scholar]
- 31.Hahn FE, McMurry TJ, Hugi A, Raymond KN. Coordination Chemistry of Microbial Iron Transport. 42. Structural and Spectroscopic Characterization of Diastereomeric Cr(III) and Co(III) Complexes of Desferriferrithiocin. J Am Chem Soc. 1990;112:1854–1860. [Google Scholar]
- 32.Anderegg G, Räber M. Metal Complex Formation of a New Siderophore Desferrithiocin and of Three Related Ligands. J Chem Soc Chem Commun. 1990:1194–1196. [Google Scholar]
- 33.Bergeron RJ, Wiegand J, Dionis JB, Egli-Karmakka M, Frei J, Huxley-Tencer A, Peter HH. Evaluation of Desferrithiocin and Its Synthetic Analogues as Orally Effective Iron Chelators. J Med Chem. 1991;34:2072–2078. doi: 10.1021/jm00111a023. [DOI] [PubMed] [Google Scholar]
- 34.Bergeron RJ, Streiff RR, Wiegand J, Vinson JRT, Luchetta G, Evans KM, Peter H, Jenny H-B. A Comparative Evaluation of Iron Clearance Models. Ann N Y Acad Sci. 1990;612:378–393. doi: 10.1111/j.1749-6632.1990.tb24325.x. [DOI] [PubMed] [Google Scholar]
- 35.Bergeron RJ, Streiff RR, Creary EA, Daniels RD, Jr, King W, Luchetta G, Wiegand J, Moerker T, Peter HH. A Comparative Study of the Iron-Clearing Properties of Desferrithiocin Analogues with Desferrioxamine B in a Cebus Monkey Model. Blood. 1993;81:2166–2173. [PubMed] [Google Scholar]
- 36.Bergeron RJ, Wiegand J, Weimar WR, Vinson JRT, Bussenius J, Yao GW, McManis JS. Desazadesmethyldesferrithiocin Analogues as Orally Effective Iron Chelators. J Med Chem. 1999;42:95–108. doi: 10.1021/jm980340j. [DOI] [PubMed] [Google Scholar]
- 37.Bergeron RJ, Wiegand J, McManis JS, McCosar BH, Weimar WR, Brittenham GM, Smith RE. Effects of C-4 Stereochemistry and C-4′ Hydroxylation on the Iron Clearing Efficiency and Toxicity of Desferrithiocin Analogues. J Med Chem. 1999;42:2432–2440. doi: 10.1021/jm990058s. [DOI] [PubMed] [Google Scholar]
- 38.Bergeron RJ, Wiegand J, McManis JS, Bussenius J, Smith RE, Weimar WR. Methoxylation of Desazadesferrithiocin Analogues: Enhanced Iron Clearing Efficiency. J Med Chem. 2003;46:1470–1477. doi: 10.1021/jm020412d. [DOI] [PubMed] [Google Scholar]
- 39.Bergeron RJ, Wiegand J, McManis JS, Vinson JRT, Yao H, Bharti N, Rocca JR. (S)-4,5-Dihydro-2-(2-hydroxy-4-hydroxyphenyl)-4-methyl-4-thiazolecarboxylic Acid Polyethers: A Solution to Nephrotoxicity. J Med Chem. 2006;49:2772–2783. doi: 10.1021/jm0508944. [DOI] [PMC free article] [PubMed] [Google Scholar]
- 40.Shinoda J. The Constitution of Gentisin. J Chem Soc. 1927:1983–1985. [Google Scholar]
- 41.Singh SB, Pettit GR. Antineoplastic Agents. 166. Isolation, Structure, and Synthesis of Combretastatin C-1. J Org Chem. 1989;54:4105–4114. [Google Scholar]
- 42.Chantimakorn V, Nimgirawath S. Syntheses of the Benzylisoquinoline Alkaloids Isosevanine and Berbithine. Aust J Chem. 1989;42:209–213. [Google Scholar]
- 43.Bergeron RJ, Wiegand J, McManis JS, Weimar WR, Park J-H, Eiler-McManis E, Bergeron J, Brittenham GM. Partition-Variant Desferrithiocin Analogues: Organ Targeting and Increased Iron Clearance. J Med Chem. 2005;48:821–831. doi: 10.1021/jm049306x. [DOI] [PubMed] [Google Scholar]
- 44.Bergeron RJ, Streiff RR, Wiegand J, Luchetta G, Creary EA, Peter HH. A Comparison of the Iron-Clearing Properties of 1,2-Dimethyl-3-hydroxypyrid-4-one, 1,2-Diethyl-3-hydroxypyrid-4-one, and Deferoxamine. Blood. 1992;79:1882–1890. [PubMed] [Google Scholar]
- 45.Wood JK, Milner PF, Pathak UN. The Metabolism of Iron-Dextran Given as a Total-Dose Infusion to Iron Deficient Jamaican Subjects. Br J Haematol. 1968;14:119–129. doi: 10.1111/j.1365-2141.1968.tb01481.x. [DOI] [PubMed] [Google Scholar]
- 46.Bergeron RJ, Wiegand J, Brittenham GM. HBED: A Potential Alternative to Deferoxamine for Iron-Chelating Therapy. Blood. 1998;91:1446–1452. [PubMed] [Google Scholar]
- 47.Bergeron RJ, Wiegand J, Wollenweber M, McManis JS, Algee SE, Ratliff-Thompson K. Synthesis and Biological Evaluation of Naphthyldesferrithiocin Iron Chelators. J Med Chem. 1996;39:1575–1581. doi: 10.1021/jm9508752. [DOI] [PubMed] [Google Scholar]
- 48.Bergeron RJ, Wiegand J, Weimar WR, McManis JS, Smith RE, Abboud KA. Iron Chelation Promoted by Desazadesferrithiocin Analogues: An Enantioselective Barrier. Chirality. 2003;15:593–599. doi: 10.1002/chir.10248. [DOI] [PubMed] [Google Scholar]
- 49.Bergeron RJ, Wiegand J, Ratliff-Thompson K, Weimar WR. The Origin of the Differences in (R)- and (S)-Desmethyldesferrithiocin: Iron-Clearing Properties. Ann N Y Acad Sci. 1998;850:202–216. doi: 10.1111/j.1749-6632.1998.tb10476.x. [DOI] [PubMed] [Google Scholar]
- 50.Gomori G. Preparation of Buffers for Use in Enzyme Studies. Methods Enzymol. 1955;1:138–146. [Google Scholar]
- 51.Römer A, Sammet M. Synthesis of Substituted Phenazines from Benzofurazanoxid and Hydroquinones. Z Naturforsch B: Chem Sci. 1983;38B:866–872. [Google Scholar]
- 52.Bergeron RJ, Huang G, Weimar WR, Smith RE, Wiegand J, McManis JS. Desferrithiocin Analogue-Based Hexacoordinate Iron(III) Chelators. J Med Chem. 2003;46:16–24. doi: 10.1021/jm020184n. [DOI] [PubMed] [Google Scholar]
Associated Data
This section collects any data citations, data availability statements, or supplementary materials included in this article.
Supplementary Materials
Elemental analytical data for synthesized compounds. This material is available free of charge via the Internet at http://pubs.acs.org.