Abstract
We have found that the efficiency of fluorescence resonance energy transfer between Cy3 and Cy5 terminally attached to the 5′ ends of a DNA duplex is significantly affected by the relative orientation of the two fluorophores. The cyanine fluorophores are predominantly stacked on the ends of the helix in the manner of an additional base pair, and thus their relative orientation depends on the length of the helix. Observed fluorescence resonance energy transfer (FRET) efficiency depends on the length of the helix, as well as its helical periodicity. By changing the helical geometry from B form double-stranded DNA to A form hybrid RNA/DNA, a marked phase shift occurs in the modulation of FRET efficiency with helix length. Both curves are well explained by the standard geometry of B and A form helices. The observed modulation for both polymers is less than that calculated for a fully rigid attachment of the fluorophores. However, a model involving lateral mobility of the fluorophores on the ends of the helix explains the observed experimental data. This has been further modified to take account of a minor fraction of unstacked fluorophore observed by fluorescent lifetime measurements. Our data unequivocally establish that Förster transfer obeys the orientation dependence as expected for a dipole–dipole interaction.
Keywords: cyanine fluorophores, FRET, kappa squared, single-molecule FRET
Fluorescence resonance energy transfer (FRET) has become widely used to report on distances over the macromolecular scale in biology (1), reviewed in refs. 2–4. The method is highly sensitive, and consequently has been widely exploited in single-molecule experiments in biological systems. Energy transfer results from dipolar coupling between the transition moments of two fluorophores, and the efficiency of the process (EFRET) depends on the separation between the donor and acceptor fluorophores, raised to the sixth power. Although such data are frequently interpreted on the assumption of a simple relationship between EFRET and distance, EFRET should also depend on the relative orientation of the transition dipole vectors.
The orientation dependence is likely to be most significant where the fluorophores are constrained (5–9). This has been demonstrated experimentally by using a fluorophore that was terminally affixed to duplex DNA by two points of covalent attachment (10), thereby seriously constraining its motion. This situation is not typical of most FRET studies involving nucleic acids. Fluorophores are normally tethered by a single point of attachment, and in theory would be significantly less constrained. But if the fluorophores adopt a rigid manner of attachment to the helix, an orientational dependence could be observed.
Cy3 and Cy5 are a commonly used fluorophore pair, especially in single-molecule experiments. Our earlier NMR studies have shown that when these are attached to the 5′ termini of duplex DNA via a 3-carbon linker to the 5′-phosphate they are predominantly stacked onto the ends of the helix in the manner of an additional base pair (11, 26). This would provide a favorable situation in which the orientation dependence of FRET could be observed, and we have therefore studied a series of DNA and DNA-RNA hybrid duplexes to seek this effect. We find that EFRET values reduce with duplex length, but also exhibit a modulation with twice the periodicity of the helices that is consistent with the anticipated orientation effect. Thus, it will be necessary to take fluorophore orientation into consideration when interpreting FRET data in terms of distances in some circumstances.
Background Theory.
The variation of EFRET with the separation between donor and acceptor fluorophores (R) is given by (12):
where R0 is the distance at which energy transfer is 50% efficient. It depends on the spectroscopic properties of the fluorophores and the medium, given by:
where the units of R0 and the wavelength λ are centimeters. κ2 describes the relative orientation of the fluorophores (see below). ΦD is the quantum yield of the donor, N is the Avogadro number, and n is the index of refraction of the medium. J(λ) is the spectral overlap integral, given by:
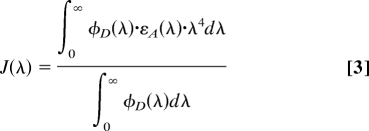 |
where φD(λ) is the spectral shape of donor emission and εA(λ) is the spectral shape of acceptor excitation (M−1 cm−1). We have measured the overlap integral for Cy3 and Cy5 terminally attached to dsDNA as J(λ) = 7.2 × 10⁻¹³ M−1 cm3.
The largest potential uncertainty in the extraction of distance information from EFRET lies in the orientation term κ2, given by:
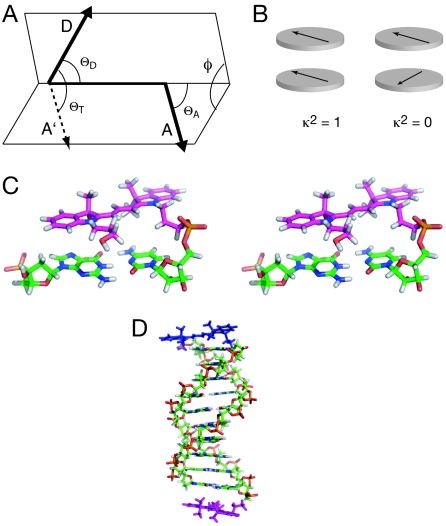
where the angles θT, θD, and θA are defined in Fig. 1 A and B. This can take values between 0 and 4, or between 0 and 1 if the transition moments are constrained to parallel planes and perpendicular to the line joining them. If the fluorophores undergo isotropic reorientation in a time much shorter than the excited state lifetime of the donor, then κ2 = 2/3 (6), and in most studies this is assumed to apply. Although this is a good approximation for freely mobile fluorophores like fluorescein that are terminally attached to double-stranded nucleic acids, it is rather less probable for cyanine dyes in this situation. By using NMR we have shown that Cy3 and Cy5 are predominantly stacked onto the end of dsDNA when coupled to the 5′-terminal phosphates via C3 linkers (11, 26) (Fig. 1 C and D).
Fig. 1.
Orientation of transition moments of cyanine fluorophores terminally attached to double-stranded DNA. (A) The orientation parameter κ2. The transition dipole vectors for the coupled donor and acceptor fluorophores are indicated by the arrows, labeled D and A. Vector A′ is generated by the in-plane translation of vector A to share its origin with vector D. The definition of κ2, given in Eq. 4, is based on the angles shown. (B) If the fluorophores lie in parallel planes, the orientation parameter simplifies to κ2 = cos2θT and varies between 0 and 1. The schematic shows the limiting cases, where the transition moments are parallel (κ2 = 1) and crossed (κ2 = 0). Note that these conditions will occur twice per complete rotation of one fluorophore relative to the other around their common axis. (C) Parallel-eye stereoimage showing the structure of Cy3 stacked onto the terminal base pair of a DNA duplex, as determined by NMR (11). (D) A molecular graphics model of a duplex with Cy3 and Cy5 fluorophores attached to the 5′ termini via C3 linkers. This was generated by using our NMR structures of Cy3 and Cy5 attached to duplex DNA. Note that the fluorophores lie in approximately parallel planes, and that the angular relationship between them (and thus their transition moments) will depend on the length of the DNA helix and its helical periodicity.
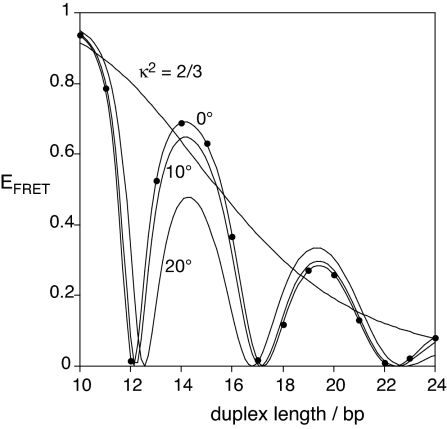
The transition moments for the π to π* transitions lie in the plane of the indole rings close to the polymethyne linker (26), and are therefore directed in planes that are approximately parallel to each other. This situation approximates to θD = θA = 90°, and where θT depends on the length and geometry of the DNA helix and the angles between the terminal base pairs and the transition moments. This is simulated in Fig. 2, on the assumption that the fluorophores are rigidly attached to the ends of the DNA. It can be seen that the efficiency of energy transfer is strongly modulated by the length of the helix in a periodic manner, falling close to zero twice per helix rotation when the transition moments are perpendicular (i.e., cosθT = 0). This “bouncing ball” type dependence is not significantly altered if the fluorophores are inclined relative to the terminal base pairs by 20°, as 3.cosθD.cosθA is small and the behavior remains dominated by the variation in θT. The variation of EFRET with length with a constant value of κ2 = 2/3 is also shown.
Fig. 2.
Simulation of the dependence of calculated efficiency of energy transfer between Cy3 and Cy5 terminally attached to duplex DNA as a function of the length of the helix. The calculations are based on the extremes of complete fluorophore mobility (κ2 = 2/3) and total rigidity of the fluorophore stacked on B form DNA. The latter calculations were performed for fluorophores lying in planes that are perpendicular to the helical axis (0°), or with the planes inclined to the axis by 10 or 20°. These calculations were based on a measured value of the spectral overlap integral J(λ) = 7.2 × 10⁻¹³ M−1 cm3, giving R0 = 60.1 Å when κ2 = 2/3. For the case of rigid and parallel fluorophores, the points plotted are the values for integral numbers of base pairs
Results and Discussion
We have investigated the variation of FRET efficiency experimentally for a series of terminally labeled DNA duplexes of lengths 10–24 bp, thus covering more than one complete helical turn. Each species was generated by hybridizing extensively purified complementary strands with Cy3 or Cy5 separately attached to their 5′ termini via a three-carbon linker [see supporting information (SI) Fig. S1]. EFRET was measured in both ensemble and single-molecule experiments.
Modulation of Energy Transfer Efficiency in a DNA Duplex Series.
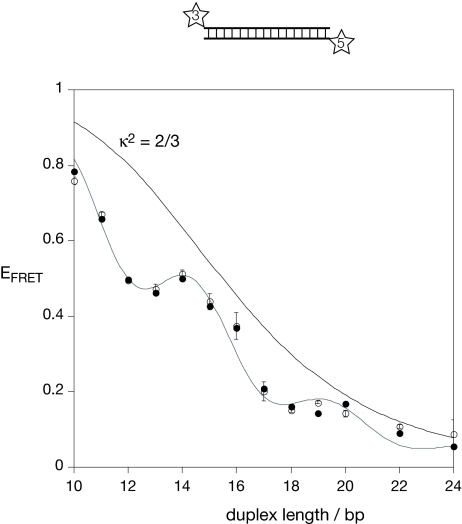
Each member of the series was studied in free solution under steady-state conditions, and EFRET was calculated by using the acceptor normalization method (13). The resulting efficiencies are plotted as a function of helix length in Fig. 3(filled circles). Overall, the EFRET values decrease with helix length, yet there is a clear periodic modulation in phase with that anticipated for simple orientational dependence based on B form helical geometry (Fig. 2). Minima are observed at 13 and 18 bp, and maxima at 14 and 19 bp. The period is therefore ≈5 bp, which is half the structural periodicity of a B form double helix; this is consistent with the anticipated orientational dependence of dipolar coupling. It should be noted that the observed modulation has twice the frequency of that observed where the interfluorophore separation varies with helix length because of off-axial positioning of freely mobile fluorophores (14).
Fig. 3.
Efficiency of energy transfer for Cy3, Cy5-labeled DNA duplexes as a function of duplex length. EFRET was measured for each duplex species, from an ensemble of molecules in the steady state (filled circles) or from phospholipid vesicle-encapsulated single molecules (open circles). Estimated errors are shown on the single-molecule data. The data have been simulated by using a model in which the fluorophores undergo a lateral motion within the plane perpendicular to the helical axis, giving a Gaussian distribution of probabilities about the mean relative angle set by the NMR structures. The fluorescent quantum yield for Cy3 was 0.30 (17), and the refractive index 1.33. The half-width giving the best agreement to the experimental data was 55°. Standard B form geometry of the DNA helix was used, with 10.5 bp per turn and a helical rise of 3.6 Å per bp step. The dependence for fully flexible fluorophore (κ2 = 2/3) is also plotted.
The values of EFRET for the DNA duplex series were measured by an alternative approach based on single-molecule methods. This was done for two main reasons. First, we were concerned that the ensemble results might be distorted by the presence of molecules in which Cy5 was not active. Second, the majority of experiments using the Cy3-Cy5 combination are performed with single-molecule methodology, and so this is directly relevant. EFRET was measured from single DNA molecules encapsulated in phospholipid vesicles (15) that were tethered to a quartz slide by using total internal reflection microscopy (16). This avoided any perturbation of DNA structure that might otherwise have arisen if there was a direct tether to the surface, and only molecules with active donor and acceptor fluorophores were analyzed. EFRET values of active species were calculated from the donor and acceptor wavelength channels, and histograms generated for many single molecules. The plot of EFRET vs. helix length (Fig. 3, open circles) is very similar to that generated from the ensemble data, with modulation of almost identical period and phase.
Thus, we observe the same modulation of FRET efficiency with helix length irrespective of the method of measurement. The period and phase of the modulation are fully consistent with the expected dependence on the relative orientation of the transition moments of the fluorophores, that is, the variation of κ2.
A Dynamic Model Can Account for the Extent of Modulation.
Although the positions of the maxima and minima of the experimental profiles are fully consistent with modulation due to fluorophore orientation, the peaks are clearly less sharply defined than those calculated for rigid fluorophores (Fig. 2), suggesting that the data are averaged by some dynamic process. Motions in which the fluorophores tilt away from their stacked position on the end of the DNA cannot explain this effect. We therefore simulated the data by using an alternative model in which the fluorophores are allowed to move laterally on the end of the helix, with a Gaussian distribution of probabilities of chosen half-width—this corresponds to a Boltzmann population of conformations where both fluorophores and the intervening DNA helix collectively act as a torsional spring. By using standard helical parameters for B form DNA with 10.5 bp per turn and a helical rise of 3.6 Å, together with mean angles between the terminal base pair and the transition moments of Cy3 and Cy5 of 32° and 30°, respectively (measured from the NMR structures), we generated simulations of the EFRET vs. helical length curves. We have assumed that the excitation and emission transition moments of Cy3 are parallel, which is supported by the high fundamental anisotropy of Cy3 (17). Setting a half-width at half-maximum (HWHM) of 55° provided excellent agreement with the shape of the experimental curve (Fig. 3), reproducing the maxima and minima in closely similar positions.
A Fraction of Cy3 Is Unstacked from the DNA.
Although the lateral motion can account for the observed data very well, it does not provide a unique solution. A model in which one fraction of the fluorophores is stacked, whereas the remaining fluorophores are unstacked and freely mobile with κ2 = 2/3, provided equally good agreement (see below). Although our NMR data indicate that most of the Cy3 will be stacked on the end of the DNA (11), a minor fraction that is unstacked would not be detected in these experiments. Levitus and coworkers (17) have provided time-resolved fluorescence data that indicate that there is a fraction of Cy3 that is free to rotate around its linker when attached to the 5′ terminus of double-stranded DNA. We therefore measured lifetime distributions for Cy3 attached to the 5′ terminus of DNA duplexes such that the fluorophore was in exactly the same environment as in the FRET experiments.
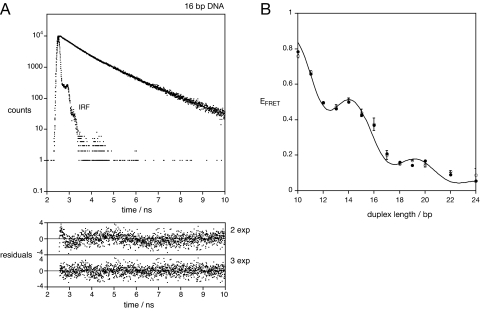
Singly Cy3-labeled duplexes of 16 and 22 bp were analyzed by using time-correlated photon counting, and the decay curves obtained fitted to a number of exponential functions (Fig. 4A). For each sample our data were significantly better fitted by using three exponentials compared with two (see SI Materials and, Table S1). Two species had relatively long lifetimes of 1.04 and 1.91 ns, with fractional intensities of 61.6% and 21.4%, respectively for the 16-bp duplex, whereas the third species had a lifetime of 390 ps and an intensity of 16.9% (Table 1). Identical results were obtained for the 22-bp duplex within experimental error. We assign the short-lifetime species to unstacked Cy3, where the excited state is rapidly relaxed by cis-trans photoisomerization occurring in the polymethyne linker (18). The fluorescent lifetime becomes longer if rotation about the polymethyne linkage is prevented, for example, by steric constraints in Cy3B (17). Thus, stacking may also prevent isomerization and account for the species we see with longer lifetimes. We suggest that the species with the longest lifetime has Cy3 stacked onto the end of the helix in a manner similar to that we have observed by NMR (11), because its lifetime is very close to the 2 ns expected for a Cy3 species that is unable to photoisomerize, calculated from the radiative fluorescence rate for Cy3 of 5 × 10⁸ s−1 (17). The intermediate lifetime probably arises from Cy3 in a series of environments in which rotation about the polymethyne linkage of the fluorophore is constrained but not prevented. These are unlikely to be freely mobile, because such a high proportion of unstacked fluorophore is not consistent with the NMR data. However, the lateral motion could partially expose the fluorophore such that some segmental rotation within the polymethyne linker becomes possible, shortening the fluorescent lifetime.
Fig. 4.
The existence of an unstacked fraction of fluorophore. (A) Time-resolved fluorescent lifetime analysis of Cy3 attached to double-stranded DNA. Fluorescent decay curve for Cy3 attached to a 16-bp DNA duplex, showing the experimental data and the instrument response function (IRF), and the fit to three exponential functions (line). Plots of weighted residuals for fitting the data to two (χ2 = 1.33) or three (χ2 = 1.06) exponential functions are shown below. (B) On the basis of this analysis, the EFRET data for the DNA duplexes were simulated by using a model in which the fraction of the fluorophores indicated by the fluorescent lifetime analysis was given free mobility with κ2 = 2/3, whereas the remaining fluorophore was constrained to undergo lateral motion with a distribution of species as before. The simulation (line) has been plotted with the experimental data (points) obtained from ensemble (filled circles) and single-molecule (open circles) experiments. Both datasets were found to be well described by a simulation in which 31% of the molecules had a mobile fluorophore extended by a further 7Å, and the remaining fraction of stacked fluorophore underwent lateral motion with a Gaussian half-width of 42°. The fluorescent quantum yield for Cy3 was 0.30 (17), and the refractive index 1.33. Standard B form geometry of the DNA helix was used.
Table 1.
Fluorescent lifetime data for 5-Cy3-labeled 16-bp DNA and RNA/DNA duplexes
| τ, ns | α | f, % | χ2 | |
|---|---|---|---|---|
| DNA 16 bp | 0.39 | 0.018 | 16.9 | 1.062 |
| 1.04 | 0.025 | 61.6 | ||
| 1.91 | 0.005 | 21.4 | ||
| RNA/DNA 16 bp | 0.31 | 0.009 | 5.3 | 0.986 |
| 0.96 | 0.025 | 43.7 | ||
| 1.77 | 0.016 | 51.0 |
τ, α, and f are the fluorescent lifetime, lifetime amplitude, and fractional intensity for each component, and χ2 is the chi-squared statistic.
Assuming that the dynamic properties of the chemically similar Cy5 are comparable to Cy3, up to 31% of the fluorescent emission could be due to molecules in which one or both fluorophores are in an unstacked conformation. We therefore simulated our data assuming that 31% of the molecules had freely mobile fluorophores such that κ2 = 2/3 (Fig. 4B). This provides an equally good fit to the experimental data (both ensemble and steady-state) compared with the fully stacked model, giving a HWHM = 42° for the fluorophores remaining stacked on the helix. However, simulations (data not shown) show that using a free fraction of fluorophore plus a stacked fraction with no lateral flexibility cannot explain the data. First, the minima and maxima are no longer in the correct positions. Second, we require a free fraction of ≈75% to approximate the experimental data, and this is plainly in contradiction with our earlier NMR data (11).
An Altered Periodicity of Modulation in a DNA-RNA Hybrid Duplex Series.
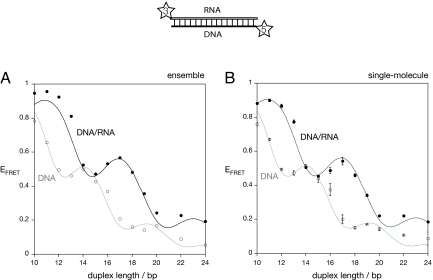
The modulation of EFRET with twice the frequency of the DNA helix provides strong evidence for the orientation dependence of the dipolar coupling. And, this suggests a further test of the model. On the basis of this model we expect that an A form helix should produce a similar modulation, but with an altered period and phase because this helical conformation is less tightly wound than the B form helix of double-stranded DNA. We therefore tested the prediction by the construction of a new series of terminally Cy3-Cy5-labeled duplex species with one DNA and one RNA strand. These hybrid duplexes should adopt an A form helix (19–21). FRET efficiency was measured by using both steady-state ensemble spectroscopy and single encapsulated molecules by TIR microscopy as before. The data are presented in Fig. 5, with the data for the DNA duplexes reproduced in gray for comparison. The profiles have the same appearance as those for the DNA duplexes, with a clear modulation superimposed onto a generally reducing EFRET as duplex length increases. However, the modulation is clearly not in phase with the DNA data, with maxima observed at 11, 17, and 22 bp. The efficiency of energy transfer is modulated with twice the periodicity of a helix corresponding to ≈12 bp per turn, that is, in good agreement with that expected for an A form helix.
Fig. 5.
Efficiency of energy transfer for Cy3, Cy5-labeled hybrid RNA/DNA duplexes as a function of duplex length. The duplexes were constructed by using the same Cy5-labeled DNA strands as before, hybridized to complementary Cy3-labeled RNA strands. EFRET was measured for each duplex species, from an ensemble of molecules in the steady state (A) or from phospholipid vesicle-encapsulated single molecules (B). The EFRET values are plotted (filled circles) as a function of helix length. The estimated errors are shown on the single-molecule data. The black lines show simulation of the data based on the geometry of an A form helix with a periodicity of 12 bp per turn and a rise of 3 Å/bp step. A fraction of freely mobile fluorophore of 12% was assumed from the time-resolved fluorescence measurements of Cy3 attached to an RNA/DNA duplex (see text). A refractive index of n = 1.33 and quantum yield of 0.35 were used for the efficiency calculations. For both datasets, a half-width for the distribution of lateral motion of 42% gave the optimal agreement with the experimental data. The data and simulations for the DNA duplexes are shown for comparison by using open circles and gray lines. The phase shift between the two helical forms is very clear.
We also carried out time-resolved fluorescence lifetime measurements of Cy3 attached to DNA/RNA duplexes of 16 and 22 bp in length (see SI Materials, Table S1, and Fig. S2). As with the DNA, the data were best fitted by using three species, with lifetimes (amplitudes) of 330 ps (6.1%), 990 ps (46.4%), and 1.84 ns (47.5%) (average for the 16 and 22 bp species). As with the DNA, we attribute the short-lifetime species to unstacked Cy3 molecules, and the remaining species to stacked fluorophores. These data indicate that the Cy3 is stacked more fully on the A form helix compared with the DNA duplex.
On the basis of these results we simulated our FRET efficiencies as a function of DNA/RNA duplex length based on an A form helix with 12 bp per turn and a rise of 3 Å and an unstacked fraction of fluorophores of 12% with κ2 = 2/3 (Fig. 5). Good agreement with the experimental data was obtained by inclusion of lateral fluorophore mobility with HWHM = 42° for the stacked fluorophores, and a refractive index n = 1.33. To obtain the best absolute agreement, a value of fluorescence quantum yield of 0.35 was used for the DNA-RNA duplexes, consistent with the greater proportion of the long-lifetime species.
Conclusions
The observed modulation of the distance dependence of FRET for the DNA and hybrid DNA-RNA series, and the agreement with simulations based on B and A form helices, provide strong evidence for the orientational dependence (i.e., κ2) of energy transfer efficiency by using the commonly employed Cy3-Cy5 donor–acceptor pair. Our experiments unequivocally establish that Förster transfer obeys the orientation dependence as expected for a dipole–dipole interaction. In many situations a simple inverse-distance interpretation of FRET efficiency will provide an adequate qualitative interpretation, but our data show that the common assumption that FRET is a monotonic function of distance can actually fail under certain circumstances. For the extraction of precise distance information, it will be necessary to take account of the orientation dependence. From our data we calculate that the assumption that κ2 = 2/3 could result in an error of up to 12 Å in distance estimation in some circumstances, notably when the transition moments are close to perpendicular. The discrepancy might be reduced if significant flexibility can be introduced into the linker connecting the two fluorophores. For example, changing the length and characteristics of the covalent tether might result in a flexible fluorophore, although this cannot be assumed a priori. If the fluorophores remain stacked on the helix, the orientation effect could lead to misassignment of states in single-molecule experiments if the assignment is made based only on the FRET efficiencies, especially in more complex systems with multiple states. Therefore, additional control experiments should be performed to provide independent support for the assignments. On the positive side, the orientation effects in FRET could be a valuable tool in structural biology. A full understanding of the orientation dependence could greatly extend the use of FRET measurements to provide both accurate distance and angular information.
Materials and Methods
Synthesis and Preparation of Duplex Species.
Deoxyribooligonucleotides were synthesized by using standard phosphoramidite chemistry, and ribooligonucleotides were synthesized by using 2′-t-BDMS ribonucleoside β-cyanoethyl phosphoramidites (22), as described in ref. 23. Cy3 and Cy5 were added to 5′ termini as phosphoramidites at the end of synthesis as required. Fully deprotected oligonucleotides were purified by electrophoresis in 20% polyacrylamide gels containing 7 M urea, and recovered by electroelution. The cyanine-conjugated strands were further purified by reversed-phase chromatography with a C18 column eluted with a gradient of acetonitrile in 100 mM triethylammonium acetate. Duplex species were assembled by mixing stoichiometric quantities of purified DNA (Cy3 or Cy5 labeled) or RNA (Cy3 labeled) in 90 mM Tris-borate (pH 8.3), 25 mM NaCl, cooling slowly from 95°C to 4°C. Duplexes were then purified by electrophoresis in 20% polyacrylamide under nondenaturing conditions in 90 mM Tris-borate (pH 8.3), 25 mM NaCl. Gel fragments containing the required duplexes were excised, and the double-stranded nucleic acids were recovered by electroelution. The purified DNA or DNA/RNA species were dissolved in 90 mM Tris-borate (pH 8.3) and absorption spectra recorded from 220 to 800 nm by using a Cary 1E UV-visible spectrophotometer. The full sequences of all of the duplex species used in this study are listed in SI Materials.
Steady-State Ensemble Fluorimetry.
Fluorescence emission spectra were recorded at 4°C by using an SLM-Aminco 8100 fluorimeter in 90 mM Tris-borate (pH 8.3). Spectra were corrected for lamp fluctuations and instrumental variations, and polarization artifacts were avoided by crossing excitation and emission polarizers at 54.7°. EFRET was measured with the acceptor normalization method (13) by using emission spectra (550–720 nm) excited at 535 and 600 nm.
Single-Molecule Analysis of Encapsulated Duplex Species.
Single duplex molecules were studied trapped within phospholipid vesicles in 10 mM Tris·HCl (pH 8.0), 50 mM NaCl. Individual DNA or RNA/DNA duplex species were encapsulated in phospholipid vesicles comprising a 100:1 mixture of either l-α-phosphatidylcholine or 1,2-dimyristoyl-sn-glycero-3-phosphocholine with 1,2-dipalmitoyl-sn-glycero-3-phosphoethanolamine-N-(cap biotinyl) (Avanti Polar Lipids) by repeated extrusion through a polycarbonate membrane containing 200-nm pores (Osmonics) (24) as described (15). This generated 200-nm-diameter vesicles, with a 1:1 molar ratio of duplex to vesicles. The vesicles were conjugated via NeutrAvidin (Pierce) to biotin-functionalized polyethylene glycol (PEG)-coated quartz slide surfaces. Encapsulated molecules were excited at 532 nm by prism-based total internal reflection (16) microscope at 12°C. Up to 100 images of the surface at Cy3 and Cy5 emission wavelengths were obtained by using an Andor intensified CCD camera, with an integration time of 100 ms for durations of 2–3 s. Dual-view design of the emission pathway allowed us to image the Cy3 and Cy5 signals simultaneously. EFRET values were calculated from averaged Cy3 and Cy5 intensities over 300- to 500-ms periods for each molecule in the images. Data were corrected for crosstalk between Cy3 and Cy5 channels, backreflection from the dichroic mirror surface in the dual-view emission pathway, and the background (see SI Materials). Histograms of EFRET values from 5,000 to 32,000 molecules are plotted in Fig. S3. Each histogram contained two major peaks; one at EFRET ≈ 0 corresponding to duplexes with active Cy3 only, and another at higher EFRET resulting from duplex molecules with an active Cy3-Cy5 pair. However, for some constructs, an additional, broad peak was observed at intermediate FRET values because of some vesicles containing multiple DNA molecules with at least one photobleached Cy5. In such cases, we fit the data with three Gaussian peaks to separate the contribution of the important species (see SI Materials and Fig. S4). Errors on the reported EFRET values represent the standard deviation of randomly sampled subsets of the data, each comprising ≈1,000 molecules.
Time-Resolved Fluorimetry.
Time-resolved fluorescence intensity measurements were performed by time-correlated single-photon counting (TCSPC) by using an FL 920 spectrometer (Edinburgh Instruments) (25). The excitation source was a titanium sapphire laser (Coherent) with 200-fs pulse duration operated at 76 MHz. Its fundamental output was sent through a pulse picker (Coherent 9200) and a harmonic generator (Coherent 5-050) to obtain 450-nm pulses at 4.7 MHz. The excitation beam was attenuated as needed to avoid pile-up effects. Fluorescence emission was detected by using a monochromator and a cooled microchannel plate photomultiplier tube (Hamamatsu C4878). The instrument response function, measured by scattering the excitation beam from a dilute suspension of colloidal silica (Ludox), was <100 ps FWHM. Fluorescence decay curves were recorded on a time scale of 20 ns, resolved into 4,096 channels, to a total of 10,000 counts in the peak channel. Decay curves were analyzed by using a standard iterative reconvolution method in the F900 (Edinburgh Instruments) software packages, on the basis of a multiexponential decay function. The quality of fit was judged on the basis of the reduced χ2 statistic, and the randomness of residuals.
Supplementary Material
Acknowledgments.
We thank Lubert Stryer, Bob Clegg, and Jason Crain for valuable discussions, and Collaborative Optical Spectroscopy, Micromanipulation, and Imaging Center for access to time-domain fluorescent lifetime apparatus. This work was supported by Cancer Research U.K. (Dundee), and the National Institutes of Health and the National Science Foundation (University of Illinois Urbana–Champaign).
Footnotes
The authors declare no conflict of interest.
This article is a PNAS Direct Submission.
This article contains supporting information online at www.pnas.org/cgi/content/full/0801707105/DCSupplemental.
References
- 1.Stryer L, Haugland RP. Energy transfer: A spectroscopic ruler. Proc Natl Acad Sci USA. 1967;58:719–726. doi: 10.1073/pnas.58.2.719. [DOI] [PMC free article] [PubMed] [Google Scholar]
- 2.Clegg RM. In: Fluorescence Imaging Spectroscopy and Microscopy. Wang XF, Herman B, editors. New York: Wiley; 1996. pp. 179–252. [Google Scholar]
- 3.Lilley DMJ, Wilson TJ. Fluorescence resonance energy transfer as a structural tool for nucleic acids. Curr Opin Chem Biol. 2000;4:507–517. doi: 10.1016/s1367-5931(00)00124-1. [DOI] [PubMed] [Google Scholar]
- 4.Clegg RM. FRET tells us about proximities, distances, orientations and dynamic properties. J Biotechnol. 2002;82:177–179. [PubMed] [Google Scholar]
- 5.Haas E, Katchalski-Katzir E, Steinberg IZ. Effect of the orientation of donor and acceptor on the probability of energy transfer involving electronic transitions of mixed polarization. Biochemistry. 1978;17:5064–5070. doi: 10.1021/bi00616a032. [DOI] [PubMed] [Google Scholar]
- 6.Dale RE, Eisinger J, Blumberg WE. The orientation freedom of molecular probes. The orientation factor in intramolecular energy transfer. Biophys J. 1979;26:161–194. doi: 10.1016/S0006-3495(79)85243-1. [DOI] [PMC free article] [PubMed] [Google Scholar]
- 7.Wu P, Brand L. Orientation factor in steady-state and time resolved resonance energy transfer measurements. Biochemistry. 1992;31:7939–7947. doi: 10.1021/bi00149a027. [DOI] [PubMed] [Google Scholar]
- 8.Unruh JR, Gokulrangan G, Lushington GH, Johnson CK, Wilson GS. Orientational dynamics and dye-DNA interactions in a dye-labeled DNA aptamer. Biophys J. 2005;88:3455–3465. doi: 10.1529/biophysj.104.054148. [DOI] [PMC free article] [PubMed] [Google Scholar]
- 9.VanBeek DB, Zwier MC, Shorb JM, Krueger BP. Fretting about FRET: Correlation between kappa and R. Biophys J. 2007;92:4168–4178. doi: 10.1529/biophysj.106.092650. [DOI] [PMC free article] [PubMed] [Google Scholar]
- 10.Lewis FD, Zhang L, Zuo X. Orientation control of fluorescence resonance energy transfer using DNA as a helical scaffold. J Am Chem Soc. 2005;127:10002–10003. doi: 10.1021/ja0524402. [DOI] [PubMed] [Google Scholar]
- 11.Norman DG, Grainger RJ, Uhrin D, Lilley DMJ. The location of Cyanine-3 on double-stranded DNA; importance for fluorescence resonance energy transfer studies. Biochemistry. 2000;39:6317–6324. doi: 10.1021/bi992944a. [DOI] [PubMed] [Google Scholar]
- 12.Förster T. Zwischenmolekulare Energiewanderung und Fluoreszenz. Ann Phys. 1948;2:55–75. [Google Scholar]
- 13.Clegg RM. Fluorescence resonance energy transfer and nucleic acids. Methods Enzymol. 1992;211:353–388. doi: 10.1016/0076-6879(92)11020-j. [DOI] [PubMed] [Google Scholar]
- 14.Clegg RM, Murchie AIH, Zechel A, Lilley DMJ. Observing the helical geometry of double-stranded DNA in solution by fluorescence resonance energy transfer. Proc Natl Acad Sci USA. 1993;90:2994–2998. doi: 10.1073/pnas.90.7.2994. [DOI] [PMC free article] [PubMed] [Google Scholar]
- 15.Okumus B, Wilson TJ, Lilley DMJ, Ha T. Vesicle encapsulation studies reveal that single molecule ribozyme heterogeneities are intrinsic. Biophys J. 2004;87:2798–2806. doi: 10.1529/biophysj.104.045971. [DOI] [PMC free article] [PubMed] [Google Scholar]
- 16.Ha T, et al. Initiation and re-initiation of DNA unwinding by the Escherichia coli Rep helicase. Nature. 2002;419:638–641. doi: 10.1038/nature01083. [DOI] [PubMed] [Google Scholar]
- 17.Sanborn ME, Connolly BK, Gurunathan K, Levitus M. Fluorescence properties and photophysics of the sulfoindocyanine Cy3 linked covalently to DNA. J Phys Chem B. 2007;111:11064–11074. doi: 10.1021/jp072912u. [DOI] [PubMed] [Google Scholar]
- 18.Chibisov AK, et al. Photorelaxation processes in covalently linked indocarbocyanine and thiacarbocyanine dyes. J Phys Chem. 1995;99:886–893. [Google Scholar]
- 19.Horton NC, Finzel BC. The structure of an RNA/DNA hybrid: a substrate of the ribonuclease activity of HIV-1 reverse transcriptase. J Mol Biol. 1996;264:521–533. doi: 10.1006/jmbi.1996.0658. [DOI] [PubMed] [Google Scholar]
- 20.Xiong Y, Sundaralingam M. Crystal structure of a DNA. RNA hybrid duplex with a polypurine RNA r(gaagaagag) and a complementary polypyrimidine DNA d(CTCTTCTTC) Nucleic Acids Res. 2000;28:2171–2176. doi: 10.1093/nar/28.10.2171. [DOI] [PMC free article] [PubMed] [Google Scholar]
- 21.Kopka ML, Lavelle L, Han GW, Ng HL, Dickerson RE. An unusual sugar conformation in the structure of an RNA/DNA decamer of the polypurine tract may affect recognition by RNase H. J Mol Biol. 2003;334:653–665. doi: 10.1016/j.jmb.2003.09.057. [DOI] [PubMed] [Google Scholar]
- 22.Beaucage SL, Caruthers MH. Deoxynucleoside phosphoramidites - a new class of key intermediates for deoxypolynucleotide synthesis. Tetrahedron Lett. 1981;22:1859–1862. [Google Scholar]
- 23.Wilson TJ, Zhao Z-Y, Maxwell K, Kontogiannis L, Lilley DMJ. Importance of specific nucleotides in the folding of the natural form of the hairpin ribozyme. Biochemistry. 2001;40:2291–2302. doi: 10.1021/bi002644p. [DOI] [PubMed] [Google Scholar]
- 24.Boukobza E, Sonnenfeld A, Haran G. Immobilization in surface-tethered lipid vesicles as a new tool for single biomolecule spectroscopy. J Phys Chem B. 2001;105:12165–12170. [Google Scholar]
- 25.Neely RK, Magennis SW, Dryden DTF, Jones AC. Evidence of tautomerism in 2-aminopurine from fluorescence lifetime measurements. J Phys Chem B. 2004;108:17606–17610. [Google Scholar]
- 26.Iqbal A, Wang L, Thompson KC, Lilley DMJ, Norman DG. The structure of Cyanine 5 terminally attached to double-stranded DNA: Implication for FRET studies. Biochemistry. 2008 doi: 10.1021/bi800773f. in press. [DOI] [PubMed] [Google Scholar]
Associated Data
This section collects any data citations, data availability statements, or supplementary materials included in this article.


