Abstract
Motivation
Knowledge base construction has been an area of intense activity and great importance in the growth of computational biology. However, there is little or no history of work on the subject of evaluation of knowledge bases, either with respect to their contents or with respect to the processes by which they are constructed. This article proposes the application of a metric from software engineering known as the found/fixed graph to the problem of evaluating the processes by which genomic knowledge bases are built, as well as the completeness of their contents.
Results
Well-understood patterns of change in the found/fixed graph are found to occur in two large publicly available knowledge bases. These patterns suggest that the current manual curation processes will take far too long to complete the annotations of even just the most important model organisms, and that at their current rate of production, they will never be sufficient for completing the annotation of all currently available proteomes.
Contact
larry.hunter@uchsc.edu
1 INTRODUCTION
This article proposes a metric for evaluating the process of knowledge base construction and the completeness of the resulting knowledge base. In particular, this metric focuses on quantifying the information missing from the knowledge base. It does not address the issue of quality of the knowledge base contents. We apply the metric to three different data types—Gene Ontology (GO) annotations, function comments, and GeneRIFs—in two large, publicly available, manually curated genomic databases—Swiss-Prot (Boeckmann et al., 2003), and Entrez Gene (Maglott et al., 2005). The metric suggests that the current manual curation processes will take far too long to complete the annotations of even just the most important model organisms, and that at their current rate of production, they will never be sufficient for completing the annotation of all currently available proteomes.
Although knowledge-based systems have figured heavily in the history of artificial intelligence and in modern large-scale industrial software systems, and there is an extensive body of work on evaluating knowledge-based systems, there is little or no history of work on the subject of evaluating knowledge bases themselves. [Note that the problem of evaluating a knowledge base is very different from the problem of evaluating a terminological resource, such as the UMLS—this problem has been studied extensively (e.g. Cimino et al., 2003; Ceusters et al., 2003; and Köhler et al., 2006; among others).] Whether we look at work from the academic artificial intelligence community (e.g. Cohen, 1995) or from the industrial software engineering community (e.g. Beizer, 1990; Beizer, 1995; Kaner et al., 1999; Kaner et al., 2001; Meyers, 1979), we find no discussion of the topic of evaluating the contents of knowledge bases. This is despite the fact that they form significant parts of the architecture of industrially important systems in application areas like mapping (e.g. MapQuest.com) and retail search (e.g. LocalMatters.com). As Groot et al. (2005) recently put it, quoting one of their anonymous reviewers: ‘… for a long time, the knowledge acquisition community has decried the lack of good evaluation metrics to measure the quality of the knowledge acquisition process and of the resulting knowledge bases’ (p. 225).
This article addresses both of these issues. We evaluate the hypothesis that a software testing metric known as the ‘found/fixed graph’ or the ‘open/closed graph’ is an effective and revealing metric for evaluating both the process of knowledge base construction, and the completeness of the knowledge base that results from that construction effort. (The quality of the contents (as opposed to the quality of the process of knowledge base construction) is a separate issue, and we do not address it experimentally in this paper; see Section 5.2 for a discussion of potential future work on this problem.) Knowledge base construction has been a significant focus of the field since the earliest days of computational biology (see e.g. Schmeltzer et al. (1993) from the first ISMB meeting). It continues to be an important area of research, with many active projects, e.g. PharmGKB (Hewett et al., 2002), MuteXt (Horn et al., 2004), RiboWeb (Chen et al., 1997), Biognosticopoeia (Acquaah-Mensah and Hunter, 2002), and LSAT (Shah et al., 2005), as well as a number of multi-year, multi-national projects of unquestionable scientific significance. In the current era of scarce resources for bioscience research and pressing demands for larger and larger knowledge bases, this work has the potential to provide much-needed feedback, guidance, and monitoring capabilities to a previously difficult-to-evaluate enterprise.
2 APPROACH
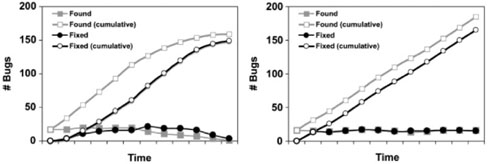
The found/fixed or open/closed graph (Black, 1999) is used to evaluate an organization's software development process, and/or to evaluate the readiness of a project for release. The metric is based on tracking both cumulative counts of unique bugs that have been discovered (‘found’ bugs or ‘open’ bug reports) and resolved (‘fixed’ bugs or ‘closed’ bug reports) over time. The shape of the resulting curves can be used to assess the engineering process, since good and bad processes, or software products that are and are not ready for release, have different characteristic curves (Fig. 1). In the scenario where the process is not leading to a releasable software product (right side of Fig. 1), growth in the cumulative counts of found and fixed bugs do not asymptote, and there is always a gap between them. In contrast, in the scenario where the process will eventually terminate—i.e. produce a releasable product (left side of Fig. 1)—the two lines asymptote and converge, so that the gap between them narrows over time. Other aspects of the development process can be reflected in the graph, as well. For example, poor management of the process shows up as lack of correlation between project milestones and inflection points— the expectation is that inflection points will correlate with project milestones.
Fig. 1.
Hypothetical found/fixed graphs depicting good (left) and nonterminating (right) development processes.
Although it was originally conceived for evaluating software development processes, we propose that the metric can be applied to the evaluation of knowledge base construction processes and knowledge base completeness, as well. We do this by changing what is reflected on the y-axis. In the examples that follow, we use the y-axis to chart Swiss-Prot entries that lack function comment annotations and GO concept assignments, and Entrez Gene entries that lack GeneRIFs. The model is equally applicable to other biological entities annotated with arbitrary types of data. The metric can be made more general or more specific by changing the granularity of the unit on the y-axis—for example, it can reflect genes that lack any Gene Ontology annotation, or it can be made more specific by counting genes that lack any Gene Ontology annotation more specific than biological process. An important point to note is that unlike other attempts to characterize the coverage of a knowledge base, this metric is based not on counting the things that are in the knowledge base, but on counting the things that are missing from it.
3 METHODS
To evaluate the applicability of the metric to knowledge base construction, we modeled gaps in the contents of two genomic resources as they changed over time. Specifically, we examined the Swiss-Prot and Entrez Gene databases.
In the case of Swiss-Prot, we looked for missing data points in two types of annotations: Gene Ontology concept assignments, and populated function comment fields. Gene Ontology annotation is well-described elsewhere (Camon et al., 2004); the Swiss-Prot function comment field contains unstructured, free-text information about the function of a gene product. For example, the function field for Swiss-Prot entry Q99728 (human BARD1) contains the text Implicated in BRCA1-mediated tumor suppression. May, as part of the RNA polymerase-2 holoenzyme, function in the cellular response to DNA damage. In vitro, inhibits pre-mRNA 3′ cleavage. In the case of Entrez Gene, we examined annotation with GeneRIFs. GeneRIFs are short, unstructured, free-text information about the function of a gene. GeneRIFs are interesting in and of themselves; they have been found to be useful inputs to a microarray data analysis tool that incorporates text mining results [the MILANO system, described in Rubinstein and Simon (2005)] and have been the subject of considerable attention in the biomedical text mining community in recent years (Hersh and Bhupatiraju, 2003, Lu et al., 2006, 2007, Mitchell et al., 2003, among others). Between them, these annotation types and databases allow us to sample a range of data types originating from at least four different projects. They may not generalize to all data types, but do at least cover a number of the possibilities.
Crucial to the construction of any found/fixed graph is the collection of temporal data for the data types of interest. To obtain time-stamped data, we did the following. For the case of GeneRIF annotation logging, the creation date for each GeneRIF is catalogued in files distributed by Entrez Gene. ASN.1 compressed files cataloguing human (Homo_sapiens.gz) and mouse (Mus_musculus.gz) genes were downloaded1 and converted into XML using NCBI’s gene2xml program.2 A parser was constructed for extracting the creation dates for gene records and for any associated GeneRIFs. Obtaining time stamps for the annotation of GO terms and function comments to Swiss-Prot records was slightly more involved. Individual Swiss-Prot records log the date that they were integrated into the database. However, their annotations are not directly associated with a creation date, so creation dates were inferred by comparing archived versions of the database. Archived versions 9-51 of the Swiss-Prot database were downloaded.3,4 A parser was developed for extracting the protein records from each release, along with any accompanying GO annotations and function comments. The archived releases were processed chronologically, and time stamps for the annotations were assigned based on the version release date in which they first appeared. Species-specific data were generated using the NCBI taxonomy codes linked with each Swiss-Prot entry.
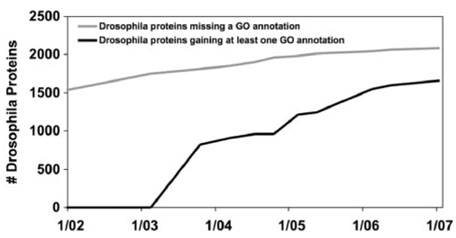
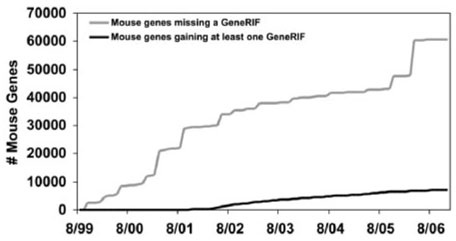
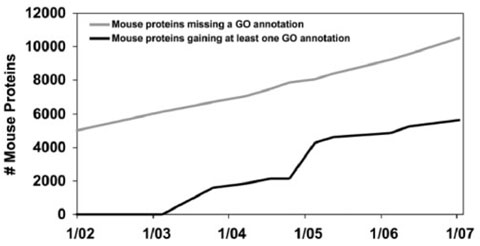
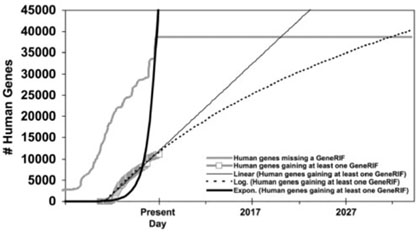
In Figures 2–7, we graph time on the x-axis and the count of proteins (for Swiss-Prot) or genes (for Entrez Gene) on the y-axis. The light line in each graph shows the cumulative count of proteins or genes that were found to be lacking annotations of the data type in question at that time, while the dark line shows the cumulative count of proteins or genes that have had annotations of that data type added to them.
Fig. 2.
GO annotation of Drosophila proteins in Swiss-Prot over time.
Fig. 7.
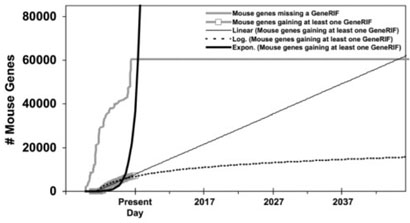
GeneRIF assignment to mouse genes in Entrez Gene over time. For simplicity, each Entrez Gene record is counted when first created, and discontinued records were ignored.
We then fit a linear, an exponential, and a logarithmic function to each of the lines charting added annotations, and calculated the correlation between the functions and the actual data as of January 2007. We did not test the differences between the correlations for statistical significance. For each function, we determined the date at which the added-annotations line would cross the missing-annotations line—that is, the date at which full coverage of the data type would be achieved—making the very lenient assumption that no new proteins or genes would be added to the database after January 2007.
It should be noted that the definition of ‘full coverage’ carries its own ambiguities. The fact that a biological entity (e.g. a gene or protein) has a single annotation should not imply that the overall annotation for this entity is complete. The existence of a single annotation for a given entity, however, can usefully serve as a lower bound. For the purposes of this study, we define full coverage of an entity type (e.g. genes in Entrez Gene) by a data type (e.g. GeneRIFs) simply as having at least one annotation per entity, unless otherwise noted.
These data are only a proxy for the kind of facts that the found/fixed graph is intended to track. A weakness of these data for evaluating the model comes from the fact that unlike in the case of a reported bug in a software development project, the knowledge base builders cannot be assumed to be aiming to address these specific missing pieces of information. (For example, at any given time, the builders of a knowledge base may be more concerned with adding additional genes to their knowledge base than with increasing the annotations associated with the genes that are already present in the knowledge base.) A further difference between our use of the found/fixed graph and the original use is that fixing bugs in a software project can result in the unintended generation of new bugs, but the addition of annotations to a genomic database monotonically decreases the number of unannotated genes (assuming no new genes are added)5; this is a strength of the approach. A further difference is that annotations of biological entities can become outdated, whether through deprecation of concepts or due to an actual change in our understanding of the facts—Giuse et al. (1995) found that 16% of entities in a knowledge base of disease profiles required some sort of modification after a 10-year period from the original creation of the knowledge base (p. 304). Despite these differences, it will be seen that the knowledge bases under examination demonstrate all of the characteristics of typical software construction projects. We return to the weaknesses of the model in Section 5.
Note that an alternative approach to evaluating a knowledge base would be extrinsically—that is, by using it in a knowledge-based system, and observing how it affects system performance. However, as Groot et al. (2005) suggest, this methodology is inherently flawed: there is a confound between the variable of knowledge base completeness and the variable of the knowledge-based system's robustness in the face of incomplete (or low-quality) knowledge. An advantage of the found/fixed graph is that it allows for evaluation of the completeness of the knowledge base in isolation from any system by which it might be used.
4 DISCUSSION
Particular development process patterns show characteristic shapes on a found/fixed graph. All of the characteristic shapes were attested amongst the various data types that we examined.
4.1 Interpreting converging, asymptoting lines
The left side of Figure 1 shows the best-case scenario: as missing information is identified (or, in the graph, as bugs are found), it is addressed, and as the knowledge base evolves, the rate at which new missing information is found approaches zero, while the gap between the cumulative ‘found’ missing information and the cumulative ‘fixed’ problems narrows. (If this were a software product, we would probably judge it to be ready for release at this point.) We can observe this pattern in Figure 2, which graphs Swiss-Prot annotation of Drosophila proteins with Gene Ontology concepts. Few new unannotated genes are being added, and the majority of the previously unannotated ones have been addressed.
4.2 Non-terminating processes
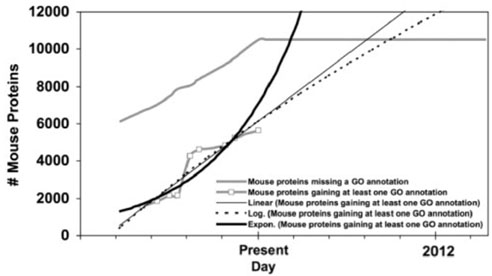
The right side of Figure 1 shows the pattern that a software engineer would term ‘the nightmare of endless bug discovery’ (Black, 1999, p. 139): bugs (i.e. missing information) are addressed as they are found, but as fast as problems are fixed, new ones appear. We can observe a more extreme version of this pattern in Figure 3, which graphs Swiss-Prot annotation of mouse proteins with Gene Ontology concepts. Missing data points are continually being addressed, as can be observed by the constant climb in the ‘fixed’ line. However, unannotated proteins are continually being added, as can be observed by the climb in the ‘found’ line. There is no reason to expect that this project will be ‘bug’-free any time soon.
Fig. 3.
GO annotation of mouse proteins in Swiss-Prot over time.
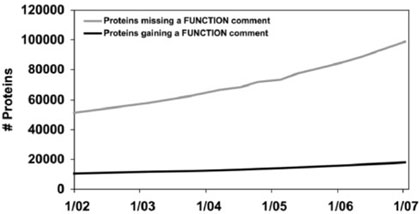
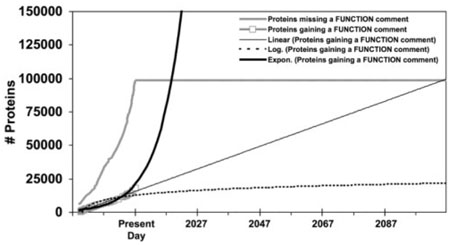
Figure 4, which graphs Swiss-Prot annotation of all proteins with function fields, portrays another pattern. A software engineer would term it ‘the nightmare of ignored bugs’ (Black, 1999, pp. 139–140): not only has the total number of unannotated genes essentially doubled, but there has been no significant progress in addressing the problems that are already known to exist. A large gap has persisted between the ‘found’ and ‘fixed’ lines for almost five years, and if the current knowledge base construction process is continued, there is no reason to think that this gap will be closed any time soon.
Fig. 4.
Function comment fields for all proteins in Swiss-Prot over time.
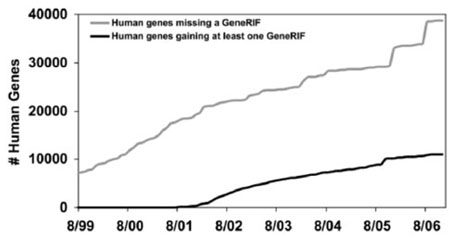
Although Figures 6 and 7 appear to depict non-terminating processes similar to Figures 3 and 4, these graphs can actually be interpreted differently given a greater context. Figures 6 and 7 plot GeneRIF annotations of Entrez Gene entries. In both Figure 6 and Figure 7, we are probably seeing situations where the total number of genes in the database is as high as it is likely to get, based on our best estimates of the number of genes in each species. If we project no further rise in the number of genes (or ‘found’ bugs), then we can extrapolate how long it will take to complete annotation of these species with GeneRIFs from the slopes of the two ‘fixed’ lines. (We discuss the implications of this point in the Conclusion.)
Fig. 6.
GeneRIF assignment to human genes in Entrez Gene over time. For simplicity, each Entrez Gene record is counted when first created, and discontinued records were ignored.
4.3 Interpreting other characteristics of the found/fixed graph
The graphs in Figures 6 and 7 also have characteristics that we have not investigated in the previous data. One principle of the found/fixed graph is that inflection points should correspond to known events—for example, in the case of a software development project, a sudden change in the number of fixed (or found) bugs might correspond to the release of a new version of the product to the testing department. Inflection points that do not correlate with known events are suggestive (although by no means diagnostic) of poorly managed processes (Black, 1998, p. 138). In these cases, inflection points in the growth of the number of Entrez Gene entries do correlate with known events. The spike for mouse between 3 January 2006 and 4 January 2006 (Fig. 7) corresponds to a reannotation of one of the first mouse genomic assemblies. The inflection points for human between 11 January 2005 and 1 January 2006, and again later between 7/1/2006 and 9/1/2006 (Fig. 6), correlate with NCBI's release of annotations on Builds 36.1 and 36.2 (Donna Maglott, personal communication).
4.4 Granularity of annotations
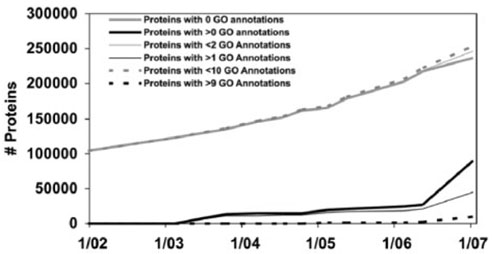
In our previous attempts to evaluate a complex knowledge base (Acquaah-Mensah and Hunter, 2002), a major stumbling block has been the issue of dealing with variability in the granularity of the data present. For instance, we have attempted in other work to assign different values to Gene Ontology annotations, depending on their depth in the hierarchy. The results have been unsatisfying; weightings were complicated, and produced a single number that was difficult to evaluate (or even to explain). Figure 5 shows how the found/fixed graph allows us to combine annotations of different ‘values’ in a single graph—in this case, we differentiate proteins depending on the number of Gene Ontology annotations with which they are associated, rather than counting simple presence versus absence—while still keeping the graph easily interpretable.
Fig. 5.
GO annotations for all proteins in Swiss-Prot while varying the threshold for the number of GO annotations. Three different threshold values are used (>0, >1 and >9), representing proteins with at least one, at least two, and at least ten GO annotations, respectively.
4.5 Predicting how long it will take to complete annotation with a data type
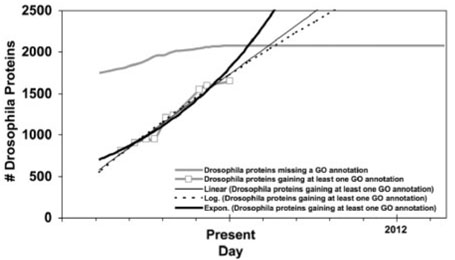
Figures 8–13 display the linear, exponential, and logarithmic functions fitted to the gained-annotations line for each graph. From the point at which each line crosses the missing-annotations line, we predict the number of years that would be required to achieve complete coverage for that annotation type in the given database if that function accurately describes the progress of the database curators in manually addressing missing information. The number of years predicted by each function, along with the correlation between the function and the data, are given in Table 1.
Fig. 8.
GO annotation of Drosophila proteins in Swiss-Prot over time with linear, exponential, and logarithmic functions fitted to the gained-annotations line.
Fig. 13.
GeneRIF assignment to mouse genes in Entrez Gene over time, with functions fitted to the gained-annotations line.
Table 1.
The number of years required to complete the annotation of each data type predicted by a linear, exponential, and logarithmic function fitted to each actual ‘annotations gained’ line to date, with R2 of the fit of the function to the actual growth curve. The largest R2 value for a given data type is given in bold. Differences in R2 values were not tested for statistical significance.
| Data type | linear | R2 | exponential | R2 | logarithmic | R2 |
|---|---|---|---|---|---|---|
| Swiss-Prot Drosophila GO annotations | 1.16 | 0.9570 | 0.55 | 0.9506 | 1.38 | 0.9572 |
| Swiss-Prot Mouse GO annotations | 3.06 | 0.8778 | 0.90 | 0.8436 | 3.75 | 0.8845 |
| Swiss-Prot all species GO annotations | 10.5 | 0.5746 | 3.05 | 0.7852 | 16.68 | 0.5530 |
| Swiss-Prot all species function annotations | 99.0 | 0.9807 | 9.12 | 0.8870 | 1.07 × 10⁹ | 0.8207 |
| Entrez Gene Human GeneRIFs | 13.0 | 0.9788 | 0.003 | 0.7132 | 24.83 | 0.9784 |
| Entrez Gene Mouse GeneRIFs | 38.3 | 0.9777 | 0.40 | 0.7227 | 629 396 | 0.9221 |
Table 1 allows us to characterize the actual progress of these public databases in addressing missing annotations. For three of the data types that we examined, the linear function gives the best fit to the data. For two of the data types, the logarithmic function gives the best fit. This suggests that it is not the case that manual annotation is becoming more efficient as time passes; manual annotation is addressing missing information either linearly or slower. As one anonymous reviewer pointed out, ‘the rate of new annotations does not only reflect the rate of curation, but also that of discovery (and publishing).’ This suggests an alternative to the hypothesis that the curation methodology is the bottleneck in the process—namely, that the pace of scientific publication is the limiting factor. However, data on the growth of MEDLINE itself, which is double-exponential (Hunter and Cohen, 2006, pp. 589–590), suggests otherwise, as do anecdotal reports on the difficulty that model organism databases have in keeping up with even a limited number of journals (Giles, 2007).
Swiss-Prot's addressing of missing Drosophila GO annotations represents the best-case scenario: the model suggests that all annotationless Drosophila proteins could have GO terms assigned in the next 1.4 years. The worst-case scenario is function comment annotations for all Swiss-Prot species, which cannot be expected to be achieved manually during the lifetime of this species. The median for the six data types that we examined is 8.4 years.
4.6 Collaborative curation
The contribution of the manual annotation community is highly regarded and essential to the understanding of the ever more complicated biological landscape—it is widely accepted that it produces the most accurate annotations currently available. However, the cost of obtaining annotations is expensive in regards to both financial expense and time (Seringhaus and Gerstein, 2007). Several solutions to this issue have been raised in the literature. One such solution is collaborative curation. There have been multiple calls to provide an incentive, such as a ‘citable acknowledgement,’ for researchers to voluntarily contribute to public databases in general, and annotation of database contents in particular (Seringhaus and Gerstein, 2007, Nature Editorial, 2007). There have been efforts to produce open-source software for multiuser annotation of database contents (Glasner et al., 2003, Schlueter et al., 2006, Wilkerson et al., 2006) and free text (Baral et al., 2005), as well as examples of successful community annotation projects. Both the Pseudomonas aeruginosa Community Annotation Project (PseudoCAP) (Stover et al., 2000, Brinkman et al., 2000) and a prototype being used for the annotation of the Arabidopsis thaliana Plant Genome Database (atGDB) (Schlueter et al., 2005) enable participants to collectively contribute gene structure annotations. Users are permitted to add annotations and make corrections using a web-based interface, and both systems employ some sort of manual curation process before changes are committed to the database. As the Internet takes on a greater and greater role in the sharing of information, the wiki architecture has recently been hailed by some as a potential solution, in particular for the problem of updating/correcting out-dated annotations (Salzberg et al., 2007, Wang et al., 2006). One anonymous reviewer pointed out a prototype wiki for proteins (WikiProteins6, Giles et al., 2007). We do not have data on the development processes of the collaborative annotation efforts. However, we note that the GeneRIF collection at NCBI allows community contribution of GeneRIFs in addition to the normal manual production process, and yet as Table 1 shows, this important data type may continue to be unavailable for all (human and mouse) genes for decades, despite the fact that its rate of growth is quite impressive (Lu et al., 2007, p. 272). So, at least for this example, it seems to be the case that collaborative curation does not solve the problem.
5 CONCLUSION
As we have demonstrated, the found/fixed graph and the characteristic patterns that it displays are not just tools for describing software product readiness for release and software development processes—they are useful tools for characterizing the construction processes and the completeness of the contents of some of the most important public resources in contemporary biology.
We have illustrated the use of the found/fixed graph with relatively straightforward examples, attempting in this article to handle no more than two heterogeneous data types in a single knowledge base. Our eventual goal is to use this metric to evaluate the construction of a large, highly inter-connected knowledge base of molecular biology, integrating many semantic classes of entities with a rich set of relationships.
5.1 Improving the model
As we point out earlier, this work makes two simplifying assumptions in modelling unannotated entries in Swiss-Prot and Entrez Gene as ‘found bugs’. One assumption is that simple absence of an annotation is equivalent to a fault. The other assumption is that we can model added annotations as ‘bug fixes’ despite the fact that we have no a priori reason to assume that the knowledge base builders actually intended to address the missing annotations. In future work, we will address both of these issues. In the first case, we will incorporate into our work a better model of a ‘test’ (and thereby, a better model of a ‘bug’). We will do this by using lists of genes found to be differentially expressed in microarray experiments as our ‘test suite.’ In this model, any gene that is on the list but is not annotated in (or is absent from) the knowledge base will be counted as a ‘found bug’. By focussing on experiments in particular domains, such as cancer or development, we can simulate another element that is missing from our current work: the assumption that tests are repeated at each testing cycle. In the second case, we will address the issue of intentional ‘bug fixes’ by modelling specific fix rates to characterize the change in the ‘found’ line.
5.2 Quantifying quality versus quantifying quantity
The work reported here explicitly claims to address issues of the quantity of knowledge base contents, essentially independently of quantifying the quality of knowledge base contents. This versatility can be characterized as a virtue of the approach, but it is also worth considering carefully both the utility of a system that only monitors quantity, and the potential for abuse (or, more mildly, misinterpretation) of a metric that ignores quality.
Our own experience (Acquaah-Mensah et al., 2002) suggests that the best approach to doing this is not to attempt to produce a single metric that integrates quantity and quality into an aggregate statistic. However, the found/fixed graph can be extended straightforwardly to incorporate quality-like information at the appropriate level of granularity. The software engineering metaphor for classifying annotations by quality is the distinguishing of bugs by severity. We can relate this metaphor to various characteristics of the data types. In Figure 5, we approximate quality as the number of GO annotations for a protein in Swiss-Prot, on the assumption that a protein with a larger number of GO annotations is better-annotated than a protein with fewer annotations. Arguably, this approach simply replaces one quantity-reflecting measure with another—more is not necessarily better, and we might like an additional indication of quality. In this case, the GO Consortium provides a quality assessment of annotations: all GO annotations include a value for the type of evidence supporting the assignment of that concept. The GO Consortium explicitly describes these evidence codes as indicating the reliability of annotations and the amount of confidence that one should have in them (GO Consortium, 2001:1432). Although they are not fully ordered [in the set-theoretic use of that term (Partee et al., 1993)], they are nonetheless useful for characterizing the quality of annotations. Specifically, they can be differentiated by the found/fixed graph in the same way as in Figure 5, just as non-ordered software characteristics [e.g. root cause analysis, or characterization of bugs by etiology, as opposed to characterizing them by symptom or by severity (Black, 1999, 129–133)] can be.
These approaches are clearly GO-centric, but more general ones can be applied to non-GO data types, as well. One family of approaches would focus on the specificity of the annotation; two forms of this could involve varying specificities of the annotation data type itself, and varying specificities of the annotated entity in the knowledge base. As an example of the former: any ontologically structured data point can be characterized with respect to information content (see e.g. Alterovitz et al., 2007, Lord et al., 2003a, b). Lord et al. (2003b) found that this measure, in connection with sequence similarity, uncovered a number of genes in LocusLink that were manually mis-annotated (pp. 1280–1281). As an example of the latter, one might differentiate between annotations assigned at the level of the protein family, versus annotations at the level of the individual protein. For databases that combine manual with automatic annotations, graphing this distinction is relevant to the issue of tracking quality.
5.3 Implications of the data reported here
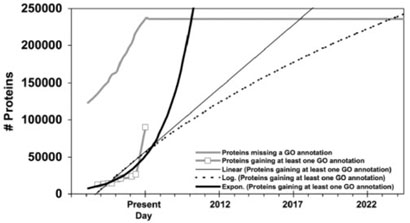
Even with the simplifying assumptions and the relatively weak proxies in the current work, the found/fixed metric still reveals important facts about the knowledge bases that we have examined. For example, even if we make the assumption that Entrez Gene already contains entries for every human and mouse gene, we can predict from the rate of rise of the ‘found’ lines in Figures 6 and 7 that if we continue the current rate of funding for NCBI annotation work (and do not either increase the number of NCBI annotators drastically or fund the development of automated methods to assist in the curation process), we will not have GeneRIFs for every human gene until 2020 (13 years from now). The graph suggests that we will not have a GeneRIF for every mouse gene until 2045 (38 years from now)—most likely beyond the working life of the reader of this paper. We cannot expect Gene Ontology annotations for all proteins of all species in Swiss-Prot until 2010 (3 years from now), but recall that this assumes exponential growth of annotation production and that no new proteins will be added to Swiss-Prot during that time, both of which are poor assumptions. For the three fairly disparate data types that we examined—Gene Ontology terms, GeneRIFs, and function comment fields—the median time to address all missing annotations by the current manual process is 8.4 years. Even if these estimates are off by a factor of two, this is far too long to be acceptable. One solution that suggests itself is to come to accept the necessity of—and develop methodologies that are robust in the face of—dealing with large amounts of automatically generated, noncurated data. The alternatives are to find massive additional funds for manual curation, rely on the collaborative efforts of the biological community, or to develop technologies for text mining and other forms of automated curator assistance. Burkhardt et al. (2006) and others have suggested that manual curation will always be necessary; the current approaches to doing it are clearly not keeping up with the growth rate of new biological entities that require annotation. The found/fixed graph helps us understand the consequences of the decisions that we make about the allocation of scarce resources in this era of reduced or uncertain funding for bioscience research, and underscores the importance of the development of automated methods for assisting the curators of the public databases.
Fig. 9.
GO annotation of mouse proteins in Swiss-Prot over time with functions fitted to the gained-annotations line.
Fig. 10.
Function comments for all proteins in Swiss-Prot over time with functions fitted to the gained-annotations line.
Fig. 11.
GO annotation of all proteins in Swiss-Prot, with functions fitted to the gained-annotations line.
Fig. 12.
GeneRIF assignment to human genes in Entrez Gene over time, with functions fitted to the gained-annotations line.
ACKNOWLEDGEMENTS
We thank Michael Bada for pointers to the literature on knowledge based system evaluation and other helpful discussion. We also thank the anonymous ISMB reviewers for their insightful comments and suggestions. This work was funded by NIH grant R01-LM008111 to Lawrence Hunter.
Conflict of Interest
none declared.
We thank one of our anonymous reviewers for this insight.
REFERENCES
- Acquaah-Mensah GK, Hunter L. Design and implementation of a knowledge-base for pharmacology; Proceedings of the 5th Annual Bio-Ontologies Meeting.2002. [Google Scholar]
- Alterovitz G, et al. GO PaD: the Gene Ontology Partition Database. Nucleic Acids Res. 2007;35(Database issue):D322–D327. doi: 10.1093/nar/gkl799. [DOI] [PMC free article] [PubMed] [Google Scholar]
- Baral C, et al. Collaborative curation of data from bio-medical texts and abstracts and its integration; Proceedings of the 2nd International Workshop on Data Integration in the Life Sciences; 2005. pp. 309–312. [Google Scholar]
- Beizer B. Software Testing Techniques. 2nd. International Thomson Computer Press; 1990. [Google Scholar]
- Beizer B. Black-Box Testing: Techniques for Functional Testing of Software and Systems. John Wiley and Sons: 1995. [Google Scholar]
- Black R. Managing the Software Testing Process. Microsoft Press; 1999. [Google Scholar]
- Boeckmann B, et al. The SWISS-PROT protein knowledgebase and its supplement TrEMBL in 2003. Nucleic Acids Res. 2003;31:365–370. doi: 10.1093/nar/gkg095. [DOI] [PMC free article] [PubMed] [Google Scholar]
- Brinkman FS, et al. Sequencing solution: use volunteer annotators organized via Internet. Nature. 2000;406:933. doi: 10.1038/35023188. [DOI] [PubMed] [Google Scholar]
- Burkhardt K, et al. A biocurator perspective: annotation at the Research Collaboratory for Structural Bioinformatics Protein Data Bank. PLoS Comput Biol. 2006;2:e99. doi: 10.1371/journal.pcbi.0020099. [DOI] [PMC free article] [PubMed] [Google Scholar]
- Camon E, et al. The Gene Ontology Annotation (GOA) Database: sharing knowledge in UniProt with Gene Ontology. Nucleic Acids Res. 2004;32:D262–D266. doi: 10.1093/nar/gkh021. [DOI] [PMC free article] [PubMed] [Google Scholar]
- Ceusters W, et al. Mistakes in medical ontologies: where do they come from and how can they be detected?; Ontologies in Medicine: Proceedings of the Workshop on Medical Ontologies.2003. [Google Scholar]
- Chen RO, et al. RIBOWEB: linking structural computations to a knowledge base of published experimental data. Proc. Intell. Syst. Mol. Biol. 1999:84–87. [PubMed] [Google Scholar]
- Cimino JJ, et al. Consistency across the hierarchies of the UMLS Semantic Network and Metathesaurus. J. Biomed. Informatics. 2003;36:450–461. doi: 10.1016/j.jbi.2003.11.001. [DOI] [PubMed] [Google Scholar]
- Cohen PR. Empirical methods for artificial intelligence. MIT Press; 1995. [Google Scholar]
- Editorial The database revolution. Nature. 2007;445:229–230. doi: 10.1038/445229b. [DOI] [PubMed] [Google Scholar]
- Gene Ontology Consortium Creating the Gene Ontology resource: design and implementation. Genome Res. 2001;11:1425–1433. doi: 10.1101/gr.180801. [DOI] [PMC free article] [PubMed] [Google Scholar]
- Giles J. Key biology databases go wiki. Nature. 2007;445:691. doi: 10.1038/445691a. [DOI] [PubMed] [Google Scholar]
- Giuse DA, et al. Evaluation of long-term maintenance of a large medical knowledge base. J. Am. Med. Assoc. 1995;2:297–306. doi: 10.1136/jamia.1995.96073832. [DOI] [PMC free article] [PubMed] [Google Scholar]
- Glasner JD, et al. ASAP, a systematic annotation package for community analysis of genomes. Nucleic Acids Res. 2003;31:147–151. doi: 10.1093/nar/gkg125. [DOI] [PMC free article] [PubMed] [Google Scholar]
- Groot P, et al. A quantitative analysis of the robustness of knowledge-based systems through degradation studies. Knowledge Information Syst. 2005;7:224–245. [Google Scholar]
- Hersh W, Bhupatiraju RT. TREC Genomics track overview; Proc. TREC 2003; 2003. pp. 14–23. [Google Scholar]
- Hewett M, et al. PharmGKB: the Pharmacogenetics Knowledge Base. Nucleic Acids Res. 2002;30:163–165. doi: 10.1093/nar/30.1.163. [DOI] [PMC free article] [PubMed] [Google Scholar]
- Horn F, et al. Automated extraction of mutation data from the literature: application of MuteXt to G protein-coupled receptors and nuclear hormone receptors. Bioinformatics. 2004;20:557–568. doi: 10.1093/bioinformatics/btg449. [DOI] [PubMed] [Google Scholar]
- Kaner C, et al. Testing computer software. 2nd. Wiley: 1999. [Google Scholar]
- Kaner C, et al. Lessons learned in software testing. Wiley: 2001. [Google Scholar]
- Köhler J, et al. Quality control for terms and definitions in ontologies and taxonomies. BMC Bioinformatics. 2006;7 doi: 10.1186/1471-2105-7-212. [DOI] [PMC free article] [PubMed] [Google Scholar]
- Lord PW, et al. Semantic similarity measures as tools for exploring the Gene Ontology. Pacific Symp. Biocomput. 2003a;8:601–612. doi: 10.1142/9789812776303_0056. [DOI] [PubMed] [Google Scholar]
- Lord PW, et al. Investigating semantic similarity measures across the Gene Ontology: the relationship between sequence and annotation. Bioinformatics. 2003b;19:1275–1283. doi: 10.1093/bioinformatics/btg153. [DOI] [PubMed] [Google Scholar]
- Lu Z, et al. Finding GeneRIFs via Gene Ontology annotations. Pac. Symp. Biocomput. 2006;11:52–63. [PMC free article] [PubMed] [Google Scholar]
- Lu Z, et al. GeneRIF quality assurance as summary revision. Pac. Symp. on Biocomput. 2007;12:269–280. doi: 10.1142/9789812772435_0026. [DOI] [PMC free article] [PubMed] [Google Scholar]
- Maglott D, et al. Entrez Gene: gene-centered information at NCBI. Nucleic Acids Res. 2005;33(Database Issue):D54–D58. doi: 10.1093/nar/gki031. [DOI] [PMC free article] [PubMed] [Google Scholar]
- Mitchell JA, et al. Gene indexing: characterization and analysis of NLM's GeneRIFs; AMIA Annual Symposium Proc; 2003. pp. 460–464. [PMC free article] [PubMed] [Google Scholar]
- Myers GJ. The Art of Software Testing. John Wiley and Sons: 1979. [Google Scholar]
- Partee BH, et al. Mathematical methods in linguistics. 1st. Kluwer Academic Publishers; 1993. [Google Scholar]
- Rubinstein R, Simon I. MILANO—custom annotation of microarray results using automatic literature searches. BMC Bioinformatics. 2005;6 doi: 10.1186/1471-2105-6-12. [DOI] [PMC free article] [PubMed] [Google Scholar]
- Salzberg SL. Opinion: Genome re-annotation: a wiki solution? Genome Biol. 2007;8:102. doi: 10.1186/gb-2007-8-1-102. [DOI] [PMC free article] [PubMed] [Google Scholar]
- Schlueter SD, et al. Community-based gene structure annotation. Trends Plant Sci. 2005;10:9–14. doi: 10.1016/j.tplants.2004.11.002. [DOI] [PubMed] [Google Scholar]
- Schlueter SD, et al. xGDB: open-source computational infrastructure for the integrated evaluation and analysis of genome features. Genome Biol. 2006;7:R111. doi: 10.1186/gb-2006-7-11-r111. [DOI] [PMC free article] [PubMed] [Google Scholar]
- Schmeltzer O, et al. Building large knowledge bases in molecular biology; Proc. Intel. Sys. Mol. Biol; 1993. pp. 345–353. [PubMed] [Google Scholar]
- Seringhaus MR, Gerstein MB. Publishing perishing? Towards tomorrow's information architecture. BMC Bioinformatics. 2007;8:17. doi: 10.1186/1471-2105-8-17. [DOI] [PMC free article] [PubMed] [Google Scholar]
- Shah PK, et al. Extraction of transcript diversity from scientific literature. PLoS Computational Biology. 2005;1:67–73. doi: 10.1371/journal.pcbi.0010010. [DOI] [PMC free article] [PubMed] [Google Scholar]
- Stover CK, et al. Complete genome sequence of Pseudomonas aeruginosa PA01, an opportunistic pathogen. Nature. 2000;406:959–964. doi: 10.1038/35023079. [DOI] [PubMed] [Google Scholar]
- Wang K. Comment: Gene-function wiki would let biologists pool worldwide resources. Nature. 2006;438:900–901. doi: 10.1038/439534a. [DOI] [PubMed] [Google Scholar]
- Wilkerson MD, et al. yrGATE: a web-based gene-structure annotation tool for the identification and dissemination of eukaryotic genes. Genome Biol. 2006;7:R58. doi: 10.1186/gb-2006-7-7-r58. [DOI] [PMC free article] [PubMed] [Google Scholar]


