

Abstract
An electrospray ionization mass spectrometry (ESI-MS) source and interface has been designed that enables efficient ion production and transmission in a 30 Torr pressure environment using solvents compatible with typical reversed-phase liquid chromatography (RPLC) separations. In this design, the electrospray emitter is located inside the mass spectrometer in the same region as an electrodynamic ion funnel. This avoids the use of a conductance limit ion inlet, as required by a conventional atmospheric pressure ESI source, and allows more efficient ion transmission to the mass analyzer. The new source, titled Subambient Pressure Ionization with Nanoelectrospray (SPIN), improves instrument sensitivity, increases the understanding of the electrospray process, and enables new electrospray interface designs. Performance of the SPIN source was evaluated by electrospraying standard solutions at 300 nL/min, and comparing results with those obtained from a standard atmospheric pressure ESI source that used a heated capillary inlet. The importance of desolvation was also investigated by electrospraying at different flow rates, which showed that the ion funnel provided an effective desolvation region to aid the creation of gas phase analyte ions. This initial study demonstrated a ∼ 5-fold improvement in sensitivity when the SPIN source was used compared to a standard atmospheric pressure ESI source.
INTRODUCTION
Electrospray ionization (ESI) has become one of the most widely applied ionization techniques for mass spectrometry (MS), 1, 2 and is used in a variety of chemical and biological applications due to its broad ability to create multiply charged gas-phase ions from solution and its ease of coupling with liquid separation techniques (e.g., liquid chromatography [LC]).3-6 ESI efficiency increases with the decrease of the liquid flow rate and can approach 100% at low nL/min flow rates. 7-12 Although working at these reduced flow rates provides higher sensitivity, the gains have been limited mainly due to large ion losses during transmission from atmospheric pressure to the low pressure region of the mass analyzer,13-15 with the greatest losses occurring at the inlet and skimmer of the ESI-MS interface.9, 13, 16
Analyte loss at the inlet is typically caused by dispersion of the charged droplets/ions in the electrospray plume across an area greater than can be effectively sampled by the inlet. Transmission efficiencies can be improved when large inner diameter (i.d.) inlet capillaries are used; however, increased pumping capacity is needed to maintain the vacuum requirements of the instrument and efficient desolvation can be challenging.17, 18 In addition, multi-capillary inlets that simultaneously sample different areas of the electrospray plume have increased MS sensitivity by decreasing ion loss at the front of the inlet,19-21 but ion losses at the inner wall of the inlet capillaries are still substantial.16 Similar to analyte loss at the inlet, substantial analyte loss occurs at the skimmer downstream of the inlet exit in the ESI interface. This phenomenon is caused by the expansion of the gas jet into the lower pressure environment of the mass spectrometer, which in turn disperses ions across an area greater than that sampled by the typical skimmer (∼ 1 mm i.d.). To greatly reduce ion loss in this region, the electrodynamic ion funnel has been developed.22-26 The ion funnel is a variation of a stacked ring ion guide27 where the aperture of the ion guide decreases gradually down to the i.d. of the conductance limiting orifice at the exit. This design allows jet expansion to occur inside the ion funnel and a majority of the buffer gas to be pumped away while the ions are captured, focused, and transmitted through the conductance limiting orifice.
It would be advantageous to perform ESI inside the first vacuum region of the mass spectrometer and completely remove the requirement of transmitting the analyte through a narrow bore capillary or small orifice. Electrospraying at very low pressures (traditionally referred to as electrohydrodynamic ionization28) works well for highly nonvolatile liquids such as glycerol,28 liquid metals,29, 30 and more recently ionic liquids,31 and has been used for space propulsion devices, also known as “colloidal thrusters”.32, 33 Characterization of these electrosprays have showed that the electrospray current, minimum flow rate for stable electrospray, and the size and charge of the emitted droplets are insensitive to the nature and pressure of the surrounding gas34 and suggests that the electrospray of solvents commonly used in LC/MS should be possible provided the higher volatility is not detrimental.
Herein, we report the first ESI source that functions effectively at pressures typical of the first MS vacuum region and uses liquids compatible with conventional reversed-phase gradient LC. We describe a new Subambient Pressure Ionization with Nanoelectrospray (SPIN) source and interface for increasing MS sensitivity. The reported developments also expand the basic understanding of the electrospray process, and provide a basis for new ESI source designs not possible with electrosprays operating at atmospheric pressure. Central to the implementation of this device is the use of a high pressure electrodynamic ion funnel. As recent developments with ion funnels effectively increased its working pressure to 30 Torr,20 we exploited the electrospray operation at this pressure to avoid electrical breakdown in the low pressure ESI source. A modified quadrupole mass spectrometer was used to characterize the SPIN source and interface. Profiles of the charge distribution in the electrospray plume were measured at various pressures from atmospheric pressure (1 atm or 760 Torr) down to 25 Torr. A MS calibration solution and a reserpine solution in methanol and water were electrosprayed at atmospheric pressure using a typical heated capillary inlet and at 30 Torr using the SPIN source to compare MS sensitivities. In addition, experiments were performed to determine the relationship between peak intensity and radio frequency (RF) voltage amplitude, as well as between peak intensity and the solution flow rate which highlight the importance of ion focusing and analyte desolvation in the ion funnel. This work is part of our longer term efforts to significantly improve the sensitivity and other performance aspects of ESI-MS, and provides the basis for approaching the ultimate level of performance achievable, where potentially every amenable molecule can be ionized and transmitted to the mass spectrometer.
EXPERIMENTAL
Chemicals
A solvent mixture for ESI was prepared by combining purified water (Barnstead Nanopure Infinity system, Dubuque, IA) and methanol (HPLC grade, Fisher Scientific, Fair Lawn, NJ) in a 1:1 ratio and adding 1% (v/v) acetic acid (Sigma-Aldrich, St. Louis, MO). A reserpine (Sigma-Aldrich) stock solution was prepared in a 1:1 solution of n-propanol (Fisher Scientific) and purified water and then diluted in the electrospray solvent to a final concentration of 1 μM. A calibrant solution (Agilent Technologies, Product # G2421A) that contained a mixture of betaine and substituted triazatriphosphorines dissolved in acetonitrile was also used to produce singly charged ions over a broad mass range.35
ESI
Electrospray emitters were prepared by chemical etching sections of 10 μm inner diameter (i.d.)/150 μm outer diameter (o.d.) fused silica capillary tubing (Polymicro Technologies, Phoenix, AZ,), as described in detail previously 36. The emitter was connected to a transfer capillary and a 100 μL syringe (Hamilton, Las Vegas, NV) by a stainless steel union, which also served as the connection point for the electrospray voltage. All solutions were infused from a Harvard Apparatus Model 22 syringe pump (Holliston, MA). Voltages were applied to the electrospray emitter via a Bertan high voltage power supply (Model 205B-03R, Hicksville, NY). A CCD camera with a microscope lens (Edmund Optics, Barrington, NJ) was used to observe the electrospray. The placement of the electrospray emitter was controlled by a 3-axis translation stage (Newport, Irvine, CA) for the atmospheric pressure ESI source and by a mechanical vacuum feedthrough (Newport) for the low pressure ESI source.
Instrumentation
An Agilent MSD1100 (Santa Clara, CA) single quadrupole mass spectrometer was equipped with an in-house-built ESI/dual ion funnel interface that is similar to what has been described previously.20, 37 The dual ion funnel configuration provides similar transmission efficiencies as a single ion funnel interface while tolerating higher gas inlet throughput.20 A 7.6 cm long, 490 μm i.d., stainless steel inlet capillary heated to 120 °C that terminated flush with the first electrode plate of the first ion funnel was used for all atmospheric pressure ESI experiments (see Figure 1a). The first ion funnel consisted of 70, 0.5 mm thick ring electrode plates that were separated by 0.5 mm thick Teflon insulators. The front section of the ion funnel consisted of 28 electrodes with a constant i.d. of 25.4 mm. The tapered section of the ion funnel included 42 electrodes that linearly decreased in i.d. from 25.4 mm to 2.5 mm. A 1.3 MHz RF with amplitude of 250 VP-P was used unless otherwise noted. The funnel had a DC voltage gradient of 18.5 V/cm. The last electrode plate was a DC-only conductance limiting orifice of 1.5 mm i.d. and biased to 210 V. Excess metal was removed from the electrode plates to reduce the capacitance, which enabled greater RF frequencies and voltages. The second ion funnel, consisting of 100 plates, was located in the subsequent vacuum region and was similar to the first ion funnel. A 740 kHz RF with amplitude of 70 VP-P was applied to the funnel along with a DC voltage gradient of 18.5 V/cm. A jet disrupter electrode 38 was placed 2 cm down stream from the first ion funnel plate and biased to 170 V. A 2.0 mm i.d. conductance limiting orifice was biased to 5 V. Mass spectra were acquired with a 0.1 m/z step size. Each spectrum used was the result of a 10-scan average to reduce the effects of any intensity fluctuations in the electrospray.
Figure 1.
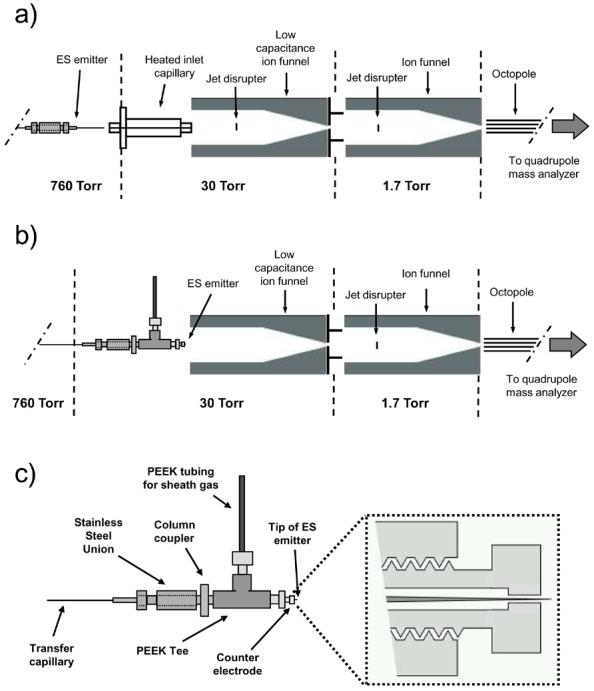
Drawings of (a) the atmospheric pressure ESI source with a heated inlet capillary and dual ion funnels, (b) the SPIN source with the electrospray emitter positioned at the entrance of the first ion funnel, and (c) the electrospray emitter and counter electrode device used in (b). The picture in the dotted box represents a cross sectional view of the counter electrode showing the protrusion of the electrospray emitter tip.
A stainless steel vacuum chamber was constructed to accommodate the placement of the electrospray emitter at the entrance of the first ion funnel (see Figure 1b). The chamber used three glass windows, one at the top and one on each side that allowed the use of lighting and a CCD camera for visual observation of the electrospray. The electrospray counter electrode, as shown in Figure 1c, was placed behind the tip of the emitter and held by a PEEK tee (Upchurch Scientific, Oak Harbor, WA) which was attached to a stainless steel union with a column coupler (Alltech, Deerfield, IL). The counter electrode was a 4 mm diameter disk 2 mm thick with a threaded section extending 6 mm from the back providing a connection to the PEEK tee via a PEEK fitting. A 1 mm diameter hole was drilled down the central axis of the counter electrode to allow for the protrusion of the electrospray emitter and a sheath gas for the electrospray. The counter electrode was biased 50 V greater than the first ion funnel plate to direct the electrospray ions/droplets into the ion funnel. The vacuum chamber contained feedthroughs for the electrospray voltage, an infusion capillary, and a gas line controlled by a leak valve. A rough pump (E1M18, BOC Edwards, Wilmington, MA) regulated by an in-line valve was used to pump the chamber. A gate valve was installed in the first ion funnel and located between the last RF/DC electrode plate and the conductance limiting orifice plate. This placement allowed electrospray chamber venting and emitter maintenance without the need to vent the entire mass spectrometer. To make the gate valve, a small strip of 0.5 mm thick Teflon was placed between the two ion funnel electrode plates and attached to an in-house built mechanical feedthrough that moved the Teflon over the conductance limiting orifice during venting of the electrospray chamber.
Electrospray current profiling
A linear array of 23 electrodes incorporated into the front section of a heated capillary assembly16 was used to profile the electrospray current plume at various chamber pressures. To make this array, a 490 μm i.d., 6.4 cm long, stainless steel capillary was silver soldered in the center of a stainless steel body. The metal immediately below the inlet was removed and a small stainless steel clamp was constructed on the inlet to press 23 Kapton-coated 340 μm o.d. copper wires in a line directly below the entrance of the inlet. The front of the inlet was machined flat and polished with 2000 grit sandpaper (Norton Abrasives, Worcester, MA) to make the ends of the wires an array of round, electrically isolated electrodes, each with a diameter of 340 μm. The other ends of the wires were connected to an electrical breadboard with one connection to common ground and another to a Keithley picoammeter (Model No. 6485, Keithley, Cleveland, OH) referenced to ground. The electrode array was installed inside the electrospray vacuum chamber in front of the electrospray emitter. The electrospray current was profiled by sequentially selecting and manually moving the appropriate wire for each of the 23 electrodes from the common ground output to the picoammeter input and acquiring 100 consecutive measurements that were averaged using the built-in data acquisition capabilities of the picoammeter.
RESULTS AND DISCUSSION
For initial characterizations, a 1:1 methanol:water solution was electrosprayed with chamber pressures that ranged from 755 Torr to 25 Torr. We discovered that narrow-bore (e.g., 5 and 10 μm i.d.) chemically etched emitters were necessary to produce a stable electrospray. Attempts to work with larger emitter i.d.s failed when the chamber pressure was reduced and gas bubbles formed inside the emitter. Reducing the i.d. of the emitter increased the flow resistance of the solution, which lowered the pressure at which the bubbles start to form. The electrosprays at 30 Torr were, on many occasions, allowed to operate for longer than an hour and were stable. Similar results were observed when an acetonitrile and water solution was used and when acetic acid was replaced by trifluoroacetic acid (TFA). Attempts to electrospray at pressures below 20 Torr resulted in electrical breakdown.
The electrospray currents at various pressures were profiled, using a linear array of charge collectors positioned in front of the electrospray emitter. We have previously shown the utility of this electrode array for characterizing electroprays.16 Figure 2 plots the current across the electrode array for various chamber pressures using the methanol and water solution infused at 300 nL/min with the emitter placed ∼ 3 mm from the array. This plot provides a profile for the current across the electrospray plume. Note that the higher pressures produced a plume that was ∼ 5 mm wide. At 100 Torr and 50 Torr, the plume narrowed slightly with an increased electrospray current density, and this behavior was more pronounced at 25 Torr. For all pressures, the total electrospray current remained unchanged at ∼ 25 nA. Although the current profiles in Figure 2 seem to suggest an increased current at the lower pressures, the detected current was verified to be independent of the chamber pressure by calculating the integrated current represented by the profiles which confirmed that the detected current did not significantly change during the course of the experiment. A possible explanation for the narrower electrospray plume profiles at lower pressures shown in Figure 2 comes from previous work by Fernández de la Mora and co-workers in which images of the Taylor cone and spray plume were obtained at electrospray source pressures of 912, 267, and 0.02 Torr for a solution of tetrabutyl ammonium tetraphenyl borate in tributyl phosphate.30 They observed a decrease in spray plume angle as the pressure was reduced due to an increase in ion mobility as the mean-free-path increased. A decrease in the spray plume angle at the lower pressures in our experiment could have produced the narrower ion/droplet plumes detected by the electrode array. In addition, the independence of the electrospray current on the surrounding gas pressure in this experiment is supported by previous work in electrohydrodynamic ionization where the electric current from the emitter was shown to be insensitive to the nature and pressure of the surrounding gas.34
Figure 2.

Plots of the electrospray current across the ion/droplet plume for various chamber pressures using an array of electrodes. The electrosprayed solution was 50:50 methanol and water with 1% (v/v) acetic acid infused at 300 nL/min and the emitter was placed ∼ 3 mm from the array.
Profiling of the electrospray current cannot distinguish gas-phase ions from charged droplets. This information is especially important for electrospraying in the SPIN source since the heated inlet capillary that provided energy for desolvation was eliminated. To investigate ionization efficiency, a single quadrupole mass spectrometer was interfaced with either a standard atmospheric pressure ESI source with a metal inlet capillary or the SPIN source. The atmospheric pressure ESI source used the same ion funnels, RF and DC voltages, and operating pressures as the SPIN source (Figure 1). Baseline measurements of a reserpine solution were initially acquired using the standard ESI source (Figure 3a). Figure 3b shows a spectrum from the same reserpine solution and same flow rate, but obtained using the SPIN source having the emitter positioned so that the ion/droplet plume was electrosprayed directly into the first ion funnel. Both the electrospray and ion funnel were operated at 30 Torr, which provided a signal intensity increase of ∼ 4-fold for reserpine. Similar results were obtained in subsequent experiments comparing the two ESI sources. In addition, a sheath gas of SF6 (an electron scavenger) was supplied to the electrospray through the hole in the counter electrode to test for possible corona discharge from operating the emitter at a high voltage and a reduced pressure. The presence of the SF6 did not alter the electrospray current or reserpine intensity suggesting that a corona discharge was not present in the SPIN source during these experiments. The RF voltage was also turned off while electrospraying to test the ion focusing of the SPIN source, which resulted in a large reduction in peak intensities. This indicated that the focusing field of the first ion funnel is necessary to effectively transmit the ions into the second ion funnel.
Figure 3.

Mass spectra from the analysis of a 1 μM reserpine solution infused at 300 nL/min using (a) the atmospheric pressure ESI source and a heated inlet capillary and using (b) the SPIN source with the emitter placed in the 30 Torr vacuum region at the entrance of the first ion funnel.
The SPIN source was further evaluated by analyzing a calibration solution that contained a mixture of betaine and substituted triazatriphosphorines dissolved in acetonitrile. The calibration solution was analyzed first using the standard atmospheric pressure ESI source with the heated inlet capillary (Figure 4a), and then analyzed using the SPIN source at 30 Torr at the same infusion flow rate (Figure 4b). The SPIN source provided a ∼ 5-fold increase in signal level that was reproducible in replicate measurements. Again, these results are consistent with a reduction in analyte ion loss by eliminating the losses associated with the use of a metal inlet capillary.
Figure 4.

Mass spectra from the analysis of a calibration solution infused at 300 nL/min using (a) the atmospheric pressure ESI source and a heated inlet capillary and using (b) the SPIN source with the emitter placed in the 30 Torr vacuum region at the entrance of the first ion funnel.
The importance of the effective potential for ion focusing in the SPIN source was further investigated by varying the RF voltage on the first ion funnel. Figure 5a shows a plot of reserpine intensity versus the amplitude of RF voltage applied to the first ion funnel. The peak intensity quickly rises as the voltage is increased and begins to level off. The larger RF voltages provided better ion focusing, which in turn contributed to the increased sensitivity with the maximum ion focusing occurring at ∼ 250 VP-P. The increase in signal could also be contributed, in part, by ion declustering39 and desolvation from RF heating in the ion funnel.40 The larger the RF voltage, the greater the amount of energy that is imparted to the ions/clusters, which can aid declustering.
Figure 5.

Plots of (a) reserpine peak intensity versus RF voltage amplitude of the first ion funnel and (b) reserpine peak intensity versus the flow rate of the sample. The error bars represent the standard deviation of three replicate measurements.
Analyte desolvation was explored by changing the solution flow rate and keeping the RF voltage fixed at 250 VP-P. Electrospray droplet size correlates with the flow rate,7, 41 as smaller flow rates create smaller droplets, and smaller droplets require less desolvation and fewer fission events to produce gas phase analyte ions. To determine whether smaller droplets improve desolvation in the SPIN source, the reserpine solution was infused at flow rates that ranged from 50 to 500 nL/min. The resulting reserpine peak intensity is plotted in Figure 5b. The peak intensity initially decreases as the flow rate is reduced from 500 to 300 nL/min, then decreases more gradually at the smaller flow rates. This more gradual decrease indicates that even though less reserpine is delivered to the emitter at the lower flow rates, a greater percentage of the reserpine is being converted to gas phase ions, as expected based on previous nanoESI studies9, 12 The ability of the SPIN source to desolvate droplets can also be inferred by comparing inlet transmission efficiencies with the increase in peak intensities. The metal inlet capillary used for the atmospheric pressure ESI source in these experiments typically has a transmission efficiency of ∼ 10 to 20 %.16 Therefore, if the efficiency was increased to 100 % by removing the inlet capillary, the expected increase in signal should be 5 to 10-fold. The 5-fold signal increase observed from the SPIN source is consistent with this expectation and suggests that the ionization efficiency is similar to the standard atmospheric pressure ESI source using a heated inlet capillary.
CONCLUSION
Proof of concept has been obtained for a new ESI source and ion funnel interface capable of producing and transmitting ions efficiently in a low pressure (30 Torr) environment, using solvents common for LC/MS. Three elements were important to the successful functioning of the SPIN source. First, desolvation was accomplished in a drift region. In this study, the drift region was the length of the ion funnel. Second, electrical breakdown was avoided by operating at a pressure of ∼ 30 Torr. Third, the smaller droplets created by the low flow rates improved the droplet evaporation and desolvation needed for analyte ionization. This is important even though the ionization efficiency in the SPIN source can be similar to an atmospheric ESI source and while analyte losses due to transmission through an inlet capillary can now be eliminated, a large majority of the analyte could still be effectively lost due to incomplete desolvation. As a result, future work will focus on characterizing the absolute ionization efficiency, particularly at lower nanoelectrospray flow rates, and implementing approaches that could further improve efficiency by the better desolvation of analyte ions in the low pressure chamber.
ACKNOWLEDGEMENTS
Portions of this research were supported by the NIH National Center for Research Resources (RR018522), and the NIH National Cancer Institute (R21 CA126191). Experimental portions of this research were performed in the Environmental Molecular Sciences Laboratory, a U.S. Department of energy (DOE) national scientific user facility located at the Pacific Northwest National Laboratory (PNNL) in Richland, Washington. PNNL is a multiprogram National Laboratory operated by Battelle for the DOE under Contract No. DE-AC05-76RLO 1830.
REFERENCES
- 1.Yamashita M, Fenn JB. J. Phys. Chem. 1984;88:4451–4459. [Google Scholar]
- 2.Fenn JB, Mann M, Meng CK, Wong SF, Whitehouse CM. Mass Spectrom. Rev. 1990;9:37–70. [Google Scholar]
- 3.Qian WJ, Jacobs JM, Liu T, Camp DG, Smith RD. Mol. Cell. Proteomic. 2006;5:1727–1744. doi: 10.1074/mcp.M600162-MCP200. [DOI] [PMC free article] [PubMed] [Google Scholar]
- 4.Shen Y, Zhang R, Moore RJ, Kim JK, Metz TO, Hixson KK, Zhao R, Livesay EA, Udseth HR, Smith RD. Anal. Chem. 2005;77:3090–3100. doi: 10.1021/ac0483062. [DOI] [PubMed] [Google Scholar]
- 5.Swanson SK, Washburn MP. Drug Discov. Today. 2005;10:719–725. doi: 10.1016/S1359-6446(05)03450-1. [DOI] [PubMed] [Google Scholar]
- 6.Shen YF, Smith RD. Exp. Rev. Proteomic. 2005;2:431–447. doi: 10.1586/14789450.2.3.431. [DOI] [PubMed] [Google Scholar]
- 7.Wilm MS, Mann M. Int. J. Mass Spectrom. Ion Processes. 1994;136:167–180. [Google Scholar]
- 8.Smith RD, Shen Y, Tang K. Accounts Chem. Res. 2004;37:269–278. doi: 10.1021/ar0301330. [DOI] [PubMed] [Google Scholar]
- 9.Wilm M, Mann M. Anal. Chem. 1996;68:1–8. doi: 10.1021/ac9509519. [DOI] [PubMed] [Google Scholar]
- 10.Valaskovic GA, Kelleher NL, Mclafferty FW. Science. 1996;273:1199–1202. doi: 10.1126/science.273.5279.1199. [DOI] [PubMed] [Google Scholar]
- 11.Bahr U, Pfenninger A, Karas M, Stahl B. Anal. Chem. 1997;69:4530–4535. doi: 10.1021/ac970624w. [DOI] [PubMed] [Google Scholar]
- 12.Karas M, Bahr U, Dulcks T. Fresenius J. Anal. Chem. 2000;366:669–676. doi: 10.1007/s002160051561. [DOI] [PubMed] [Google Scholar]
- 13.Kebarle P, Tang L. Anal. Chem. 1993;65:A972–A986. [Google Scholar]
- 14.Cech NB, Enke CG. Mass Spectrom. Rev. 2001;20:362–387. doi: 10.1002/mas.10008. [DOI] [PubMed] [Google Scholar]
- 15.Smith RD, Loo JA, Edmonds CG, Barinaga CJ, Udseth HR. Anal. Chem. 1990;62:882–899. doi: 10.1021/ac00208a002. [DOI] [PubMed] [Google Scholar]
- 16.Page JS, Kelly RT, Tang K, Smith RD. J. Am. Soc. Mass Spectrom. 2007;18:1582–1590. doi: 10.1016/j.jasms.2007.05.018. [DOI] [PubMed] [Google Scholar]
- 17.Schneider BB, Javaheri H, Covey TR. Rapid Commun. Mass Spectrom. 2006;20:1538–1544. doi: 10.1002/rcm.2511. [DOI] [PubMed] [Google Scholar]
- 18.Bruins A. Mass Spectrom. Rev. 1991;10:53–77. [Google Scholar]
- 19.Kim T, Udseth HR, Smith RD. Anal. Chem. 2000;72:5014–5019. doi: 10.1021/ac0003549. [DOI] [PubMed] [Google Scholar]
- 20.Ibrahim Y, Tang KQ, Tolmachev AV, Shvartsburg AA, Smith RD. J. Am. Soc. Mass Spectr. 2006;17:1299–1305. doi: 10.1016/j.jasms.2006.06.005. [DOI] [PMC free article] [PubMed] [Google Scholar]
- 21.Kelly RT, Page JS, Tang KQ, Smith RD. Anal. Chem. 2007;79:4192–4198. doi: 10.1021/ac062417e. [DOI] [PubMed] [Google Scholar]
- 22.Kim T, Tolmachev AV, Harkewicz R, Prior DC, Anderson GA, Udseth HR, Smith RD, Bailey TH, Rakov S, Futrell JH. Anal. Chem. 2000;72:2247–2255. doi: 10.1021/ac991412x. [DOI] [PubMed] [Google Scholar]
- 23.Shaffer SA, Tang K, Anderson GA, Prior DC, Udseth HR, Smith RD. Rapid Commun. Mass Spectrom. 1997;11:1813–1817. [Google Scholar]
- 24.Page JS, Tolmachev AV, Tang KQ, Smith RD. J. Am. Soc. Mass Spectrom. 2006;17:586–592. doi: 10.1016/j.jasms.2005.12.013. [DOI] [PMC free article] [PubMed] [Google Scholar]
- 25.Julian RR, Mabbett SR, Jarrold MF. J. Am. Soc. Mass Spectrom. 2005;16:1708–1712. doi: 10.1016/j.jasms.2005.06.012. [DOI] [PubMed] [Google Scholar]
- 26.Lynn EC, Chung MC, Han CC. Rapid Commun. Mass Spectrom. 2000;14:2129–2134. doi: 10.1002/1097-0231(20001130)14:22<2129::AID-RCM144>3.0.CO;2-M. [DOI] [PubMed] [Google Scholar]
- 27.Gerlich D. In: State-Selected and State-to-State Ion-Molecule Reaction Dynamics. Part 1. Experiment. Ng CY, Baer M, editors. LXXXII. Wiley; New York: 1992. pp. 1–76. [Google Scholar]
- 28.Cook KD. Mass Spectrom. Rev. 1986;5:467–519. [Google Scholar]
- 29.Prewett PD, Mair GLR. Focused ion beams from LMIS. Research Study Press; Somerset, UK: 1991. [Google Scholar]
- 30.Gamero-Castano M, Aguirre-de-Carcer I, de Juan L, Fernandez de la Mora J. J. Appl. Phys. 1998;83:2428–2434. [Google Scholar]
- 31.Romero-Sanz I, de la Mora JF. J. Appl. Phys. 2004;95:2123–2129. [Google Scholar]
- 32.Krohn VE. Electrostatic Propulsion. Academic; New York: 1961. [Google Scholar]
- 33.Hendricks CD. J. Colloid Interface Sci. 1962;17:249–259. [Google Scholar]
- 34.Aguirre-de-Carcer I, Fernandez de la Mora J. J. Colloid Interface Sci. 1995;171:512–517. [Google Scholar]
- 35.Flanagan JM. US Patent 5,872,359 1999
- 36.Kelly RT, Page JS, Luo Q, Moore RJ, Orton DJ, Tang K, Smith RD. Anal. Chem. 2006;78:7796–7801. doi: 10.1021/ac061133r. [DOI] [PMC free article] [PubMed] [Google Scholar]
- 37.Shaffer SA, Tolmachev A, Prior DC, Anderson GA, Udseth HR, Smith RD. Anal. Chem. 1999;71:2957–2964. doi: 10.1021/ac990346w. [DOI] [PubMed] [Google Scholar]
- 38.Page JS, Bogdanov B, Vilkov AN, Prior DC, Buschbach MA, Tang K, Smith RD. J. Am. Soc. Mass Spectrom. 2005;16:244–253. doi: 10.1016/j.jasms.2004.11.003. [DOI] [PMC free article] [PubMed] [Google Scholar]
- 39.Thomson BA. J. Am. Soc. Mass Spectrom. 1997;8:1053–1058. [Google Scholar]
- 40.Moision RM, Armentrout PB. J. Am. Soc. Mass Spectrom. 2007;18:1124–1134. doi: 10.1016/j.jasms.2007.03.011. [DOI] [PubMed] [Google Scholar]
- 41.Fernandez de la Mora J, Loscertales I. J. Fluid Mech. 1994:155–184. [Google Scholar]