

Abstract
In order to identify phosphoproteins regulated by the phosphoprotein phosphatase (PPP) family of S/T phosphatases, we performed a large-scale characterization of changes in protein phosphorylation on extracts from HeLa cells treated with or without calyculin A, a potent PPP enzyme inhibitor. A label-free comparative phosphoproteomics approach using immobilized metal ion affinity chromatography and targeted tandem mass spectrometry was employed to discover and identify signatures based upon distinctive changes in abundance. Overall, 232 proteins were identified as either direct or indirect targets for PPP enzyme regulation. Most of the present identifications represent novel PPP enzyme targets at the level of both phosphorylation site and protein. These data can be used to define the underlying signaling pathways and events regulated by the PPP family of S/T phosphatases.
Keywords: Label-free quantitation, Targeted MS/MS, AMT tag pipeline, Comparative phosphoproteomics, Immobilized metal ion affinity chromatography (IMAC), Mass spectrometry, 20 μm ID monolithic column, Phosphoprotein phosphatase (PPP) family, Ser/Thr protein phosphatase, Calyculin A
INTRODUCTION
In eukaryotes important functions ranging from metabolism and gene expression to cell cycle regulation and cellular stress responses are governed by reversible phosphorylation at specific serine, threonine, and tyrosine protein residues. Together with protein kinases, phosphatases control the phosphorylation status of proteins in the cell. Members of the phosphoprotein phosphatase (PPP) structural family of S/T protein phosphatases, which includes protein phosphatase 1 (PP1), protein phosphatase 2A (PP2A) and others, control the cellular function of a wide variety of proteins. This may occur by direct dephosphorylation of a protein or indirectly via regulation of other kinases, phosphatases, or protein partners. Malfunctions of PPP enzymes have been implicated in numerous disease states,1-3 underscoring the importance of defining cellular targets for these enzymes. However, our knowledge of substrates and pathways regulated by PPP enzymes has lagged behind that of protein S/T kinases. Unlike many kinases, the substrate specificity for this family of phosphatases is not defined by consensus sequences within each substrate, but is instead controlled in a complex manner by regulatory subunits and protein-protein interactions within the cell.4, 5 Identification of substrates and downstream effectors for PPP enzymes is thus best addressed in the context of the cell.
Qualitative global phosphoproteomics studies typically focus on cells experiencing a single defined condition,6-10 however this offers little information about the relevance of a phosphoprotein in the context of a particular pathway or cell response. Regulatory pathways can be more effectively probed with quantitative and comparative approaches that measure changes between the resting and treated states. Comparative quantitative studies of the phosphoproteome have thus far been rare and typically involve the use of stable isotopic labeling e.g. with either 3D-methanol or 13C, 14N -SILAC or iTRAQ reagent 11-14. Mann and colleagues recently combined triple-encoding SILAC and phosphopeptide enrichment techniques for identification and quantitation of phosphorylation sites as a function of stimulus, time, and subcellular location.14 However, isotopic labeling can be costly and may increase the sample complexity.
Label-free approaches for quantitative proteomics have been hindered primarily by technical problems such as non-linear responses and strongly biased detection of co-eluting species due to ionization suppression effects, especially in the circumstance of complex biological matrixes. Recently, our lab developed and applied small ID (10 and 20 μm i.d.) silica-based monolithic capillary columns for more quantitative and sensitive proteomics measurements and showed that low nL/min LC flow rates for ESI-MS improved quantitation based upon the more uniform signal intensities obtained for different peptides and good linear correlations between MS responses and peptide amounts.15, 16 With this development, in the present study we employed a targeted and label-free approach to identify phosphopeptides whose abundance changed in response to treatment with an inhibitor of the PPP family of phosphatases. Abundance profiles of features from replicate LC-MS analyses of phosphopeptides derived from untreated and calyculin A-treated HeLa cells were created using recently developed alignment and clustering algorithms.17 Features up-regulated in treated samples were then targeted for fragmentation in LC-MS/MS analyses. This analysis identified 583 unique phosphopeptides representing 416 unique proteins. Of these, 285 phosphopeptides representing 232 proteins appeared to be regulated by PPP enzymes. The majority of these represent new PPP targets.
EXPERIMENTAL PROCEDURES
Cell culture and treatment
HeLa cells were grown in Dulbecco’s Modified Eagle Medium with high glucose (Invitrogen, Carlsbad, CA) supplemented with 10% fetal bovine serum (Clontech, Mountain View, CA) and penicillin/streptomycin (Invitrogen) at 37°C in 5% CO2. At optimal confluency, cells were treated with DMSO vehicle (control), 10 nM or 20 nM calyculin A for 15 min at 37°C and harvested for SDS-PAGE or protein extraction.
SDS-PAGE and western blotting
Cells were lysed in (Tris-buffered saline (TBS) with 2% SDS, 5 μM zinc acetate, 1 mM sodium orthovanadate, 2 mM β-glycerophosphate, 1 mM PMSF, EDTA-free protease inhibitor cocktail (Roche Applied Science, Indianapolis, IN), 100 nM microcystin) and boiled for 5 min. Protein concentrations were determined using the BCA protein assay kit (Pierce, Rockford, IL) with BSA as standard. Samples were diluted in SDS gel loading buffer (25 mM Tris-HCl pH 6.8, 12 mM EDTA, 2% SDS, 160 mM sucrose, 0.1% bromophenol blue, 2% β-mercaptoethanol), and 25 μg of each sample were subjected to SDS-PAGE using either a 6% (for the phospho-T blot) or a 12% (for elongation factor 2 (EF2) blots) resolving gel. Proteins were transferred to nitrocellulose membranes (Schleicher and Schuell Bioscience) for 1 h at 100 V in 50 mM Tris, 39 mM glycine, 0.03% SDS, 20% methanol (pH 9). The membranes were incubated in blocking buffer (5% non-fat milk, 0.1% Tween-20 in TBS) for 1 h at room temperature. The phospho-T blot was incubated with phospho-T primary antibody (1:500, Cell Signaling Technology, Danvers, MA) in TBS containing 0.1% Tween (TBST) and 5% BSA overnight at 4°C, and bound antibody detected with goat anti-rabbit IgG secondary antibody conjugated to horseradish peroxidase (1:5000, Cell Signaling Technology) and chemiluminescence (ECL plus Western Blotting Detection System, Amersham Biosciences, Pittsburgh, PA). Because the antibodies for total and phospho-T56 EF2 were both from rabbit, a single blot containing two lanes for each sample was prepared. A lane for each sample was probed for either total or phospho-T56 EF2 together with glyceraldehyde-3-phosphate dehydrogenase (GAPDH) as a loading control. The section of the blot probed with phospho-T56 EF2 primary antibody (1:500) was incubated overnight at 4°C. Other portions of the blot were incubated with total EF2 primary antibody (1:500) or GAPDH primary antibody (1:16000, Ambion, Austin, TX) for 1 h at room temperature. Blots were washed with TBST, and bound phospho-T56 or total EF2 antibody detected with goat anti-rabbit secondary antibody conjugated to IR-680 dye (1:10000, Molecular Probes, Eugene, OR), while GAPDH antibody binding was visualized with goat anti-mouse secondary antibody conjugated to IR-680 dye (1:10000, Molecular Probes). Signals were quantified using an Odyssey infrared imaging system (Li-Cor Biosciences, Lincoln, NE). Fluorescent signals for phospho- and total EF2 were normalized to their respective GAPDH signals, then the ratio of phospho-T56 EF2: total EF2 was calculated.
Protein extraction, digestion and methylation
For each sample, protein was extracted using Trizol reagent (Invitrogen, Inc.) according to the manufacturer’s instructions with modifications as described.18 The final protein pellet was resolubilized in 6 M guanidine hydrochloride. Two batches of cells (from 5 nearly confluent 100 mm plates) were independently treated and harvested, followed by protein extraction. Proteins from the two independent biological samples were pooled. Protein concentration was determined and the extracts were stored at - 80°C until further use. Samples were diluted 10-fold with 50 mM NH4HCO3 (pH 7.4) and digested with modified trypsin (Promega, Madison, WI) at a trypsin/protein ratio of 1:20 at 37 °C for 4 h, then for an additional 16 h at room temperature after treatment with a second aliquot of trypsin. Proteolysis was terminated by acidifying the reaction mixture with glacial acetic acid (HOAc). The tryptic digest was desalted using a SPE C18 column (Supelco, Bellefonte, PA), dried under vacuum, then methylated according to the published protocol6 with the exception that the 1 h methylation reaction was repeated a second time to ensure complete methylation.
IMAC
Methylated peptides from each sample (~1.5 mg) were resuspended in 600 μL of 0.1% HOAc/MeCN/MeOH (1:1:1), and loaded onto Fe+3 -activated IMAC MacroTrap cartridges (3 mm i.d. × 8 mm length) (Michrom, Auburn, CA) custom packed with POROS 20 MC resin (Applied Biosystems, Foster city, CA). The IMAC cartridges were washed first with 300 μL of 25/74/1 MeCN/H2O/HOAc containing 100 mM NaCl, then with 300 μL 0.1% acetic acid, and were eluted with 150 μL of 50 mM Na2HPO4 (pH~8.5). Eluted peptides were immediately acidified with glacial HOAc to pH~4.
Quantitative LC-MS analysis by LC-FTICR
To achieve ultra-sensitive comparative phosphoproteomics measurements, aliquots of IMAC-enriched samples were analyzed using a 20 μm i.d. silica-based monolithic column (~20 nL/min) coupled to an 11 Tesla FTICR 19. Samples were loaded onto a reversed phase pre-column (360 μm O.D. × 75 μm I.D.) packed with 5 cm of YMC 5-15 μm C18 resin (Waters Inc., Milford, MA), washed with 0.1% HOAc, then the pre-column was connected to an analytical HPLC silica-based monolithic column (360 μm O.D. × 20 μm I.D., 40 cm long) integrated with a laser-pulled electrospray ionization emitter tip (2-4 μm in diameter). The HPLC gradient (A = 100 mM HOAc in water, B = 80% MeCN/100 mM HOAc in water) was 0 – 40% B for 180 min, 40 – 60% B for 20 min, 60 –100% B for 15 min, 100 – 0% B for 10 min, and 0% B for an additional 120 min to re-equilibrate the column. Replicate LC-FTICR analyses were performed for treated (5 analyses) and control (4 analyses) samples.
Data analysis pipeline
The analysis pipeline used for this study is outlined in Figure 1. Features from all the LC-FTICR analyses were collapsed into mass, elution time and abundance values using the Decon2LS and VIPER software packages (http://ncrr.pnl.gov/software/).20 After each analysis was aligned to one baseline dataset to correct for mass and elution time variation, abundance profiles of common features with similar mass and elution time were collated into a master list. Each group of common features is referred to as a cluster. The mass and elution time of each cluster was calculated as the median of the mass and elution time of each set of grouped features. 17
Figure 1.

The data analysis pipeline used for this study. Replicate LC-MS analyses were performed on control and treated samples and accurate mass and time features discovered in each sample. The datasets were aligned to each other to correct for mass measurement and elution time drifts. Similar features from all experiments were grouped together into one cluster if their mass and elution times were similar by using single linkage clustering. As a result a feature master list was created, with each cluster having an abundance in an experiment equal to the intensity of the feature in that experiment that was mapped to the cluster. The abundance profile of features in a cluster was used to select those clusters whose features were up-regulated in treated samples as compared to control samples, after normalization was performed. The m/z and elution time of these clusters were used to perform targeted LC-MS/MS analyses. Clusters in the master list were then aligned and peak matched against peptides identified by LC-MS/MS analyses using an automated method that controlled the FDR of the process by an extension of the decoy database method to include the use of elution time tolerances.
Two target lists were created from this master list by selecting those clusters showing greater abundance in treated samples relative to control samples at two different levels of statistical significance, using z-score thresholds of 1 and 0.5 respectively, then entered into the LTQ instrument XCalibur control software (ThermoElectron, San Jose, CA) as inclusion lists to prioritize the acquisition of MS/MS spectra for features that were up-regulated in treated samples. Because the software does not allow specification of LC elution times in the inclusion list, we partitioned the LC-MS/MS experiment into 27 segments of 10 min intervals each. The normalized elution times (NETs) (defined in Supplementary Material) of the clusters in the target lists were scaled into the time segments and each cluster put into its respective segment; clusters at segment boundaries were entered into straddling segments. Elution times of the clusters were adjusted for expected variability for the analysis by first performing screening analyses in normal data-dependent mode on samples and realigning the clusters to the screening analyses. An additional dead time correction was made by manually entering an adjustment based on the m/z of three ions we observed in the screening analysis.
We acquired MS/MS spectra for the 10 most abundant species in the inclusion list after each MS scan, with up to 3 MS/MS spectra allowed for each species (to provide the highest quality merged spectra). In addition, we performed normal data-dependent analyses for the 10 most abundant species from each MS scan for any time segment that lacked inclusion list features to maximize the possibility of identifying peptides of changing abundance. For each target list, two replicate analyses were performed for the control and treated sample. HPLC conditions used for these analyses were identical to those for LC-MS analyses, except that a 360 μm O.D. × 100 μm I.D. pre-column packed with 5 cm of YMC 5-15 μm C18 resin (Waters Inc., Milford, MA) and an analytical HPLC silica-based monolithic column (360 μm O.D. × 50 μm I.D., 40 cm long) integrated with a laser-pulled electrospray ionization emitter tip (2-4 μm in diameter) were utilized.
The targeted LC-MS/MS results were analyzed by SEQUEST using static methylation on D, E and the C terminus, as well as dynamic phosphorylation of S, T and Y residues. Tandem MS peaks were generated by extract_msn.exe, part of the SEQUEST software package. The human International Protein Index (IPI) database (Version 3.05 containing 49,161 protein entries, available on line at www.ebi.ac.uk/IPI) was combined with its reversed sequences and used in the SEQUEST search. LC-MS clusters were identified by aligning the clusters to the LC-MS/MS database of results and matching clusters to peptides based on mass and elution time tolerances. The matching was done while controlling the false discovery rate (FDR) as described in Supplementary Materials.
To measure the probability of correct phosphorylation site localization in each identified peptide that passed the FDR, a probability-based score, the AScore, was calculated for each phosphorylation site based on the presence of site-determining ions in MS/MS spectra, according to Gygi’s recently published approach.21
RESULTS
Establishing calyculin A treatment conditions
To define conditions for elevating phosphorylation, HeLa cells were treated with various doses of calyculin A for increasing amounts of time. Phosphorylation was elevated with 10-20 nM calyculin A treatment as early as 15 min (Fig 2). To minimize potential toxicity from exposure to this potent phosphatase inhibitor, treatment with 10 nM calyculin A for 15 min was chosen to prepare samples for proteomics analysis.
Figure 2.
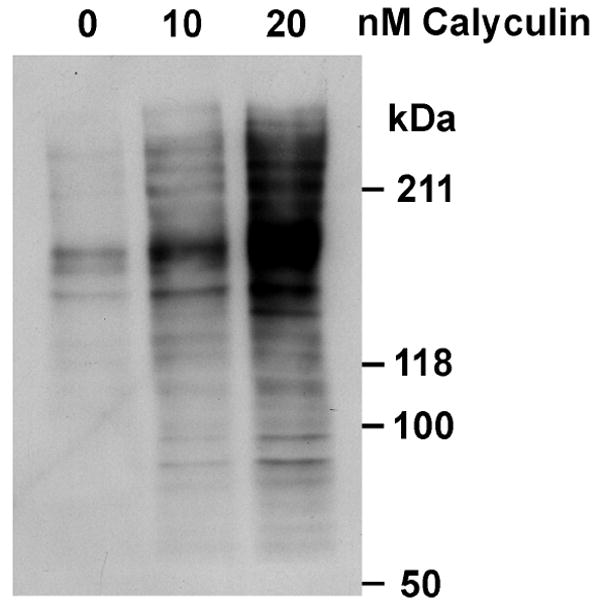
Elevation of protein phosphorylation in response to calyculin A treatment. Samples treated with DMSO vehicle control (0 nM), 10 nM or 20 nM calyculin A were subjected to SDS-PAGE and western blot analysis for phospho-T. The migration of molecular weight standards is marked.
Identification of phosphopeptides using the global targeted approach
1351 clusters were identified with a constraint of 5% FDR at 2.3 standard deviations (Mahalanobis distance) of mass and elution time variability. This corresponded to an elliptical region with a mass tolerance of 12 ppm and a NET tolerance of 0.06. As a result, 583 phosphopeptides were identified. The XCorr threshold was 2.65 for charge 3+ peptides and was 2.01 for charge 2+ peptides. These peptides are listed in Supplementary Table 1. Spectra for all 583 phosphopeptides and their SEQUEST identification information are included in the SpectrumLook Software Package (see Supplementary Materials).
Quantitation of protein phosphorylation
A t-test was performed at a significance level of 5% on the set of identified clusters after performing a log base 2 transformation of the intensities. 184 phosphopeptides were found to be differentially abundant, with 145 exhibiting up-regulation in the treated condition (listed in Supplementary Table 2A). Figure 3 shows the clustergram of peak areas of the phosphopeptides inferred as being differentially abundant from the t-test.
Figure 3.
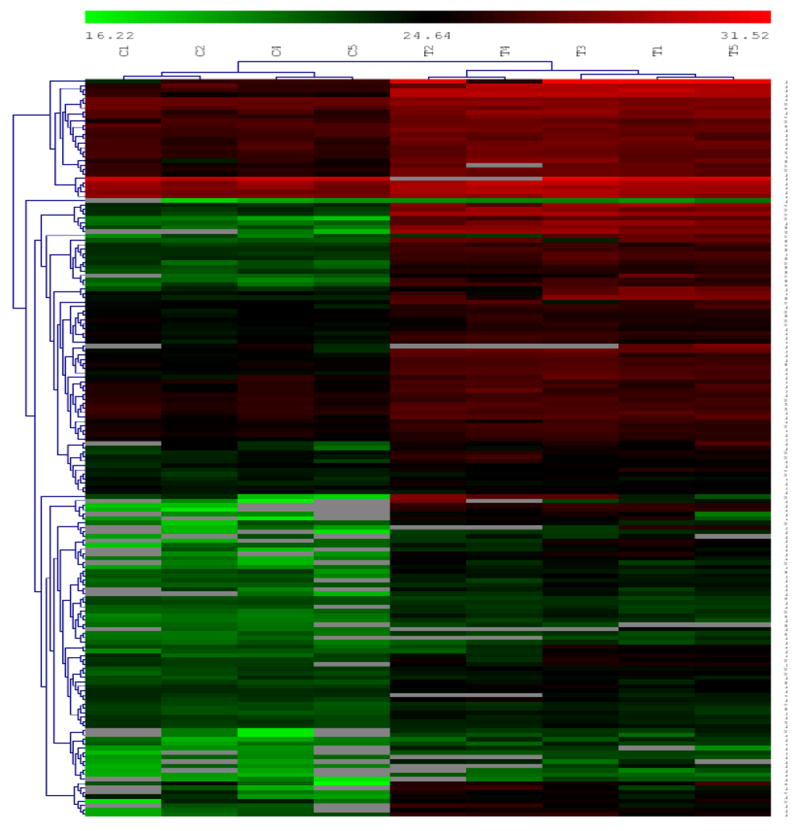
Clustergram of peak areas for phosphopeptides inferred as being differentially abundant between the four control (labeled C1 to C5) and five treated samples (labeled T1 to T5). We can see several different clusters showing different patterns of differential expression. Prominently, we see several clusters showing up-regulation in treated samples in the upper half of the clustergram, while the lower section shows clusters showing up-regulation in control samples.
A number of phosphopeptides that were either undetected or detected only once in one condition, but were found three or more times in the other condition, were also considered to have changed significantly: 90 phosphopeptides were observed 3-5 times in treated samples, but were not observed or observed only once in control (referred to as C1T3), whereas 11 phosphopeptides were found in control samples 3-4 times, but were detected only once or not at all in treated samples (referred to as C3T1). These phosphopeptides, together with their abundance information, are included in Supplementary Table 2B.
Table 1 summarizes the number of identified phosphopeptides for different types of MS analyses (5% FDR), and the number in the final phosphopeptide lists after peak matching of the clusters to the AMT tag database (5% FDR, 583 phosphopeptides, listed in Supplementary Table 2C). From Table 1, it is clear that the greatest number of changing phosphopeptides were identified in the targeted analyses of treated samples. In normal data-dependent analyses of control and treated samples, although 218 phosphopeptides were identified, only 60 (standard t-test plus C1T3 peptides) of these showed significant up-regulation in the treated sample. Similarly, only 54 phosphopeptides up-regulated in response to calyculin A treatment were detected in targeted analyses for control samples. In contrast, 189 up-regulated phosphopeptides were identified from targeted analyses of treated samples. This indicates the effectiveness of using the targeted approach to identify changed features (in this study, up-regulated features) in treated samples compared to the use of normal data-dependent analysis. Even though all features in the target lists were chosen based on their up-regulation, some down-regulated features and C3T1 peptides were also identified. This is not surprising, since we programmed the MS/MS analysis in such a way that when the targets were not available during a given time interval, the LTQ instrument acquired MS/MS for the 10 most abundant peptides in its normal data-dependent mode of operation to identify more phosphopeptides. Because we limited our target lists to up-regulated features, the real number of down-regulated phosphopeptides occurring as a function of calyculin A treatment is likely to be much greater.
TABLE 1.
Number of phosphopeptides identified in different types of MS analyses.
| MS analyses | Phosphopeptides | Up-regulated phosphopeptides in the treated sample (Standard t-test/C1T3) |
|---|---|---|
| Total | 583 | 145/91 |
| Control & Treated Data-dependent analysis | 218 | 38/22 |
|
| ||
| Control targeted analysis total | 233 | 41/13 |
|
| ||
| Treated targeted analysis total | 407 | 118/71 |
Validation of peptide identification cut-off criteria
Manual confirmation of phosphopeptides that passed the 5% FDR filter from several datasets was also performed. This manual confirmation verified that the estimated FDR of the phosphopeptides was similar to that observed above. Figure 4 shows the MS/MS spectrum of a phosphopeptide from a known PP2A target, EF2. 22, 23 Manual confirmation of this spectrum verified the EF2 phosphopeptide sequence, and an increase in EF2 phosphorylation at this site as a result of calyculin A treatment was confirmed by quantitative western blot analysis (Fig 5). Despite this, the EF2 phosphopeptide change failed the 5% FDR criterion used for filtering the phosphopeptides in our initial data analyses to build the AMT tag database for peak matching. In addition, several other phosphopeptides, including some from known PPP enzyme targets such as stathmin24 and cytochrome P450 C17A1,25 which failed to pass the FDR filter were also shown to be correct based on manual confirmation. Overall, this indicates that the 5% FDR filter applied in this study is conservative and underestimates the number of changed phosphoproteins.
Figure 4.
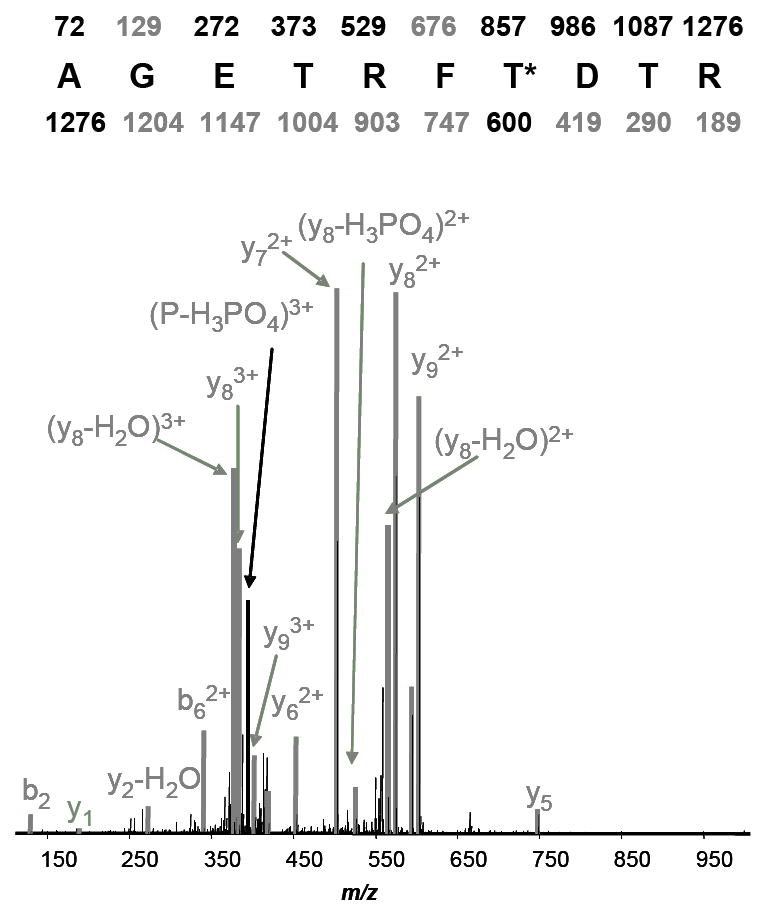
Manual confirmation of the MS/MS spectrum for a phosphopeptide derived from EF2.
Figure 5.
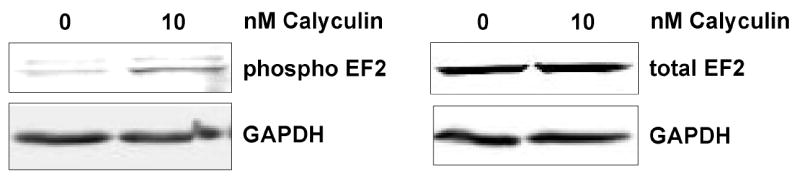
Elevation of EF2 phospho-T56 levels in response to calyculin A treatment. Samples from vehicle control (0 nM) and 10 nM calyculin A treatment were subjected to SDS-PAGE and western blot analysis for phospho-T56 EF2 or EF2. GAPDH was monitored as a loading control. Blots were quantified using fluorescent secondary antibodies and Li-Cor fluorescence based imaging and the ratio of treated to control showed a 3-fold increase in phospho-T levels following treatment with 10 nM calyculin A.
For phosphopeptides that passed the 5% FDR filter we occasionally observed that, even though the peptide sequence was correct, our manual analysis indicated that the phosphorylation site assignment was incorrect. In some cases the phosphorylation site can be determined from the b- and y-ions associated with a specific phosphorylated residue and/or the corresponding neutral loss ions; however, in some cases, especially for peptides with multiple phosphorylation sites, assignment can be problematic. Thus, the effective 5% FDR refers to the peptide sequence and number of phosphorylation sites, but does not reflect the FDR for phosphorylation site identification. In cases where more than one phosphorylation site assignment is possible, additional confirmation is required. For this purpose, we calculated the ambiguity score AScore21 to estimate the confidence in the phosphorylation site assignment based on the presence of related site-determining ions in MS/MS spectra. Supplementary Table 3 lists the AScores for each ambiguous phosphorylation site. An AScore greater than 19 was considered a confident assignment of a particular phosphorylation site.21
Identification of known and novel targets for regulation by PPP enzymes
A number of proteins with phosphorylation elevated by calyculin A treatment are well-established direct or indirect targets of PPP enzymes. These are listed in Table 2, together with a small sample of the novel targets for regulation identified in this study. For cyclin-dependent protein kinase (CDK1), PP1 regulatory subunit 12, and heterogenous ribonucleoprotein (HnRNP)-K, the sites of phosphorylation seen to increase following calyculin A treatment have all been previously documented as either direct or indirect targets for PPP enzymes, or sensitive to PPP enzyme blockers (see Table 2 for refs).
TABLE 2.
Examples of Phosphopeptides Exhibiting Calyculin A-induced Changes
| SWISS/PROT | Protein name | Phosphopeptide | T/C# | phospho-residue | phospho-residue identified previously* | Protein phosphorylation increased by PPP enzyme blockers |
|---|---|---|---|---|---|---|
| O43823 | A Kinase Anchor Protein (AKAP) 8 | VDS* EGDFS* ENDDAAGDFR | 0.2 | S323 | -- | -- |
| S328 | 10 | |||||
| Q8IZP0 | Abl-Interactor 1 | LGSQHS* PGR | C1T3 | S224 | -- | -- |
| Q01518 | Adenylyl cyclase-associated protein 1 | SGPKPFSAPKPQTS* PSPK | 3.7 | S307 | -- | -- |
| SGPKPFSAPKPQT* S* PSPK | 1.5 | T306 | -- | |||
| S307 | ||||||
| SGPKPFSAPKPQTS* PS* PK | 0.8 | S307 | ||||
| S309 | - | |||||
| Q13112 | Chromatin Assembly Factor 1 Subunit B | TQDPSS* PGTT* PPQAR | 2.0 | S429 | 10 | Yes |
| T433 | -- | |||||
| Q14247 | Cortactin | AKTQT* PPVSPAPQPTEERLPSS* PVYEDAASFK | 17.1 | T401 | 10 | -- |
| S418 | 10, 37 | |||||
| TQT* PPVSPAPQPTEERLPSSPVY* EDAASFK | 10.1 | T401 | 10 | |||
| Y421 | 39, 40, 51, 56 | |||||
| LPSS* PVYEDAASFK | C1T3 | S418 | 10 | |||
| P06493 | Cyclin-dependent Protein Kinase 1 | IEKIGEGT* Y* GVVYKGR | 0.4 | T14 | 57-59 | Yes |
| Y15 | 57-59 | |||||
| IEKIGEGT* Y* GVVYK | 0.5 | T14 | ||||
| Y15 | ||||||
| P18887 | DNA Repair Protein XRCC1 | TKPTQAAGPS* SPQKPPTPEET* K | 15.5 | S446 | -- | -- |
| T457 | -- | |||||
| Q9NRY4 | Glucocorticoid Receptor DNA Binding Factor 1 | TSFSVGS* DDELGPIR | C1T3 | S1179 | 10 | -- |
| P09651 | Heterogenous Nuclear Ribonucleoprotein A1 | NQGGYGGSSSS* SSYGSGR | 5.7 | S362 | 60 | Yes |
| SES* PKEPEQLR | 5.8 | S5 | 45 (mouse ortholog) | |||
| P61978 | Heterogenous Nuclear Ribonucleoprotein K | RDYDDMS* PR | 42.0 | S284 | 7, 10, 61, 62 | Yes |
| DYDDMS* PR | 171 | S284 | ||||
| Q8WUF5 | Inhibitor of Apoptosis Stimulating Protein of P53 | AGS* PRGS* PLAEGPQAFFPER | C3T1 | S183 | -- | -- |
| S187 | ||||||
| O60716 | p120 Catenin | HYEDGYPGGSDNYGS* LSR | C1T3 | S230 | -- | -- |
| Q9BTU6 | Phosphatidylinositol 4 Kinase Type II | SSS* ESYTQSFQSR | 10.7 | S462 | 10 | -- |
| VAAAAGSGPS* PPGS* PGHDRER | 1.9 | S47 | -- | |||
| S51 | -- | |||||
| P20020 | Plasma membrane Ca2+ transporting ATPase 1 | IEDS* EPHIPLIDDT* DAEDDAPTKR | 8.3 | S1193 | -- | -- |
| T1203 | -- | |||||
| Q01814 | Plasma membrane Ca2+ transporting ATPase 2 | SATSSSPGS* PIHSLETS* L | C1T3 | S1234 | -- | -- |
| S1242 | -- | |||||
| SATSSSPGSPIHSLETS* L | C1T3 | S1242 | ||||
| Q15149 | Plectin | SSS* VGSSSSYPISPAVSR | 2.9 | S4386 | 7, 10 | Yes |
| O14737 | Programmed Cell Death Protein 5 | VMDS* DEDDDY | 7.8 | S118 | 10 | -- |
| RKVMDS* DEDDDY | 7.7 | S118 | ||||
| O14974 | Protein phosphatase 1 Regulatory subunit 12A | RST* QGVTLTDLQEAEK | C1T3 | T696 | 63-75 | Yes |
| Q14738 | Protein Phosphatase 2A, 56 Kda regulatory subunit, delta isoform | PS* NS* T* PPPTQLSKIKY* S* GGPQIVK | C1T3 | S60 | 76 | -- |
| S62 | -- | |||||
| T63 | -- | |||||
| Y74 | -- | |||||
| S75 | 76 | |||||
| P29803 | Pyruvate Dehydrogenase E1 component alpha subunit | Y* HGHSMSDPGVS* YR | 1.7 | Y289 | 40 | |
| S300 | 77-79 | |||||
| P46060 | Ran GTPase Activating Protein 1 | ILDPNTGEPAPVLS* SPPPADVSTFLAFPS* PEK | C1T3 | S427/S428† | 10, 55 (for S428) | -- |
| S442 | 10, 55 | |||||
| Q14155 | Rho Guanine Nucleotide Exchange Factor 7 | MS* GFIYQGKLPTTGMTITK | C1T3 | S340 | -- | -- |
| Q8IWW6 | Rho-GTPase Activating Protein 12 | ATT* PPNQGRPDS* PVYANLQELK | 0.5 | T231 | 45(mouse ortholog), 52 | -- |
| S240 | 45(mouse ortholog), 52 | |||||
| P17275 | Transcription Factor JunB | SRDAT* PPVS* PINMEDQER | 3.2 | T255 | -- | -- |
| S259 | 10 | |||||
| P08670 | Vimentin | S* VSSSSYR | 80.7 | S4 | -- | Yes |
| DGQVINETS* QHHDDLE | 11.9 | S458 | -- | |||
| SLYASS* PGGVYATR | 30.7 | S55 | 26,55, 80-84 |
site may be one of two sequential residues
C1T3-peptide observed ≤ 1 time in control sample, but ≥ 3 times in treated sample
C3T1- peptide observed ≥ 3 times in control sample, but ≤ 1 time in treated sample
indicates no report, number indicates reference for residues previously identified
Vimentin is a cytoplasmic intermediate filament protein that undergoes a complex pattern of phosphorylation by multiple kinases. Calyculin A treatment caused an apparent increase in vimentin-derived peptides containing p-S4, p-S55 and p-S458. Elevated 32P incorporation into the residues corresponding to S55 and S458 of vimentin from hamster-derived BHK cells following calyculin A treatment has been reported previously.26 Other studies have also shown that PPP enzyme blockers elevate vimentin phosphorylation and that PP2A is associated with vimentin.27-35
Plectin, which links various cytoskeletal proteins with each other and with other targets, also undergoes elevated phosphorylation by treatment with PPP enzyme inhibitors,36 however, specific sites have not been identified. In the present study, a peptide containing p-S4386 was elevated, indicating that this site is a target for PPP enzyme regulation.
The actin binding protein, cortactin, is phosphorylated by activation of the Extracellular signal-regulating kinase (ERK) MAP kinase pathway, most likely by ERK itself.37 Although the effect of PPP blockers on cortactin has not been reported, ERK is inactivated by PP2A and is activated by okadaic acid treatment.38 Two cortactin residues identified in this study, T401 and S418, are followed by proline, the minimal requirement for an ERK phosphorylation site. Serine 418 is phosphorylated in vivo following growth factor stimulation and by ERK in vitro.37 Although ERK phosphorylation of T401 was not observed in vitro, an increase in phosphothreonine at an unidentified site was shown to occur in a growth factor-stimulated, MAP-kinase/ERK kinase (MEK)-dependent manner.37 We also observed elevated phosphorylation of cortactin residue Y421, which can be attacked by the tyrosine kinases Src39 and Abl;40 thus elevated phosphorylation of this site may reflect indirect regulation of one of these tyrosine kinases by PP2A38 or another member of this family.
HnRNP-A1, which plays a role in mRNA splicing, is phosphorylated by numerous kinases in vitro and contains multiple phosphorylation sites.41 The phosphorylation of HnRNP-A1was shown to be elevated by cell treatment with another PPP enzyme blocker okadaic acid,42-44 although the sites of phosphorylation influenced by okadaic acid were not mapped in these studies. In the present study, S5 and S362 exhibited elevated phosphorylation following calyculin A treatment. Phosphorylation of hnRNP-A1 S5 was reported in calyculin A-treated murine cells45, however in this study no comparison was made between untreated and treated cells. Our results demonstrate that phosphorylation at both S5 and S362 is influenced by PPP enzyme activity.
The B subunit of chromatin assembly factor 1 (CAF-1B) undergoes a cycle of phosphorylation and dephosphorylation during S phase chromatin assembly46 that involves multiple phosphorylation events.47-49 This is thought to involve cyclin-dependent protein kinases and PP1 and to be required for nucleosome assembly concomitant with DNA synthesis.50 Phosphorylation site(s) in CAF-1B relevant to nucleosome assembly have not been identified. Our study revealed two residues in CAF-1B, S429 and T433, whose phosphorylation was increased by calyculin A. Each of these residues is followed by a proline, consistent with the possibility that they are cyclin kinase-dependent phosphorylation sites.
It should be noted that while specific PPP family members have been implicated in directly or indirectly controlling the phosphorylation status of these protein targets for each of the cases described above, other calyculin A-sensitive PPP family members may also be involved in controlling the sites identified in these proteins.
Novel targets for PPP regulation identified in this study also represent proteins with a wide variety of functions and residing in numerous subcellular compartments. All targets (285 unique phosphopeptides) regulated by PPP enzymes are listed in Supplementary Table 2A and 2B (t-test, C1T3 and C3T1). Cases in which tyrosine phosphorylation was altered clearly represent indirect action of PPP enzymes. However, for those cases in which phosphorylation was up-regulated the effect of PPP enzymes may be either direct or indirect.
DISCUSSION
This study presents a novel label-free and global targeted approach for comparative phosphoproteomics applied to the analysis of proteins subject to regulation by PPP-type S/T protein phosphatases. The confirmation of phosphorylation sites in proteins already known to change as a function of PPP enzyme inhibitor treatment, such as T14 and Y15 in CDK1 and S284 in hnRNP-K, validates our proteomics strategy for identifying PPP enzyme targets. We also identified calyculin A-sensitive sites within known protein targets for PPP enzymes for which specific sites have not previously been defined (e.g. plectin). Other calyculin A-sensitive phosphorylation sites found in this study represent sites identified in various global phosphoproteomic screens,7, 10, 45, 51, 52 such as T457 in DNA Repair Protein XRCC1, for which no functional information about regulation by phosphorylation is currently available. Our study confirms the identification of these sites and further shows that their phosphorylation status is influenced by PPP family phosphatases. This new information, together with knowledge of the kinase attacking these sites and the protein function, will assist in formulating hypotheses about the signaling pathways and regulatory events involving these phosphoproteins. Other sites identified in this study include phosphorylation sites not previously reported in proteins that have established or unknown functions. Identification of novel phosphorylation sites and their regulation by a PPP family member provides an important new clue concerning the regulation of these proteins. Altogether, 232 known and novel protein targets for PPP enzymes were identified. We estimate that over 95% of these represent new phosphorylation sites and protein targets.
To date, only one other study has compared phosphoproteins from samples treated with or without a PPP enzyme inhibitor. In this study of phosphorylation changes in neurons induced by okadaic acid, a strategy involving isolation of phosphoproteins, followed by ICAT labeling was employed. These investigators also found that the majority of peptides did not change in phosphorylation status and identified 75 unique peptide pairs yielding 13 proteins with changed phosphorylation status.53 Although several other global phosphoproteomic studies used a PPP inhibitor to elevate phosphorylation, no comparison between treated and untreated samples was performed to determine whether phosphorylation sites were subject to PPP enzyme regulation.45, 54, 55 Despite the large number of novel targets for PPP enzyme regulation revealed in this study, many well-established targets were not identified. This may be due to the fact that phosphorylation of some targets requires activation of specific signaling pathways, the nature of the ion fragmentation processes, or to limitations in sensitivity, dynamic range or from ion suppression by more abundant species. In addition, sample preparation steps including the Trizol extraction procedure, IMAC and the use of trypsin are factors that can influence protein or peptide recovery.
The success of the present strategy is due to the inclusion of several technical, analytical and informatics advances. Building on our earlier study demonstrating the effects of LC column dimensions and flow rate on quantitation,16 in the present study we employed a long (40 cm) monolithic column with a small I.D. (20 μm),15 operated at ~20 nL/min, providing higher separation power compared with shorter columns (15 cm or less) and greater sensitivity compared to the higher LC flow rates employed in other studies.10, 11, 13 This provided more reliable, sensitive and comprehensive quantitation results. The targeted analyses themselves were only possible through the extension of the AMT tag strategy20 employed for this analysis where LC-MS datasets were first aligned to each other to detect clusters which showed interesting abundance profiles. The identification of the clusters themselves was performed using the traditional AMT tag approach by collating the LC-MS/MS results together.
In this study we encountered several challenges, both in performing the experiment and in analyzing the results. The construction of inclusion lists was challenging because some instrument control software does not provide a mechanism for use of LC elution times with the inclusion list. Even when a mechanism is provided for specification of elution time, LC-MS separation times are generally not perfectly reproducible, and none provide for automated correction of the elution times of inclusion lists to account for chromatographic variability in the current experiment. Such capabilities will be essential if targeted experiments are to be successful on a regular basis in high throughput settings.
Targeted studies, such as ours, based on feature profiling, can increase analyses efficiency, sensitivity and throughput by focusing tandem MS capabilities on peptides of interest. It can greatly facilitate studies in which the amount of sample is limited and the objective is to identify changed features under different biological conditions without the need to comprehensively characterize all the features, most of which are often not related to the biological stimulus of interest. This is particularly helpful for changes occurring in low abundance proteins. This approach also minimizes the number of fractionation or chemical modification steps, which can be time consuming and cause sample losses, as well as the extensive analyses required with other approaches to obtain a similar level of identification for features exhibiting differential abundance. In this study, we performed targeted analyses for both significantly changed features and features displaying only modest up-regulation in treated samples. According to our results, targeted analysis could be further improved by focusing on only significantly changed features such as those with z>1. Further success can be achieved by combining the profiling strategy with “smart” mass spectrometry which would combine on-line alignment algorithms and intelligent on-line acquisition of relevant, informative spectra using selective application of MSn or ETD capabilities when sufficient sensitivity exists.
Supplementary Material
Acknowledgments
This research was supported by NIH grants NS031221 (SR) and RR18522 (RDS), and a grant from the Indiana Elks Charities Inc./Walther Cancer Institute (SR). We thank Dr. Angus Nairn (Yale University, School of Medicine) for the kind gift of EF2 antibodies. The Proteomics NCRR Biomedical Technology Resource Center is located in the Environmental Molecular Sciences Laboratory at Pacific Northwest National Laboratory and the authors thank the Environmental Molecular Sciences Laboratory (EMSL) for use of the instrumentation applied in this research. EMSL is a U.S. Department of Energy (DOE) national scientific user facility located at PNNL in Richland, Washington. PNNL is a multi-program national laboratory operated by Battelle Memorial Institute for the DOE under Contract DE-AC05-76RL01830. Documentation of previously identified phosphorylation sites was performed in part use of Phosphosite® (www.phosphosite.org).
References
- 1.Arroyo JD, Hahn WC. Involvement of PP2A in viral and cellular transformation. Oncogene. 2005;24(52):7746–55. doi: 10.1038/sj.onc.1209038. [DOI] [PubMed] [Google Scholar]
- 2.Brady MJ, Saltiel AR. The role of protein phosphatase-1 in insulin action. Recent Prog Horm Res. 2001;56:157–73. doi: 10.1210/rp.56.1.157. [DOI] [PubMed] [Google Scholar]
- 3.Oliver CJ, Shenolikar S. Physiologic importance of protein phosphatase inhibitors. Front Biosci. 1998;3:D961–72. doi: 10.2741/a336. [DOI] [PubMed] [Google Scholar]
- 4.Janssens V, Goris J. Protein phosphatase 2A: a highly regulated family of serine/threonine phosphatases implicated in cell growth and signalling. Biochem J. 2001;353(Pt 3):417–39. doi: 10.1042/0264-6021:3530417. [DOI] [PMC free article] [PubMed] [Google Scholar]
- 5.Ceulemans H, Bollen M. Functional diversity of protein phosphatase-1, a cellular economizer and reset button. Physiol Rev. 2004;84(1):1–39. doi: 10.1152/physrev.00013.2003. [DOI] [PubMed] [Google Scholar]
- 6.Ficarro SB, McCleland ML, Stukenberg PT, Burke DJ, Ross MM, Shabanowitz J, Hunt DF, White FM. Phosphoproteome analysis by mass spectrometry and its application to Saccharomyces cerevisiae. Nat Biotechnol. 2002;20(3):301–5. doi: 10.1038/nbt0302-301. [DOI] [PubMed] [Google Scholar]
- 7.Kim JE, Tannenbaum SR, White FM. Global phosphoproteome of HT-29 human colon adenocarcinoma cells. Journal of Proteome Research. 2005;4(4):1339–1346. doi: 10.1021/pr050048h. [DOI] [PubMed] [Google Scholar]
- 8.Moser K, White FM. Phosphoproteomic analysis of rat liver by high capacity IMAC and LC-MS/MS. Journal of Proteome Research. 2006;5(1):98–104. doi: 10.1021/pr0503073. [DOI] [PubMed] [Google Scholar]
- 9.Ballif BA, Villen J, Beausoleil SA, Schwartz D, Gygi SP. Phosphoproteomic analysis of the developing mouse brain. Molecular & Cellular Proteomics. 2004;3(11):1093–1101. doi: 10.1074/mcp.M400085-MCP200. [DOI] [PubMed] [Google Scholar]
- 10.Beausoleil SA, Jedrychowski M, Schwartz D, Elias JE, Villen J, Li JX, Cohn MA, Cantley LC, Gygi SP. Large-scale characterization of HeLa cell nuclear phosphoproteins; Proceedings of the National Academy of Sciences of the United States of America; 2004. pp. 12130–12135. [DOI] [PMC free article] [PubMed] [Google Scholar]
- 11.Stover DR, Caldwell J, Marto J, Root R, Mestan J, Stumm M, Ornatsky O, Orsi C, Radosevic N, Liao L, Fabbro D, Moran MF. Differential phosphoprofiles of EGF and EGFR kinase inhibitor-treated human tumor cells and mouse xenografts. Clin Proteomics. 2004;1:069–080. [Google Scholar]
- 12.Gruhler A, Olsen JV, Mohammed S, Mortensen P, Faergeman NJ, Mann M, Jensen ON. Quantitative phosphoproteomics applied to the yeast pheromone signaling pathway. Molecular & Cellular Proteomics. 2005;4(3):310–327. doi: 10.1074/mcp.M400219-MCP200. [DOI] [PubMed] [Google Scholar]
- 13.Zhang Y, Wolf-Yadlin A, Ross PL, Pappin DJ, Rush J, Lauffenburger DA, White FM. Time-resolved mass spectrometry of tyrosine phosphorylation sites in the epidermal growth factor receptor signaling network reveals dynamic modules. Mol Cell Proteomics. 2005;4(9):1240–50. doi: 10.1074/mcp.M500089-MCP200. [DOI] [PubMed] [Google Scholar]
- 14.Olsen JV, Blagoev B, Gnad F, Macek B, Kumar C, Mortensen P, Mann M. Global, in vivo, and site-specific phosphorylation dynamics in signaling networks. Cell. 2006;127(3):635–648. doi: 10.1016/j.cell.2006.09.026. [DOI] [PubMed] [Google Scholar]
- 15.Luo QZ, Shen YF, Hixson KK, Zhao R, Yang F, Moore RJ, Mottaz HM, Smith RD. Preparation of 20-mu m-i.d. silica-based monolithic columns and their performance for proteomics analyses. Analytical Chemistry. 2005;77(15):5028–5035. doi: 10.1021/ac050454k. [DOI] [PubMed] [Google Scholar]
- 16.Luo QZ, Tang KQ, Yang F, Elias A, Shen YF, Moore RJ, Zhao R, Hixson KK, Rossie SS, Smith RD. More sensitive and quantitative proteomic measurements using very low flow rate porous silica monolithic LC columns with electrospray ionization-mass spectrometry. Journal of Proteome Research. 2006;5(5):1091–1097. doi: 10.1021/pr050424y. [DOI] [PubMed] [Google Scholar]
- 17.Jaitly N, Monroe ME, Petyuk VA, Clauss TRW, Adkins JN, Smith RD. Robust algorithm for alignment of liquid chromatography-mass spectrometry analyses in an accurate mass and time tag data analysis pipeline. Analytical Chemistry. 2006;78(21):7397–7409. doi: 10.1021/ac052197p. [DOI] [PubMed] [Google Scholar]
- 18.Yang F, Stenoien DL, Strittmatter EF, Wang JH, Ding LH, Lipton MS, Monroe ME, Nicora CD, Gristenko MA, Tang KQ, Fang RH, Adkins JN, Camp DG, Chen DJ, Smith RD. Phosphoproteome profiling of human skin fibroblast cells in response to low-and high-dose irradiation. Journal of Proteome Research. 2006;5(5):1252–1260. doi: 10.1021/pr060028v. [DOI] [PubMed] [Google Scholar]
- 19.Harkewicz R, Belov ME, Anderson DA, Pasa-Tolic L, Masselon CD, Prior DC, Udseth HR, Smith RD. ESI-FTICR Mass Spectrometry Employing Data-Dependent External Ion Selection and Accumulation. J Amer Soc Mass Spectrom. 2002;13:144–154. doi: 10.1016/S1044-0305(01)00343-9. [DOI] [PubMed] [Google Scholar]
- 20.Zimmer JSD, Monroe ME, Qian WJ, Smith RD. Advances in proteomics data analysis and display using an accurate mass and time tag approach. Mass Spectrometry Reviews. 2006;25(3):450–482. doi: 10.1002/mas.20071. [DOI] [PMC free article] [PubMed] [Google Scholar]
- 21.Beausoleil SA, Villén J, Gerber SA, Rush J, Gygi SP. A probability-based approach for high-throughput protein phosphorylation analysis and site localization. Nat Biotechnol. 2006:1–8. doi: 10.1038/nbt1240. [DOI] [PubMed] [Google Scholar]
- 22.Redpath NT, Proud CG. The tumour promoter okadaic acid inhibits reticulocyte-lysate protein synthesis by increasing the net phosphorylation of elongation factor 2. Biochem J. 1989;262(1):69–75. doi: 10.1042/bj2620069. [DOI] [PMC free article] [PubMed] [Google Scholar]
- 23.Redpath NT, Proud CG. Activity of protein phosphatases against initiation factor-2 and elongation factor-2. Biochem J. 1990;272(1):175–80. doi: 10.1042/bj2720175. [DOI] [PMC free article] [PubMed] [Google Scholar]
- 24.Tournebize R, Andersen SS, Verde F, Doree M, Karsenti E, Hyman AA. Distinct roles of PP1 and PP2A-like phosphatases in control of microtubule dynamics during mitosis. Embo J. 1997;16(18):5537–49. doi: 10.1093/emboj/16.18.5537. [DOI] [PMC free article] [PubMed] [Google Scholar]
- 25.Pandey AV, Mellon SH, Miller WL. Protein phosphatase 2A and phosphoprotein SET regulate androgen production by P450c17. J Biol Chem. 2003;278(5):2837–44. doi: 10.1074/jbc.M209527200. [DOI] [PubMed] [Google Scholar]
- 26.Eriksson JE, He T, Trejo-Skalli AV, Harmala-Brasken AS, Hellman J, Chou YH, Goldman RD. Specific in vivo phosphorylation sites determine the assembly dynamics of vimentin intermediate filaments. J Cell Sci. 2004;117(Pt 6):919–32. doi: 10.1242/jcs.00906. [DOI] [PubMed] [Google Scholar]
- 27.Almazan G, Afar DE, Bell JC. Phosphorylation and disruption of intermediate filament proteins in oligodendrocyte precursor cultures treated with calyculin A. J Neurosci Res. 1993;36(2):163–72. doi: 10.1002/jnr.490360206. [DOI] [PubMed] [Google Scholar]
- 28.Turowski P, Myles T, Hemmings BA, Fernandez A, Lamb NJ. Vimentin dephosphorylation by protein phosphatase 2A is modulated by the targeting subunit B55. Mol Biol Cell. 1999;10(6):1997–2015. doi: 10.1091/mbc.10.6.1997. [DOI] [PMC free article] [PubMed] [Google Scholar]
- 29.Cheng TJ, Lin YL, Chiang AS, Lai YK. Association of protein phosphatase 2A with its substrate vimentin intermediate filaments in 9L rat brain tumor cells. J Cell Biochem. 2000;79(1):126–38. [PubMed] [Google Scholar]
- 30.Eriksson JE, Brautigan DL, Vallee R, Olmsted J, Fujiki H, Goldman RD. Cytoskeletal integrity in interphase cells requires protein phosphatase activity. Proc Natl Acad Sci U S A. 1992;89(22):11093–7. doi: 10.1073/pnas.89.22.11093. [DOI] [PMC free article] [PubMed] [Google Scholar]
- 31.Lai YK, Lee WC, Chen KD. Vimentin serves as a phosphate sink during the apparent activation of protein kinases by okadaic acid in mammalian cells. J Cell Biochem. 1993;53(2):161–8. doi: 10.1002/jcb.240530209. [DOI] [PubMed] [Google Scholar]
- 32.Lee WC, Yu JS, Yang SD, Lai YK. Reversible hyperphosphorylation and reorganization of vimentin intermediate filaments by okadaic acid in 9L rat brain tumor cells. J Cell Biochem. 1992;49(4):378–93. doi: 10.1002/jcb.240490408. [DOI] [PubMed] [Google Scholar]
- 33.Ho DT, Roberge M. The antitumor drug fostriecin induces vimentin hyperphosphorylation and intermediate filament reorganization. Carcinogenesis. 1996;17(5):967–72. doi: 10.1093/carcin/17.5.967. [DOI] [PubMed] [Google Scholar]
- 34.Hirano K, Hartshorne DJ. Phosphorylation of vimentin in the C-terminal domain after exposure to calyculin-A. Eur J Cell Biol. 1993;62(1):59–65. [PubMed] [Google Scholar]
- 35.Yatsunami J, Fujiki H, Suganuma M, Yoshizawa S, Eriksson JE, Olson MO, Goldman RD. Vimentin is hyperphosphorylated in primary human fibroblasts treated with okadaic acid. Biochem Biophys Res Commun. 1991;177(3):1165–70. doi: 10.1016/0006-291x(91)90662-q. [DOI] [PubMed] [Google Scholar]
- 36.Larsen AK, Moller MT, Blankson H, Samari HR, Holden L, Seglen PO. Naringin-sensitive phosphorylation of plectin, a cytoskeletal cross-linking protein, in isolated rat hepatocytes. J Biol Chem. 2002;277(38):34826–35. doi: 10.1074/jbc.M205028200. [DOI] [PubMed] [Google Scholar]
- 37.Campbell DH, Sutherland RL, Daly RJ. Signaling pathways and structural domains required for phosphorylation of EMS1/cortactin. Cancer Res. 1999;59(20):5376–85. [PubMed] [Google Scholar]
- 38.Millward TA, Zolnierowicz S, Hemmings BA. Regulation of protein kinase cascades by protein phosphatase 2A. Trends Biochem Sci. 1999;24(5):186–91. doi: 10.1016/s0968-0004(99)01375-4. [DOI] [PubMed] [Google Scholar]
- 39.Huang C, Liu J, Haudenschild CC, Zhan X. The role of tyrosine phosphorylation of cortactin in the locomotion of endothelial cells. J Biol Chem. 1998;273(40):25770–6. doi: 10.1074/jbc.273.40.25770. [DOI] [PubMed] [Google Scholar]
- 40.Goss VL, Lee KA, Moritz A, Nardone J, Spek EJ, MacNeill J, Rush J, Comb MJ, Polakiewicz RD. A common phosphotyrosine signature for the Bcr-Abl kinase. Blood. 2006;107(12):4888–97. doi: 10.1182/blood-2005-08-3399. [DOI] [PMC free article] [PubMed] [Google Scholar]
- 41.Soret J, Tazi J. Phosphorylation-dependent control of the pre-mRNA splicing machinery. Prog Mol Subcell Biol. 2003;31:89–126. doi: 10.1007/978-3-662-09728-1_4. [DOI] [PubMed] [Google Scholar]
- 42.Cobianchi F, Calvio C, Stoppini M, Buvoli M, Riva S. Phosphorylation of human hnRNP protein A1 abrogates in vitro strand annealing activity. Nucleic Acids Res. 1993;21(4):949–55. doi: 10.1093/nar/21.4.949. [DOI] [PMC free article] [PubMed] [Google Scholar]
- 43.Hamilton BJ, Burns CM, Nichols RC, Rigby WF. Modulation of AUUUA response element binding by heterogeneous nuclear ribonucleoprotein A1 in human T lymphocytes. The roles of cytoplasmic location, transcription, and phosphorylation. J Biol Chem. 1997;272(45):28732–41. doi: 10.1074/jbc.272.45.28732. [DOI] [PubMed] [Google Scholar]
- 44.Hermann R, Hensel F, Muller EC, Keppler M, Souto-Carneiro M, Brandlein S, Muller-Hermelink HK, Vollmers HP. Deactivation of regulatory proteins hnRNP A1 and A2 during SC-1 induced apoptosis. Hum Antibodies. 2001;10(2):83–90. [PubMed] [Google Scholar]
- 45.Shu H, Chen S, Bi Q, Mumby M, Brekken DL. Identification of phosphoproteins and their phosphorylation sites in the WEHI-231 B lymphoma cell line. Mol Cell Proteomics. 2004;3(3):279–86. doi: 10.1074/mcp.D300003-MCP200. [DOI] [PubMed] [Google Scholar]
- 46.Krude T, Keller C. Chromatin assembly during S phase: contributions from histone deposition, DNA replication and the cell division cycle. Cell Mol Life Sci. 2001;58(56):665–72. doi: 10.1007/PL00000890. [DOI] [PMC free article] [PubMed] [Google Scholar]
- 47.Martini E, Roche DM, Marheineke K, Verreault A, Almouzni G. Recruitment of phosphorylated chromatin assembly factor 1 to chromatin after UV irradiation of human cells. J Cell Biol. 1998;143(3):563–75. doi: 10.1083/jcb.143.3.563. [DOI] [PMC free article] [PubMed] [Google Scholar]
- 48.Smith S, Stillman B. Immunological characterization of chromatin assembly factor I, a human cell factor required for chromatin assembly during DNA replication in vitro. J Biol Chem. 1991;266(18):12041–7. [PubMed] [Google Scholar]
- 49.Marheineke K, Krude T. Nucleosome assembly activity and intracellular localization of human CAF-1 changes during the cell division cycle. J Biol Chem. 1998;273(24):15279–86. doi: 10.1074/jbc.273.24.15279. [DOI] [PubMed] [Google Scholar]
- 50.Keller C, Krude T. Requirement of Cyclin/Cdk2 and protein phosphatase 1 activity for chromatin assembly factor 1-dependent chromatin assembly during DNA synthesis. J Biol Chem. 2000;275(45):35512–21. doi: 10.1074/jbc.M003073200. [DOI] [PubMed] [Google Scholar]
- 51.Salomon AR, Ficarro SB, Brill LM, Brinker A, Phung QT, Ericson C, Sauer K, Brock A, Horn DM, Schultz PG, Peters EC. Profiling of tyrosine phosphorylation pathways in human cells using mass spectrometry. Proc Natl Acad Sci U S A. 2003;100(2):443–8. doi: 10.1073/pnas.2436191100. [DOI] [PMC free article] [PubMed] [Google Scholar]
- 52.Brill LM, Salomon AR, Ficarro SB, Mukherji M, Stettler-Gill M, Peters EC. Robust phosphoproteomic profiling of tyrosine phosphorylation sites from human T cells using immobilized metal affinity chromatography and tandem mass spectrometry. Anal Chem. 2004;76(10):2763–72. doi: 10.1021/ac035352d. [DOI] [PubMed] [Google Scholar]
- 53.Hill JJ, Callaghan DA, Ding W, Kelly JF, Chakravarthy BR. Identification of okadaic acid-induced phosphorylation events by a mass spectrometry approach. Biochem Biophys Res Commun. 2006;342(3):791–9. doi: 10.1016/j.bbrc.2006.02.029. [DOI] [PubMed] [Google Scholar]
- 54.Hoffert JD, Pisitkun T, Wang GH, Shen RF, Knepper MA. Quantitative phosphoproteomics of vasopressin-sensitive renal cells: Regulation of aquaporin-2 phosphorylation at two sites. Proceedings of the National Academy of Sciences of the United States of America; 2006. pp. 7159–7164. [DOI] [PMC free article] [PubMed] [Google Scholar]
- 55.Nousiainen M, Sillje HH, Sauer G, Nigg EA, Korner R. Phosphoproteome analysis of the human mitotic spindle. Proc Natl Acad Sci U S A. 2006;103(14):5391–6. doi: 10.1073/pnas.0507066103. [DOI] [PMC free article] [PubMed] [Google Scholar]
- 56.Dudek SM, Jacobson JR, Chiang ET, Birukov KG, Wang P, Zhan X, Garcia JG. Pulmonary endothelial cell barrier enhancement by sphingosine 1-phosphate: roles for cortactin and myosin light chain kinase. J Biol Chem. 2004;279(23):24692–700. doi: 10.1074/jbc.M313969200. [DOI] [PubMed] [Google Scholar]
- 57.Norbury C, Blow J, Nurse P. Regulatory phosphorylation of the p34cdc2 protein kinase in vertebrates. Embo J. 1991;10(11):3321–9. doi: 10.1002/j.1460-2075.1991.tb04896.x. [DOI] [PMC free article] [PubMed] [Google Scholar]
- 58.Solomon MJ, Lee T, Kirschner MW. Role of phosphorylation in p34cdc2 activation: identification of an activating kinase. Mol Biol Cell. 1992;3(1):13–27. doi: 10.1091/mbc.3.1.13. [DOI] [PMC free article] [PubMed] [Google Scholar]
- 59.Krek W, Nigg EA. Differential phosphorylation of vertebrate p34cdc2 kinase at the G1/S and G2/M transitions of the cell cycle: identification of major phosphorylation sites. Embo J. 1991;10(2):305–16. doi: 10.1002/j.1460-2075.1991.tb07951.x. [DOI] [PMC free article] [PubMed] [Google Scholar]
- 60.Buxade M, Parra JL, Rousseau S, Shpiro N, Marquez R, Morrice N, Bain J, Espel E, Proud CG. The Mnks are novel components in the control of TNF alpha biosynthesis and phosphorylate and regulate hnRNP A1. Immunity. 2005;23(2):177–89. doi: 10.1016/j.immuni.2005.06.009. [DOI] [PubMed] [Google Scholar]
- 61.Kwiek NC, Thacker DF, Datto MB, Megosh HB, Haystead TA. PITK, a PP1 targeting subunit that modulates the phosphorylation of the transcriptional regulator hnRNP K. Cell Signal. 2006;18(10):1769–78. doi: 10.1016/j.cellsig.2006.01.019. [DOI] [PubMed] [Google Scholar]
- 62.Habelhah H, Shah K, Huang L, Ostareck-Lederer A, Burlingame AL, Shokat KM, Hentze MW, Ronai Z. ERK phosphorylation drives cytoplasmic accumulation of hnRNP-K and inhibition of mRNA translation. Nat Cell Biol. 2001;3(3):325–30. doi: 10.1038/35060131. [DOI] [PubMed] [Google Scholar]
- 63.Niiro N, Ikebe M. Zipper-interacting protein kinase induces Ca(2+)-free smooth muscle contraction via myosin light chain phosphorylation. J Biol Chem. 2001;276(31):29567–74. doi: 10.1074/jbc.M102753200. [DOI] [PubMed] [Google Scholar]
- 64.Broustas CG, Grammatikakis N, Eto M, Dent P, Brautigan DL, Kasid U. Phosphorylation of the myosin-binding subunit of myosin phosphatase by Raf-1 and inhibition of phosphatase activity. J Biol Chem. 2002;277(4):3053–9. doi: 10.1074/jbc.M106343200. [DOI] [PubMed] [Google Scholar]
- 65.Begum N, Sandu OA, Ito M, Lohmann SM, Smolenski A. Active Rho kinase (ROK-alpha) associates with insulin receptor substrate-1 and inhibits insulin signaling in vascular smooth muscle cells. J Biol Chem. 2002;277(8):6214–22. doi: 10.1074/jbc.M110508200. [DOI] [PubMed] [Google Scholar]
- 66.Sakurada S, Takuwa N, Sugimoto N, Wang Y, Seto M, Sasaki Y, Takuwa Y. Ca2+-dependent activation of Rho and Rho kinase in membrane depolarization-induced and receptor stimulation-induced vascular smooth muscle contraction. Circ Res. 2003;93(6):548–56. doi: 10.1161/01.RES.0000090998.08629.60. [DOI] [PubMed] [Google Scholar]
- 67.Birukova AA, Smurova K, Birukov KG, Kaibuchi K, Garcia JG, Verin AD. Role of Rho GTPases in thrombin-induced lung vascular endothelial cells barrier dysfunction. Microvasc Res. 2004;67(1):64–77. doi: 10.1016/j.mvr.2003.09.007. [DOI] [PubMed] [Google Scholar]
- 68.Birukova AA, Liu F, Garcia JG, Verin AD. Protein kinase A attenuates endothelial cell barrier dysfunction induced by microtubule disassembly. Am J Physiol Lung Cell Mol Physiol. 2004;287(1):L86–93. doi: 10.1152/ajplung.00441.2003. [DOI] [PubMed] [Google Scholar]
- 69.Birukova AA, Smurova K, Birukov KG, Usatyuk P, Liu F, Kaibuchi K, Ricks-Cord A, Natarajan V, Alieva I, Garcia JG, Verin AD. Microtubule disassembly induces cytoskeletal remodeling and lung vascular barrier dysfunction: role of Rho-dependent mechanisms. J Cell Physiol. 2004;201(1):55–70. doi: 10.1002/jcp.20055. [DOI] [PubMed] [Google Scholar]
- 70.Yazaki A, Tamaru S, Sasaki Y, Komatsu N, Wada H, Shiku H, Nishikawa M. Inhibition by Rho-kinase and protein kinase C of myosin phosphatase is involved in thrombin-induced shape change of megakaryocytic leukemia cell line UT-7/TPO. Cell Signal. 2005;17(3):321–30. doi: 10.1016/j.cellsig.2004.07.009. [DOI] [PubMed] [Google Scholar]
- 71.Xiao D, Longo LD, Zhang L. Alpha1-adrenoceptor-mediated phosphorylation of MYPT-1 and CPI-17 in the uterine artery: role of ERK/PKC. Am J Physiol Heart Circ Physiol. 2005;288(6):H2828–35. doi: 10.1152/ajpheart.01189.2004. [DOI] [PubMed] [Google Scholar]
- 72.Watanabe Y, Faraci FM, Heistad DD. Activation of Rho-associated kinase during augmented contraction of the basilar artery to serotonin after subarachnoid hemorrhage. Am J Physiol Heart Circ Physiol. 2005;288(6):H2653–8. doi: 10.1152/ajpheart.00923.2004. [DOI] [PubMed] [Google Scholar]
- 73.Vijayan KV, Liu Y, Sun W, Ito M, Bray PF. The Pro33 isoform of integrin beta3 enhances outside-in signaling in human platelets by regulating the activation of serine/threonine phosphatases. J Biol Chem. 2005;280(23):21756–62. doi: 10.1074/jbc.M500872200. [DOI] [PubMed] [Google Scholar]
- 74.Lontay B, Kiss A, Gergely P, Hartshorne DJ, Erdodi F. Okadaic acid induces phosphorylation and translocation of myosin phosphatase target subunit 1 influencing myosin phosphorylation, stress fiber assembly and cell migration in HepG2 cells. Cell Signal. 2005;17(10):1265–75. doi: 10.1016/j.cellsig.2005.01.008. [DOI] [PubMed] [Google Scholar]
- 75.Porter M, Evans MC, Miner AS, Berg KM, Ward KR, Ratz PH. Convergence of Ca2+-desensitizing mechanisms activated by forskolin and phenylephrine pretreatment, but not 8-bromo-cGMP. Am J Physiol Cell Physiol. 2006;290(6):C1552–9. doi: 10.1152/ajpcell.00534.2005. [DOI] [PubMed] [Google Scholar]
- 76.Usui H, Inoue R, Tanabe O, Nishito Y, Shimizu M, Hayashi H, Kagamiyama H, Takeda M. Activation of protein phosphatase 2A by cAMP-dependent protein kinase-catalyzed phosphorylation of the 74-kDa B” (delta) regulatory subunit in vitro and identification of the phosphorylation sites. FEBS Lett. 1998;430(3):312–6. doi: 10.1016/s0014-5793(98)00684-x. [DOI] [PubMed] [Google Scholar]
- 77.Korotchkina LG, Patel MS. Mutagenesis studies of the phosphorylation sites of recombinant human pyruvate dehydrogenase. Site-specific regulation. J Biol Chem. 1995;270(24):14297–304. doi: 10.1074/jbc.270.24.14297. [DOI] [PubMed] [Google Scholar]
- 78.Korotchkina LG, Patel MS. Site specificity of four pyruvate dehydrogenase kinase isoenzymes toward the three phosphorylation sites of human pyruvate dehydrogenase. J Biol Chem. 2001;276(40):37223–9. doi: 10.1074/jbc.M103069200. [DOI] [PubMed] [Google Scholar]
- 79.Korotchkina LG, Sidhu S, Patel MS. Characterization of testis-specific isoenzyme of human pyruvate dehydrogenase. J Biol Chem. 2006;281(14):9688–96. doi: 10.1074/jbc.M511481200. [DOI] [PubMed] [Google Scholar]
- 80.Stefanovic S, Windsor M, Nagata KI, Inagaki M, Wileman T. Vimentin rearrangement during African swine fever virus infection involves retrograde transport along microtubules and phosphorylation of vimentin by calcium calmodulin kinase II. J Virol. 2005;79(18):11766–75. doi: 10.1128/JVI.79.18.11766-11775.2005. [DOI] [PMC free article] [PubMed] [Google Scholar]
- 81.Tang DD, Bai Y, Gunst SJ. Silencing of p21-activated kinase attenuates vimentin phosphorylation on Ser-56 and reorientation of the vimentin network during stimulation of smooth muscle cells by 5-hydroxytryptamine. Biochem J. 2005;388(Pt 3):773–83. doi: 10.1042/BJ20050065. [DOI] [PMC free article] [PubMed] [Google Scholar]
- 82.Ermakova S, Choi BY, Choi HS, Kang BS, Bode AM, Dong Z. The intermediate filament protein vimentin is a new target for epigallocatechin gallate. J Biol Chem. 2005;280(17):16882–90. doi: 10.1074/jbc.M414185200. [DOI] [PubMed] [Google Scholar]
- 83.Tsujimura K, Ogawara M, Takeuchi Y, Imajoh-Ohmi S, Ha MH, Inagaki M. Visualization and function of vimentin phosphorylation by cdc2 kinase during mitosis. J Biol Chem. 1994;269(49):31097–106. [PubMed] [Google Scholar]
- 84.Shiromizu T, Goto H, Tomono Y, Bartek J, Totsukawa G, Inoko A, Nakanishi M, Matsumura F, Inagaki M. Regulation of mitotic function of Chk1 through phosphorylation at novel sites by cyclin-dependent kinase 1 (Cdk1) Genes Cells. 2006;11(5):477–85. doi: 10.1111/j.1365-2443.2006.00955.x. [DOI] [PubMed] [Google Scholar]
Associated Data
This section collects any data citations, data availability statements, or supplementary materials included in this article.