

Abstract
Rodent ultrasonic vocalizations (USVs) are ethologically critical social signals. Rats emit 22 kHz USVs and 50 kHz USVs, respectively, in conjunction with negative and positive affective states. Little is known about what controls emotional reactivity to these social signals. Using male Sprague-Dawley rats, we examined unconditional and conditional freezing behavior in response to the following auditory stimuli: three 22 kHz USVs, a discontinuous tone whose frequency and on-off pattern matched one of the USVs, a continuous tone with the same or lower frequencies, a 4 kHz discontinuous tone with an on-off pattern matched to one of the USVs, and a 50 kHz USV. There were no differences among these stimuli in terms of the unconditional elicitation of freezing behavior. Thus, the stimuli were equally neutral before conditioning. During differential fear conditioning, one of these stimuli (the CS+) always co-terminated with a footshock unconditional stimulus (US) and another stimulus (the CS−) was explicitly unpaired with the US. There were no significant differences among these cues in CS+-elicited freezing behavior. Thus, the stimuli were equally salient or effective as cues in supporting fear conditioning. When the CS+ was a 22 kHz USV or a similar stimulus, rats discriminated based on the principal frequency and/or the temporal pattern of the stimulus. However, when these same stimuli served as the CS−, discrimination failed due to generalization from the CS+. Thus, the stimuli differed markedly in the specificity of conditioning. This strikingly asymmetrical stimulus generalization is a novel bias in discrimination.
Keywords: 22 kHz USVs, 50 kHz USVs, ultrasonic vocalizations, neuroethology, fear learning
1. Introduction
Rodent ultrasonic vocalizations (USVs) have been studied for many decades (Anderson, 1954; Blanchard et al., 1991; Brudzynski et al., 1993; Knutson et al., 2002; Sales & Pye, 1974; Sewell, 1967; White et al., 1990; Zippelius & Schleidt, 1956). USVs serve as ethologically-critical social signals (Brudzynski, 2005; Litvin et al., 2007) and offer a unique window into the emotional state of the animal (Borta et al., 2006; Brudzynski, 2007; Knutson et al., 2002; Panksepp, 2007). Rats emit USVs at frequencies of ~22 kHz and ~50 kHz in conjunction with negative and positive emotional states, respectively (see Brudzynski, 2007; Knutson et al., 2002). Surprisingly, little is understood about the roles of genetic and environmental variables in determining the reactivity of conspecifics to these social signals—a problem that we begin to address in the present study.
So-called “22 kHz USVs” range in frequency from 18 to 32 kHz (Brudzynski, 2005). Common eliciting circumstances include defeat by a conspecific, confrontation by a predator, or the presence of other threatening or aversive stimuli (Blanchard et al., 1991; Brudzynski & Holland, 2005; Cuomo et al., 1988), which can include conditional stimuli (CSs) that predict aversive outcomes (Choi & Brown, 2003; Lee et al., 2001). Twenty-two kHz USVs are said to function as “alarm” or “defeat” signals (Blanchard et al., 1991; Brudzynski, 2005; 2007; Knutson et al., 2002; Litvin et al., 2007), but they also occur in association with ejaculation (Barfield & Geyer, 1972; Brown, 1979; Choi & Brown, 2003). Their elicitation is thought to be controlled by the muscarinic action of the ascending cholinergic system (Brudzynski, 2007).
So-called “50 kHz USVs”, which actually range in frequency from 35 to 72 kHz, are emitted in conjunction with positive emotional states (Brudzynski, 2005; 2007; Knutson et al., 2002), including sexual behavior, rough and tumble play, “tickling”, and the anticipation of play, food, or rewarding drugs (Burgdorf & Panksepp, 2001; Knutson et al., 1998; 1999; McGinnis & Vakulenko, 2003; Panksepp & Burgdorf, 2000; Wintink & Brudzynski, 2001). Unlike 22 kHz USVs, 50 kHz USVs are usually associated with increased locomotor activity (Wöhr & Schwarting, 2007). Fifty kHz USVs have been conceived as “rat laughter” (Knutson et al., 2002; Panksepp, 2007; Panksepp et al., 2001). Their production is triggered (Brudzynski, 2007) or modulated (Ciucci et al., 2007) by ascending dopaminergic circuits. The ratio of 50 kHz USVs to 22 kHz USVs has been effectively used as an affective index (Hamdani & White, 2007; Hamdani et al., 2006).
The present study examined unconditional and conditional freezing behavior elicited by USVs and tones. Surprisingly, these stimuli were equally neutral with respect to the elicitation of unconditional freezing and equally effective as cues in supporting conditional freezing. Also unexpectedly, there were remarkable differences among these stimuli in terms of the specificity of conditioning.
2. Experiment 1
Although USVs are thought to be critical social signals in rats and other rodents, little is known about the role of experience in determining emotional or defensive responses to these vocalizations. Using naïve rats, Experiment 1 examined unconditional freezing responses to pre-recorded USVs and some simpler, synthetic stimuli. The results demonstrated that USVs are as “neutral” as tones in experimentally-naïve, male, Sprague-Dawley rats.
2.1. Materials and Methods
2.1.1. Subjects
Fifty-one male Sprague-Dawley rats were used (230–280 g; Charles River Laboratories, Kingston, NY). Subjects were individually housed, had ad libitum access to food and water, and maintained on a 12-hr dark/light cycle. Experiments were in strict compliance with Yale University’s Institutional Animal Care and Use Committee guidelines.
2.1.2. Apparatus
The sound-attenuating recording chamber (25.5 cm width × 29 cm length × 32 cm height) was not as tall as the testing chamber (25.4 cm width × 29.4 cm length × 53.34 cm height). The latter was placed inside a larger sound-attenuating chamber. Both the recording and testing chambers had a standard grid floor made of stainless steel rods. A miniature IR-CCD camera (Circuit Specialists, Mesa, AZ) was mounted on the top of each chamber. The floors and inner walls of the testing chamber were sprayed with white vinegar/water (1:3) solution prior to the experiment. The inner light was illuminated throughout the experiment.
2.1.3. Auditory Stimuli
2.1.3.1. Ultrasonic vocalization recording and playback
Twenty-two kHz USVs were recorded from three naïve rats by presenting 4 – 7 footshocks (1 –1.2 mA for 1 sec). Fifty kHz USVs were recorded from two naïve rats during rough-and-tumble play. The waveforms of the emitted calls were picked up by the high-frequency microphone (Model 7012, ACO Pacific, Belmont, CA) mounted on the chamber. The calls were amplified by a Tucker-Davis Technologies (TDT, Gainesville, FL) MA2 preamplifier and were subsequently digitized by an RP2.1 digital signal processor (TDT). These five animals were not included in further studies.
Digitization was done at 100 kHz for the 22 kHz USVs and at 200 kHz for the 50 kHz USVs. The 22 kHz USVs were band-pass filtered between 18 and 26 kHz. The 50 kHz USVs were band-pass filtered between 30 and 80 kHz. Further filtering was sometimes done with auditory editing software (Raven 1.1, Cornell Bioacoustics Lab; Adobe Audition 2.0, Adobe, San Jose, CA). The filtered USVs were presented to the animals via the RP2.1 and a high-frequency electrostatic loudspeaker (ES1, TDT) that was driven by an electrostatic loudspeaker driver (ED1, TDT) and the RPvdEX software. For the benefit of the experimenter, a heterodyne bat detector (Mini-3, Noldus Technology) transformed the USVs into audible frequencies.
2.1.3.2. Physical characteristics of the USVs and tones
The six stimuli used in this experiment consisted of four USVs and two continuous tones. The USVs consisted of a series (or “bout”) of discrete “calls”, each with its unique frequency modulations, amplitude modulations, and duration (see Figs. 1C–F). Three of the USVs were at ~22 kHz and one was at ~50 kHz. The first “22 kHz USV” consisted of a bout of 11 calls that lasted 7.91 s. The mean call duration was 0.55 s and the root frequency was 19 kHz (Fig. 1C). To distinguish it from the others, this vocalization was designated the “19 kHz USV”. The second 22 kHz USV had a root frequency of 22 kHz and a total duration of 8.13 s. It consisted of four longer calls with a mean duration of 1.92 s (Fig. 1D). This vocalization was designated the “22 kHz USV”. The third 22 kHz USV lasted 5.71 s, consisted of 10 shorter calls and had a root frequency of about 23 kHz (Fig. 1E). The mean call duration was 0.42 s. This vocalization was designated the “23 kHz USV”. The fourth USV was at ~50 kHz. It differed from 22 kHz USVs not only in root frequency (53 kHz) but also in terms of the mean call duration (0.06 s; see Fig. 1F). The 50 kHz USV lasted 6.74 s and consisted of 26 calls, whose frequencies ranged from 35 to 75 kHz (Fig. 1F). The continuous tones were at 4 kHz (Fig. 1A) and 22 kHz (Fig. 1B). For both stimuli, the total duration was 7.91 s, the rise/fall time was 10 ms, and the amplitude was 65 dBSPL (as measured by an Ultraprobe 9000, UE Systems).
Figure 1.

Spectrograms and amplitude plots of the six auditory stimuli used in this study. (A) A continuous 4 kHz tone (7.91 s). (B) A continuous 22 kHz tone (7.91 s). (C) A 19 kHz USV (7.91 s, 11 calls). (D) A 22 kHz USV (8.13 s, 4 calls). (E) A 23 kHz USV (5.71 s, 11 calls). (F) A 50 kHz USV (6.74 s, 26 calls). The four USVs were recorded from different rats.
The loudness of the three 22 kHz USVs and the 50 kHz USV (measured by an Ultraprobe 9000; UE Systems) ranged from 60 to 65 dbSPL. The perceived loudness may have differed between the 22 kHz USVs and the 50 kHz USV because the behavioral hearing threshold and the electrophysiological detection threshold are lower for 22 kHz auditory stimuli than for 50 kHz stimuli (Borg, 1982; Kelly & Masterton, 1977; Gourevitch, 1965; Gourevitch & Hack, 1966; Sally & Kelly, 1988). However, the loudness of all four USVs was well above the detection threshold, as demonstrated by subsequent conditioning (see Experiment 2).
2.1.4. Behavioral Procedures
Naïve rats were briefly handled for 3 – 5 days upon arrival. The subjects were then assigned to one of six groups based on the auditory stimulus that was presented. The number of animals in each of the six groups was as follows: 4 kHz tone (n = 8), 22 kHz tone (n = 8), 19 kHz USV (n = 8), 22 kHz USV (n = 8), 23 kHz USV (n = 8), and 50 kHz USV (n = 6). Each subject was placed in a chamber and received 5 stimulus presentations. The mean inter-trial interval (ITI) was 3 min. Rats in each of the six stimulus groups were presented with only one of the auditory stimuli. The dependent variable, freezing, was measured using video-analysis software (described below). Sixty seconds after the last auditory stimulus presentation, the animals were returned to their home cages. The entire experiment was recorded for off-line analysis.
2.1.5. Data Analysis
The video-recorded data were analyzed using custom video-analysis software (written in Delphi 7, Borland Software Corp., Cupertino, CA; see Boguszewski et al., 2007). Movements were detected by comparing successive video images. Freezing behavior was defined as immobilization that lasts more than 3 seconds, excluding minor movements associated with breathing or the elicitation of USVs. The correlation between the computer-based analysis and the results of human-scored data was nearly perfect (r = 0.97, p < 0.005).
The amount of freezing was measured before the stimulus presentation (for 1 min), during the stimulus presentation (5.71 s to 8.13 s, depending on the stimulus), and after the stimulus presentation (for 1 min). For each animal, the total duration of freezing was calculated for each stage of the experiment (before, during, and after the stimulus presentation) and then converted to a percentage score. Mean percentage scores were analyzed using a three-way analysis of variance (ANOVA), with two within-subjects factors (stage of the experiment and trials within stages) and one between-subjects factor (stimulus type).
2.2. Results
Figure 2 (N = 46) shows freezing levels in response to six different auditory stimuli. As indicated, separate measurements were made for each of the three stages of the experiment (before, during and after the stimulus presentation). The histograms show that the mean percentage of time spent freezing was low (0% to 6.12 %) for all six stimuli in all three stages of the experiment. The main effect for trials was significant (F(4,160) = 4.18, p < 0.01), reflecting the general decrease in activity across time. There was no significant effect of experimental stage (F(2,80) = 1.68, p > 0.05) and no significant effect of stimulus type (F(5,40) = 0.91, p > 0.05). In addition, none of the interactions were significant (p > 0.05). Clearly there were no differences among the stimuli in terms of the unconditional elicitation of freezing behavior (Fig. 2).
Figure 2.

Experimentally naïve rats fail to freeze in response to USVs and synthetic stimuli. The mean percentage of time spent freezing is plotted before (white box), during (gray box), and after (black box) the auditory stimulus presentations. The stimuli (see Fig. 1) include a 4 kHz tone (n = 8), a 22 kHz tone (n = 8), a 19 kHz USV (n = 8), a 22 kHz USV (n = 8), a 23 kHz USV (n = 8), and a 50 kHz USV (n = 6). Error bars represent ±1 standard error (SE).
2.3. Discussion
The six stimuli (three 22 kHz USVs, a 50 kHz USV, a 22 kHz continuous tone, and a 4 kHz continuous tone) were equally neutral in terms of unconditional elicitation of freezing (Fig. 2). A recent study of Sprague-Dawley rats similarly found no differences between USVs and tones in terms of unconditional freezing (Endres et al., 2007). On the other hand, earlier studies have reported that 22 kHz USVs can cause a decrease in locomotor activity or cause flight to an artificial burrow (Blanchard et al., 1990; Brudzynski & Chiu, 1995; Sales, 1991). Some potentially important differences among these studies include the testing environment, the stimulus intensity, the behavioral measure, available response options, prior experiences with USVs, and the strain of rat. The studies cited above that reported defensive reactions to USVs used Long-Evans or Wistar rats. Unpublished observations suggested that Long-Evens rats are much less likely than Sprague-Dawley rats to vocalize at ~22 kHz. Conflicting published data may be complicated by large effects of strain and context.
3. Experiment 2
Genetic variations have been shown to affect the production of USVs (Brunelli; 2005; Brunelli et al., 1997; Burgdorf et al., 2005; Hahn et al., 1987; Sales & Smith, 1978), but there have been few studies of the possible influence of genetic and environmental variables in determining reactivity to these social signals (see Allen et al., 2007; Brudzynski, 2007; Endres et al., 2007). Although the stimuli used in Experiment 1 were equally neutral, as measured by unconditional freezing, they might differ in terms of salience or efficacy as cues supporting fear conditioning. One might anticipate some degree of “biological preparedness” (Domjan et al., 2004; Mineka & Öhman, 2002; Öhman & Mineka, 2001; Seligman, 1970; 1971; Seligman & Hager, 1972) to associate 22 kHz USVs with aversive events or negative feelings.
Using a differential fear conditioning paradigm, Experiment 2 searched for evidence of an “associative bias” (see Davey et al., 2003; Garcia & Koelling, 1966; Garcia et al., 1989; Gemberling & Domjan, 1982), which refers to the fact that some stimulus-response associations are more readily acquired than others. The cues were a 22 kHz USV and three simpler auditory stimuli. The latter captured one or more specific physical features of the USV. The goal was to “deconstruct” the USVs into sub-features that control either the level or the stimulus specificity of conditional freezing. There were in fact no significant differences among the stimuli in terms of the levels of CS+-elicited freezing, but there were large differences in the stimulus specificity of conditional freezing.
3.1. Materials and Methods
3.1.1. Subjects
A total of 82 male Sprague-Dawley rats were used (230–280 g; Charles River Laboratories, Kingston, NY). Subjects were individually housed, and kept on a 12-hr dark/light cycle. Rats had access to food and water ad libitum. Experiments were conducted in accordance with Yale University’s Institutional Animal Care and Use Committee guidelines.
3.1.2. Apparatus and contexts
A total of six different contexts consisted of two conditioning chambers and four testing chambers. Each chamber was placed in a sound-attenuating enclosure that contained a miniature IR-CCD camera (Circuit Specialists, Mesa, AZ). Subjects were individually conditioned to one of the two conditioning chambers and then tested in two of the testing chambers. The two conditioning chambers were rectangular and had slightly different dimensions (25.4 cm × 29.4 cm × 53.34 cm versus 27.3 cm × 22.9 cm × 40.6 cm). Both had a standard grid floor made of stainless steel rods. The grid shock US was delivered by a shock generator (ENV-410, MED Associates) and grid scrambler (ENV-412, MED Associates). The floors and inner walls were sprayed with white vinegar/water (1:3) solution prior to conditioning. The inner light was illuminated during conditioning.
The testing chambers differed with respect to geometrical shape, odors, floorings, and lighting conditions. The chamber shape was hexagonal (30.5 cm diameter × 50.8 cm height), rectangular (25.5 cm width × 29 cm length × 32 cm height) or trapezoidal (floor: 24.1 cm width × 26.7 cm length; height: 29.2 cm). Before each experiment, the chambers were sprayed with one of three odors: Windex®, Febreeze™, or herbal scents. Two of the testing chambers had plastic floorings covered with pine bedding. The chambers were illuminated during testing. The other two testing chambers had plastic floorings without pine bedding. These chambers were kept in the dark during experiments.
3.1.3. Auditory stimuli
3.1.3.1. 22 kHz ultrasonic vocalization
The 22 kHz USV was the “19 kHz USV” (Fig. 1C) from Experiment 1. Procedures for the playback of the USV were identical to those in Experiment 1. The loudness of the USV, measured using an Ultraprobe 9000 (UE Systems), was 60 – 65 dbSPL (within a bout, some calls were louder than others).
3.1.3.2. Continuous and discontinuous tones
Three stimuli were created in an attempt to “deconstruct” the 19 kHz USV into the following sub-features: the root frequency; the frequency or amplitudes modulations within calls; and the on-off temporal pattern of the calls. The first stimulus consisted of a 19 kHz discontinuous tone (7.91 s, 10 ms rise/fall time, see Fig. 4A, 5A & 6A) whose on-off pattern matched the on-off pattern of the 19 kHz USV (Fig. 1C, 3A & 6A). The temporal matching was done by triggering the output of the RP2.1 with a software-controlled (Test Point) voltage relay switch. This stimulus thus preserved the root frequency and temporal discontinuity of the 19 kHz USV but was stripped of its amplitude and frequency modulations. The second stimulus was a 4 kHz discontinuous tone (Fig. 5A) with the same temporal structure as the 19 kHz USV. This stimulus preserved the temporal discontinuity of the USV but not the root frequency or modulations. The third stimulus was a continuous 19 kHz tone (7.8 s, 10 ms rise/fall time; Fig. 3A & 4A), which preserved only the root frequency. The amplitudes of all three stimuli were 65 dBSPL (measured using an Ultraprobe 9000; UE Systems).
3.1.4. Four experimental groups
A differential fear conditioning procedure was used in which one cue (the CS+) was always paired with an aversive footshock (US) and another cue (the CS−) was never paired with a footshock. Four different stimulus pairs were used. In the first group (N = 24), the stimulus pairs were a 19 kHz USV and a 19 kHz continuous tone (Fig. 3A). In the second group (N = 24), the stimulus pairs were a 19 kHz discontinuous tone and a 19 kHz continuous tone (Fig. 4A). In the third group (N = 16), the stimulus pairs were 19 kHz and 4 kHz discontinuous tones (Fig. 5A). In the fourth group (N = 18), the stimulus pairs were a 19 kHz USV and a 19 kHz discontinuous tone (Fig. 6A). Discontinuous tones are commonly termed “pips” (Blair et al., 2005), a term used here. Half of subjects in each group received one member of the stimulus pair as the CS+ and the other half received the other member as the CS+. These four stimulus pairs are initial case studies in a large parameter space.
3.1.5. Behavioral procedures
Naïve rats were handled for 2 min for 3 – 5 days, followed by one day of differential conditioning and two consecutive testing days. Each animal was randomly assigned to one of the four conditioning groups described above. Differential conditioning consisted of 10 CS+ and 10 CS− trials that were randomly interleaved (ITI = 180 ± 60 s). The CS+ always co-terminated with a US footshock (0.4 s, 0.6 mA). The CS− never co-occurred with footshock. After conditioning, animals were returned to their home cages. Twenty-four and 48 hrs later, conditional responses to the CS+ or the CS− (counterbalanced among animals) were measured in novel testing chambers. In both CS+ and CS− tests, animals received 6 min of continuous CS presentation following a 2 min baseline period. Testing sessions were recorded for off-line video analysis of freezing, which served as the conditional response (CR).
3.1.6. Data analysis
The amount of freezing was measured (as in Experiment 1) during four, successive, 2-min time-bins. The first 2-min bin measured the baseline level of freezing. The next three 2-min bins included the duration of the CS presentation. The total freezing time in each time bin was converted to a percentage score (100% freezing duration/2 min). The results were analyzed using a multi-factor analysis of variance (ANOVA) and t-tests as needed.
The overall effect size (d; Cohen, 1988) for differential freezing was calculated as follows:
| (1) |
where the numerator is the difference in the mean percentage of freezing elicited by the CS+ and CS− and the denominator is a pooled estimate of the standard deviation of the percent freezing. This statistic combines data in which both members of each cue pair serve as the CS+. In psychological studies, one rule of thumb is that d = 0.2 is a “small” effect size, d = 0.5 is a “medium” effect size and d = 0.8 is a “large” effect size (Cohen, 1988). Note that an analogous statistic (d’) is used to index “discriminability” (Green & Swets, 1966; Irwin et al., 1993; Macmillan & Creelman, 1991; Triesman, 2002) and quantify recognition memory (Madden et al., 1999). To reduce the influence of extinction, effect sizes were calculated based on the first 2 minutes of the CS presentation.
In addition to the overall effect size for discrimination (d), the “partial” discrimination effect sizes (d1 and d2) were calculated for the separate cases in which each member of the stimulus pair served as the CS+:
| (2) |
| (3) |
The absolute value of the difference between these partial effect sizes is an index of “asymmetrical stimulus generalization” (AG):
| (4) |
Large values of AG imply a “discrimination bias” in which the amount of differential responding depends on which member of the cue pair serves as the CS+. When AG is large, the “specificity” of conditioning depends on which stimulus is the CS+. The value of AG is small when stimulus generalization is “symmetrical” between the two cues and when the overall discrimination (d in Eq. 1) is poor. Small AG implies that differential freezing to the CS+ and CS− (d in Eq. 1) does not depend on which member of the stimulus pair serves as the CS+.
As defined (Eq. 4), AG conveys information about the magnitude of asymmetrical generalization but not the direction of the effect, which is also important. When generalization from CS1 to CS2 is greater than from CS2 to CS1, the direction of the asymmetry is here defined as being toward CS2. With respect to CS2, the centripetal spread exceeds the centrifugal spread.
3.2. Results
3.2.1. 19 kHz USV vs. 19 kHz continuous tone cue
Figure 3 illustrates the overall results of differential conditioning using a 19 kHz USV and a 19 kHz continuous tone as a cue pair (N = 24). Asterisks denote significant differences between the CS+ and CS− (discussed below). In the pooled data (Fig. 3B), the mean freezing levels were considerably higher during the CS+ than during the CS− in all three 2-min testing periods. The differences in mean freezing levels were 22.01 ± 8.88 % during the first time bin, 30.81 ± 9.01 % during the second time bin, and 27.18 ± 9.17 % during the third time bin. Compared to the pooled results (Fig. 3B), the percentage differences were greater when the USV served as the CS+ (Fig. 3C): 41.14 ± 1.50 % during the first time bin, 44.99 ± 8.92 % during the second time bin, and 30.81 ± 10.74 % during the third time bin. The group differences were smaller, compared to the pooled results, when the continuous tone served as the CS+ (Fig. 3D): 2.89 ± 12.64 % during the first time bin, 16.64 ± 14.95 % during the second time bin, and 23.54 ± 15.29 % during the third time bin. During both the CS+ and CS− presentations, the mean freezing levels were considerably above the baseline levels (Fig. 3B – D).
ANOVA revealed a significant main effect of time interval (F(3,69) = 48.64, p < 0.001), indicating that subjects showed a significant level of cued fear conditioning (Fig. 3B). Specifically, post-hoc paired t-tests showed that subjects froze significantly more when the CS+ was presented during the first (69.17 ± 5.83 %; t(23) = −11.05, p < 0.001), second (65.08 ± 6.67 %; t(23) = −9.47, p < 0.001), and third (56.43 ± 8.04 %; t(23) = −6.74, p < 0.001) 2-min bins relative to the baseline level (3.76 ± 0.85%). There was no significant difference (t(22) = 0.87, p > 0.05) in amount of freezing during the USV CS+ (58.06 ± 9.58 %) and the tone CS+ (69.06 ± 8.18 %). In this respect, these two cues were comparably salient or effective in supporting fear conditioning. During the CS− presentation, freezing was also elevated above the baseline level (4.12 ± 1.33 %) during the first (47.16 ± 7.66 %; t(23) = −5.62, p < 0.001), second (34.27 ± 7.75 %; t(23) = −3.98, p < 0.01), and third (29.26 ± 7.05 %; t(23) = −3.53, p < 0.01) 2-min time bins.
A significant main effect of differential reinforcement of cues was also detected (F(1,23) = 11.02, p < 0.01), indicating that rats were able to discriminate between the two cues. Post-hoc t-tests revealed that there were significant differences in levels of freezing to the CS+ and CS− throughout the 6-min cue presentation (denoted by asterisks in Fig. 3B): first time bin (t(23) = 2.48, p < 0.05); second time bin (t(23) = 3.42, p < 0.01); third time bin (t(23) = 2.97, p < 0.01). There was also a significant interaction between differential reinforcement and time interval (F(3,69) = 5.77, p < 0.01), presumably reflecting different extinction rates to the CS+ and CS−.
As indicated by the asterisks in Fig. 3C, subjects experiencing the 19 kHz USV CS+ showed significantly higher freezing to the USV CS+ than to the continuous tone CS− during the first (t(11) = 4.04, p < 0.01), second (t(11) = 5.05, p < 0.01), and third (t(11) = 2.89, p < 0.05) 2-min bins. By contrast, there were no significant differences in mean levels of freezing during the continuous tone CS+ and the USV CS− (first bin, t(11) = 0.23, p > 0.05; second bin, t(11) = 0.26, p > 0.05; third bin, t(11) = 0.15, p > 0.05). The overall significant effect of reinforcement (CS+ vs CS−; asterisks in Fig. 3B) reflects freezing in rats conditioned to the 19 kHz USV CS+ (compare Fig. 3C and 3D). This pattern of results is what we have termed “asymmetrical stimulus generalization” (AG in Eq. 4; also see Fig. 7). In the present example, fear generalized more from the tone CS+ to the USV CS− than from the USV CS+ to the tone CS−. Equivalently, conditioning to the USV CS+ was more “specific” than conditioning to the tone CS+. All four stimulus pairs are later compared (Fig. 7) in terms of overall and partial effect sizes for differential freezing (Eq. 1 – 3).
Figure 3.

Differential fear conditioning to a 19 kHz USV and a 19 kHz continuous tone. (A) Spectrograms of the 19 kHz USV (top) and the 19 kHz continuous tone (bottom). (B) Overall mean percentage of time spent freezing to the CS+ and the CS− (N = 24) as a function of time. (C) Mean percent freezing among the subset of subjects (n = 12) that received the 19 kHz USV (part A, top) as the CS+ and 19 kHz continuous tone (part A, bottom) as the CS−. (D) Mean percent freezing among subjects (n = 12) that received the 19 kHz continuous tone as the CS+ and 19 kHz USV as the CS−. The baseline level of freezing (before the CS onset) is plotted on the left of the vertical dashed line. Asterisks (*) denote significant differences between CS+ and CS−. Error bars represent ± 1 SE.
3.2.2. 19 kHz pips vs. 19 kHz continuous tone cue
Figure 4 illustrates the overall results of differential conditioning using 19 kHz tone pips and a 19 kHz continuous tone (N = 24) as a stimulus pair. Asterisks denote significant group differences (analyzed below). In the pooled data (Fig. 4B), the mean percent freezing was higher during the CS+ than during the CS− presentation. The group differences in mean freezing were 18.15 ± 5.66 % during the first time bin, 13.41 ± 5.84 % during the second time bin and 6.91 ± 6.97 % during the third time bin. Compared to the pooled results (Fig. 4B), the percent differences were greater when the pips served as the CS+ (Fig. 4C). The differences between the means were 30.12 ± 8.12 % during the first time bin, 22.85 ± 10.56 % during the second time bin, and 11.43 ± 9.31 % during the third time bin. The group differences were smaller when the continuous tone served as the CS+ (Fig. 4D): 6.20 ± 6.51 % during the first time bin, 3.98 ± 3.89 % during the second time bin, and 2.39 ± 10.61 % during the third time bin.
ANOVA revealed a significant main effect of time interval (F(3,69) = 55.21, p < 0.001; Fig. 4B). Compared to baseline levels of freezing (9.68 ± 3.93 %), animals showed significantly more freezing during the first (77.64 ± 6.16 %; t(23) = −10.47, p < 0.001), second (71.33 ± 7.94 %; t(23) = −7.67, p < 0.001), and third (61.62 ± 8.59 %; t(23) = −5.98, p < 0.001) 2-min time bins during the CS+ presentation. Freezing was also elevated during the CS− presentation relative to the baseline period (5.66 ± 3.81 %): first time bin (59.48 ± 7.29 %; t(23) = −5.023, p < 0.001); second time bin (53.53 ± 10.56 %; t(23) = −4.53, p < 0.001); third time bin (55.61 ± 9.09; t(23) = −4.92, p < 0.001). The effect of differential reinforcement was also significant (F(1,23) = 8.53, p < 0.01), showing that rats can discriminate on the basis of temporal discontinuity. There was no significant interaction between reinforcement and time interval (F(3,69) = 1.28, p > 0.05). There was no significant difference in the mean freezing levels during the pips CS+ and the tone CS+ presentations (t(22) = 0.44, p > 0.05), indicating that these stimulus pairs are equivalently salient or effective in supporting delay fear conditioning.
The overall pattern in Fig. 4 (B–D) is similar to that in Fig. 3 (B–D). Although the effect sizes are smaller (Fig. 7), the pattern again shows asymmetrical stimulus generalization. When the 19 kHz discontinuous tone pips was the CS+ (n = 12), rats showed significant discrimination between the two cues during the first 2-min bin of CS presentation (t(11) = 3.72, p < 0.01), where the mean freezing level was 82.69 ± 6.84 % to the CS+ and 52.58 ± 10.99 % to the CS− (Fig. 4C). The group differences were not significant during the second and third time bins (p > 0.05). When the 19 kHz continuous tone was the CS+, rats evidenced no significant discrimination between the two cues during any 2-min time bins (p > 0.05; Fig. 4D). Generalization of fear was greater from the tone to the pips than from the pips to the tone. We classify the direction of the asymmetrical generalization as being toward the pips (see discussion of Eq. 4).
Figure 4.

Differential fear conditioning to 19 kHz discontinuous and continuous tones. (A) Spectrograms of the 19 kHz discontinuous tone pips (top) and the 19 kHz continuous tone (bottom). (B) Overall mean percent freezing to the CS+ and the CS− (N = 24). (C) Mean percent freezing among subjects (n = 12) that received the 19 kHz pips (part A, top) as the CS+ and 19 kHz continuous tone (part A, bottom) as the CS−. (D) Mean percent freezing among subjects (n = 12) that received the 19 kHz continuous tone as the CS+ and 19 kHz pips as the CS−. The baseline level of freezing (before the CS onset) is plotted on the left of the vertical dashed line. Asterisks (*) denote significant differences between CS+ and CS−. Error bars represent ± 1 SE.
3.2.3. 19 kHz pips vs. 4 kHz pips cue
Figure 5 shows the results of differential conditioning to 19 kHz pips and 4 kHz pips cues (N = 16). As before, asterisks denote significant group differences (analyzed below). In the pooled data (Fig. 5B), the mean freezing levels were higher during the CS+ than during the CS− presentation in all three 2-min testing periods. The group differences in freezing levels were 42.59 ± 9.10 % during the first time bin, 28.14 ± 11.30 % during the second time bin, and 12.64 ± 9.92 % during the third time bin. Compared to the pooled results (Fig. 5B), the percentage differences were larger when the 19 kHz pips served as the CS+ (Fig. 5C): 62.00 ± 12.17 % during the first time bin, 56.59 ± 17.42 % during the second time bin, and 20.74 ± 41.97 % during the third time bin. The percent differences were correspondingly smaller when the 4 kHz pips served as the CS+ (Fig. 5D): 23.18 ± 9.94 % during the first time bin, 0.3 ± 3.58 % during the second time bin, and 4.53 ± 38.26 % during the third time bin. Plots in Fig. 5 B – D point to a “discrimination bias” or “asymmetrical stimulus discrimination” (see Eq. 4).
ANOVA found a significant main effect of time interval (F(3,45) = 26.27, p < 0.01). Subjects froze significantly more when the CS+ was presented during the first (76.51 ± 7.26 %; t(16) = −9.999, p < 0.001), second (60.31 ± 9.76 %; t(16) = −5.733, p < 0.001), and third (39.23 ± 8.90 %; t(16) = −3.936, p < 0.005) 2-min bins compared to the baseline level (5.85 ± 2.18 %). Animals also showed significantly more freezing to the CS− during the first (30.97 ± 7.60; t(16) = −3.689, p < 0.005), second (28.59 ± 7.51 %; t(16) = −3.588, p < 0.005), and third (26.75 ± 5.99 %; t(16) = −4.629, p < 0.001) bins of CS presentation compared to the baseline level (4.05 ± 2.18 %). There was also a significant main effect of differential reinforcement of cues (F(1,15) = 10.08, p < 0.01), indicating that the rats were able to utilize principal frequency to discriminate between two different cues. The interaction between time interval and reinforcement was also significant (F(3,45) = 6.97, p < 0.05), reflecting greater decline in freezing across time bins to the CS+. There was no significant difference in the mean freezing level during the 19 kHz pips CS+ (62.05 ± 11.80 %) and the 4 kHz pips CS+ (52.21 ± 10.71 %; t(14) = 0.62, p > 0.05), indicating that both stimuli support robust fear conditioning.
Subjects (n = 8) that received the 19 kHz pips cue as the CS+ displayed significantly higher freezing levels during the first (75.80 ± 12.40 %; t(7) = 5.094, p < 0.05) and second (69.46 ± 14.13 %; t(7) = 3.249, p < 0.05) time bins relative to the first (13.80 ± 3.43 %) and second (12.88 ± 4.24 %) bins of the 4 kHz pips presentation (Fig. 5C). In contrast, subjects (n = 8) that were conditioned to the 4 kHz pips (Fig. 5D) failed to discriminate between the two cues during any time bin. Rats showed robust freezing to both the CS+ (74.27 ± 9.56 %) and the CS− (51.09 ± 12.60 %) even during the first 2-min bin. The difference in the amount of freezing was not significant (t(7) = 2.333, p > 0.05). In short, both cues were effective in supporting conditional freezing, but rats only responded differentially to the CS+ and CS− when the 19 kHz pips served as the CS+. There was no evidence that rats discriminated between the CS+ and CS− when the 4 kHz pips served as the CS+. The results thus far suggest that discrimination is based on root frequency and discontinuity.
Figure 5.

Differential fear conditioning to a 19 kHz pips and a 4 kHz pips. (A) Spectrograms of the 19 kHz discontinuous tone pips (top) and the 4 kHz discontinuous tone pips (bottom). (B) Overall mean percent freezing to the CS+ and the CS− (N = 16). (C) Mean percent freezing among subjects (n = 8) that received 19 kHz pips (part A, top) as the CS+ and 4 kHz pips (part A, bottom) as the CS-. (D) Mean percent freezing among subjects (n = 8) that received 4 kHz pips as the CS+ and 19 kHz pips as the CS−. The baseline level of freezing (before the CS onset) is plotted on the left of the vertical dashed line. Asterisks (*) denote significant differences between CS+ and CS−. Error bars represent ± 1 SE.
3.2.4. 19 kHz USV vs. 19 kHz pips cue
Of the 18 subjects used in this experimental condition, one was excluded from the analysis due to low-quality video images. Figure 6 shows the overall results of discrimination between a 19 kHz USV and a 19 kHz pips cue (N = 17). What is strikingly different in these plots (Figs. 6B –D), compared to previous ones (Figs. 3 – 5, parts B – D), is that all of the curves superimpose. The pooled data (Fig. 6B) reveal very similar freezing levels to the CS+ and CS−. ANOVA disclosed a significant main effect of time interval (F(3,48) = 45.69, p < 0.001). Post-hoc t-tests revealed that subjects froze significantly more during the first (78.38 ± 7.83 %; t(16) = −8.518, p < 0.001), second (57.88 ± 9.90 %; t(16) = −5.209, p < 0.001) and third (7.80 ± 5.64 %; t(16) = −3.930, p < 0.005) 2-min bins of CS+ presentation than during the 2-min baseline period (7.80 ± 5.64 %). Mean percent freezing during 6 min of CS+ presentation were not significantly different between the two separate cases (t(15) = 0.21, p > 0.05). Animals also showed significant freezing to the CS− during the first (74.74 ± 8.32 %; t(16) = −8.755, p < 0.001), second (59.61 ± 10.08 %; t(16) = −5.584, p < 0.001), and third (45.29 ± 10.03 %; t(16) = −4.171, p < 0.005) 2-min bins, compared to the baseline (3.80 ± 1.07 %).
There was no significant main effect of differential reinforcement (F(1,15) = 0.06, p > 0.05), meaning that rats did not respond differently to the CS+ and CS− (Fig. 6B), regardless of which stimulus served as the CS+ (Fig. 6C & D). The key difference between these two stimuli is that the pips lack the frequency and amplitude modulations that characterize the USV (see Figs. 1C & 6A). The results imply that these modulations are not important factors in controlling differential fear conditioning.
Figure 6.

Differential fear conditioning to a 19 kHz USV and a 19 kHz discontinuous tone. (A) Spectrograms of the 19 kHz USV (top) and the 19 kHz discontinuous tone pips (bottom). (B) Overall mean percent freezing to the CS+ and the CS− (N = 17). (C) Mean percent freezing among subjects (n = 8) that received 19 kHz USV (part A, top) as the CS+ and 19 kHz pips (part A, bottom) as the CS−. (D) Mean percent freezing among subjects (n = 9) that received 19 kHz pips as the CS+ and 19 kHz USV as the CS−. The baseline level of freezing (before the CS onset) is plotted on the left of the vertical dashed line. Asterisks (*) denote significant differences between CS+ and CS−. Error bars represent ± 1 SE.
3.2.5. Effect sizes for discrimination
The overall effect size (d from Eq. 1) was calculated for each of the stimulus pairs (Fig. 3B – 6B) and illustrated in Figure 7A>, where the upper, middle and lower horizontal lines denote “large”, “medium”, and “small” effect sizes, respectively. Rats displayed large differential responses to cues when they differed in frequency (19 kHz pips vs. 4 kHz pips, d = 1.37). When the frequency was controlled, temporal discontinuity remained an important factor (19 kHz USV vs. 19 kHz tone, d = 0.67; 19 kHz pips vs. 19 kHz tone, d = 0.55). When root frequency and discontinuity were controlled, the amplitude and frequency modulations of the USV failed to emerge as an important factor (19 kHz USV vs. 19 kHz pips, d = 0.11).
The partial effect sizes for discrimination (d1 and d2 from Eqs. 2 & 3) were calculated for each member of each stimulus pair and plotted in Figure 7B. For each stimulus pair, the partial effect size for the USV or the more “USV-like” stimulus is plotted on the right (black bars). Two facts stand out in this figure. First, some of the partial effect sizes are very large (> 0.8). Second, some of them are quite different for the two members of the stimulus pair (white bars vs. black bars). This difference in partial effect sizes indexes “asymmetrical stimulus generalization” (AG from Eq. 4; stippled bars in Fig. 7B).
The value of AG was largest when the stimulus pairs were a 4 kHz pips cue and a 19 kHz pips cue (AG = 1.68). Frequency per se clearly contributes to discrimination. Values of AG for the other stimulus pairs were as follows: 19 kHz USV and 19 kHz tone, AG = 1.61; 19 kHz pips and 19 kHz tone, AG = 0.78; and 19 kHz USV and 19 kHz pips, AG = 0.21. Among the four stimulus pairs, the rank order of AG (Fig. 7B) matched the rank order of the overall effect size for discrimination (Fig. 7A). Discrimination was always better (di was always larger) when the USV or the more USV-like stimulus served as the CS+ (Fig. 7B). Conditioning was always more specific when the USV or the more USV-like stimulus served as the CS+ (Fig. 7B).
Figure 7.
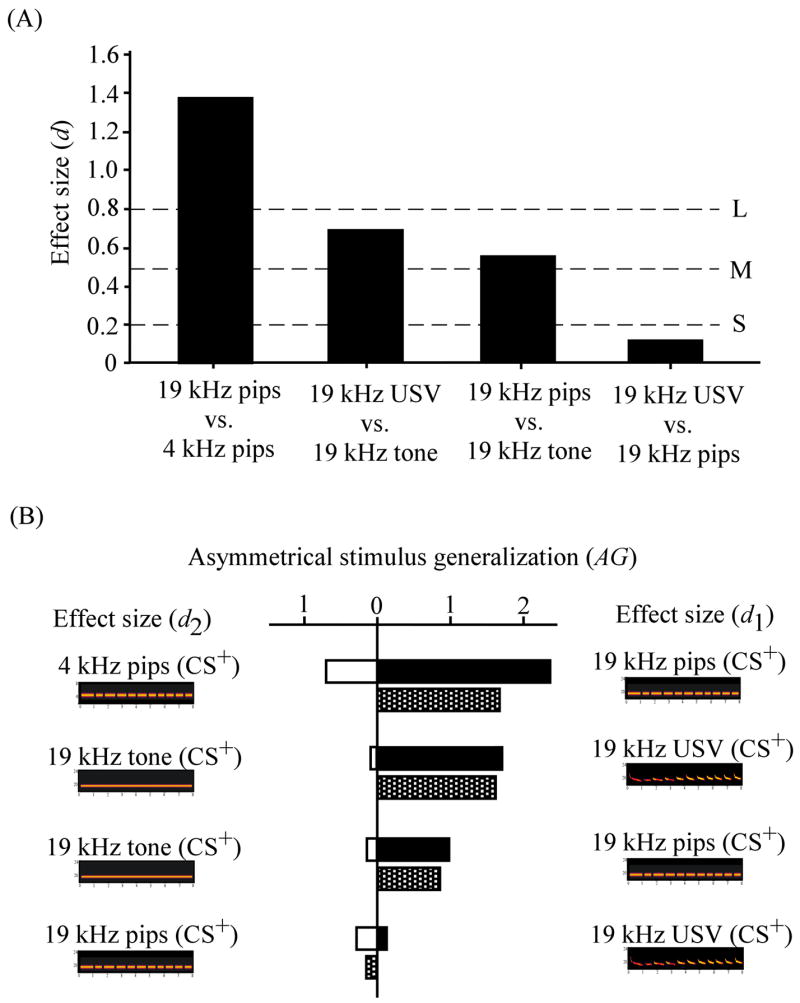
Effect sizes for discrimination and magnitudes of asymmetrical generalization. (A) Overall effect size (d from Eq. 1) for discrimination between the CS+ and CS− for each of four stimulus pairs. The three horizontal dotted lines denote small (S), medium (M), and large (L) effect sizes (see Cohen, 1988). (B) The black and white bars are partial effect sizes for discrimination (d1 and d2 from Eqs. 2 & 3). For each cue pair, the more USV-like stimulus (d1) is plotted on the right (black bars). The stippled bar is the amount of asymmetrical generalization (AG from Eq. 4).
3.3. Discussion
Experiment 2 examined conditional reactivity to a 22 kHz USV and three simpler stimuli using a differential delay fear conditioning paradigm. All four stimuli supported robust conditional freezing. In this respect, there were no significant differences among them (compare parts C and D of Fig. 3–6). They were equally salient or effective as cues in supporting conditional freezing. However, there were large differences between the stimulus pairs in regard to the specificity of freezing. These differences are immediately obvious from plots of partial effect sizes (Fig. 7B).
Differential responding to the CS+ and CS− only occurred when the 19 kHz USV (Fig. 3C) or a more “USV-like” stimulus (19 kHz discontinuous tone; Fig. 4C & 5C) served as the CS+. Differential responding was greatly attenuated or did not occur when the 22 kHz USV or USV-like stimulus served as the CS− (Figs. 3D, 4D, & 5D). The “asymmetrical stimulus generalization” (or “discrimination bias”; see Eq. 4 and Fig. 7B) described here appears to be a novel form of “biological preparedness” (Domjan et al., 2004; Mineka & Öhman, 2002; Öhman & Mineka, 2001; Seligman, 1970; 1971; Seligman & Hager, 1972) in the rat fear memory system.
The results show that discrimination (differential responding) can be supported by principal frequency and stimulus discontinuity (Figs. 3B–5B). Perhaps surprisingly, differential responding was not supported by the presence versus absence of characteristic USV modulations (Fig. 6). In contrast to the other cue pairs, there was no overall discrimination between a 19 kHz USV and a 19 kHz discontinuous tone pips (d = 0.11; Figs. 6 & 7). In this stimulus pair, the principal frequency and temporal discontinuity were closely matched, but the tone pips lacked the frequency and amplitude modulations that characterize all USVs. The results suggest that frequency and amplitude modulations play little or no role in differential auditory fear conditioning.
4. Experiment 3
Experiment 2 demonstrated that fear generalizes toward USV-like cues (centripetal spread) more than it does from these cues (centrifugal spread). Experiment 3 explored what happens when both cues are USVs. As in Experiment 2, the focus was on how well the rats discriminated between the cue pairs (d in Eq. 1) and whether there was a discrimination bias (AG in Eq. 4). The first cue pair consisted of two 22 kHz USVs. These were selected from our library of recorded USVs to differ maximally in terms of call durations (Fig. 1D & E). The question was whether differences in call durations can support differential conditioning. The second stimulus pair was a 22 kHz USV (Fig. 1C) and a 50 kHz USV (Fig. 1F). These stimulus pairs differed markedly in terms of root frequency, call durations, inter-call intervals, “duty cycles” (ratio of call duration to the call duration plus inter-call intervals), and AM/FM characteristics. The question was whether these two cues differ in salience or efficacy in supporting conditional freezing. Just as rats might be biologically “prepared” to associate 22 kHz USVs with an aversive somatosensory US, they might also be “counter prepared” to associate 50 kHz USVs with an aversive US. Recall that 50 kHz USVs are normally emitted in conjunction with positive hedonic states (Brudzynski, 2007; Knutson et al., 2002; Panksepp, 2007).
4.1. Materials and Methods
4.1.1. Subjects
A total of 40 male Sprague-Dawley rats were used (230–280 g; Charles River Laboratories, Kingston, NY). Subjects were individually housed, and kept on a 12-hr dark/light cycle. Rats had access to food and water ad libitum. Experiments were conducted in accordance with Yale University’s Institutional Animal Care and Use Committee guidelines.
4.1.2. 22 kHz and 50 kHz ultrasonic vocalizations
A total of three 22 kHz USVs and one 50 kHz USV were used. All of the stimuli and their playbacks were identical to those used in Experiment 1 (Fig. 1C–F). In the pair of two 22 kHz USVs, one USV was composed of four long calls (mean duration = 1.92 s) at around 22 kHz (total duration = 8.13 s; Fig. 8A> bottom). The other USV in the “22 kHz USVs” pair had 10 short calls (mean duration = 0.42 s) at the frequency of ~23 kHz (total duration = 5.71 s; Fig. 8A top). In the pair of 22 kHz and 50 kHz USVs, the 22 kHz USVs was identical to that used in Experiment 2. It had its principal frequency at 19 kHz, and had a bout of 11 calls (mean duration = 0.55 s; Fig. 9A top). The 50 kHz USV had its root frequency around 53 kHz with a total duration of 6.74 s. The USV was composed of 26 short calls with a mean duration of 0.06 s (Fig. 9A bottom). The amplitudes of all stimuli were 60–65 dbSPL.
4.1.3. Two experimental groups
The procedures were the same as in Experiment 2 except that all of the stimuli were USVs. In the first differential conditioning group (N = 20), the stimulus pair consisted of two different “22 kHz USVs”. The two 22 kHz USVs differed from each other in various physical features such as the number of calls, call durations, and frequency/amplitude modulations (Fig. 8A). In the second group (N = 20), the stimulus pair was a 19 kHz USV and a 50 kHz USV (Fig. 9A). These USVs differed greatly in principal frequency, frequency and amplitude modulations, call durations and inter-call intervals, and duty cycles.
4.1.4. Data analysis
Freezing behavior was measured and analyzed as in Experiment 2..
4.2. Results
4.2.1. 22 kHz USV vs. 23 kHz USV
Figure 8 summarizes the overall results of discrimination between two 22 kHz USVs (N = 20). In the pooled data (Fig. 8B), the mean freezing levels were considerably higher during the CS+ than during the CS−. As in previous figures, asterisks denote significant differences between the CS+ and CS−. Differences in mean freezing levels across successive 2-min time bins were 19.85 ± 2.06%, 18.37 ± 9.86 %, and 14.43 ± 11.72 %. Compared to the pooled results (Fig. 8B), the percent differences were greater when the 23 kHz USV served as the CS+ (Fig. 8C). Differences in mean freezing levels across successive bins were 37.33 ± 2.28 %, 22.21 ± 16.17 %, and 24.82 ± 20.40 %. The group differences were smaller when the 22 kHz USV served as the CS+ (Fig. 8D). Differences in mean freezing levels across successive bins were 2.36 ± 11.90 %, 14.53 ± 12.08 %, and 4.03 ± 11.84 %. During both the CS+ and CS− presentations, the mean freezing levels were considerably above the baseline levels (Fig. 8B – D).
ANOVA revealed a significant main effect of time interval (F(3,57) = 43.00, p < 0.001; Fig. 8B). Post-hoc paired-samples t-tests showed that subjects froze significantly more when the CS+ was presented during the first (72.49 ± 6.05 %; t(19) = −12.22, p < 0.001), second (59.56 ± 8.16 %; t(19) = −6.89, p < 0.001), and third (55.13 ± 7.35 %; t(19) = −6.72, p < 0.001) 2-min bins compared to the baseline level (5.73 ± 1.56 %). Animals also showed significantly more freezing to the CS− during the first (52.64 ± 8.40 %; t(19) = −6.13, p < 0.001), second (41.19 ± 8.15 %; t(19) = −4.79, p < 0.001), and third (40.70 ± 9.09 %; t(19) = −4.05, p < 0.05) 2-min bins of the stimulus presentation relative to the baseline level (4.57 ± 1.61 %). There was also a significant main effect of differential reinforcement of cues (F(1,19) = 4.43, p < 0.05). Significant differential responses to the CS+ and CS− only occurred during the first 2-min bin (t(19) = 2.38, p < 0.05) following the cue onset. There was no significant interaction between time interval and reinforcement (F(3,57) = 1.50, p > 0.05). In addition, independent-samples t-test revealed no significant difference (t(18) = 0.58, p > 0.05) in the amount of freezing during the 23 kHz USV CS+ (64.54 ± 9.87 %) and the 22 kHz USV CS+ (60.24 ± 8.66 %) presentations.
As indicated in Fig. 8C, subjects (n = 10) presented with the 23 kHz USV (5.71 s with 10 short calls; Fig. 8A, top) as the CS+ showed significantly more freezing to the CS+ (77.15 ± 8.00 %; t(9) = 4.09, p < 0.05) than to the CS− (22 kHz USV in Fig. 8A bottom; 39.83 ± 10.58 %) during the first 2-min bin, indicating that subjects were able to discriminate between the two cues. In contrast, subjects (n = 10; Fig. 8D) that received the 22 kHz USV (8.13 s, consisted of 4 long calls; Fig. 8A bottom) as the CS+ and the 23 kHz USV as the CS− displayed robust freezing to both the CS+ (67.82 ± 9.24 %) and the CS- (65.46 ± 12.22 %) during the first 2-min bin, without any significant difference (t(9) = 0.20, p > 0.05).
Figure 8.

Differential fear conditioning to a 23 kHz USV and a 22 kHz USV. (A) Spectrograms of the 23 USV (top) and the 22 kHz USV (bottom). (B) Overall mean percent freezing to the CS+ and the CS− (N = 20). (C) Mean percent freezing among subjects (n = 10) that received the 23 kHz USV (part A, top) as the CS+ and the 22 kHz USV (part A, bottom) as the CS−. (D) Mean percent freezing among subjects (n = 10) that received the 22 kHz USV as the CS+ and the 23 kHz USV as the CS−. The baseline level of freezing (before the CS onset) is plotted on the left of the vertical dashed line. Asterisks (*) denote significant differences between CS+ and CS−. Error bars represent ± 1 SE.
4.2.2. 19 kHz USV vs. 50 kHz USV cue
Results of the differential conditioning to a 19 kHz USV and a 50 kHz USV are summarized in Fig 9 (N = 20). Note in Fig. 9A that the frequency axis for the 19 kHz USV only spans 6 kHz, whereas it spans nearly 50 kHz for the 50 kHz USV. In the pooled data (Fig. 9B), the mean freezing levels were higher during the CS+ than during the CS− in all three 2-min time bins of the CS presentation. The differences in mean percent freezing were 24.02 ± 8.50 % during the first 2-min, 24.72 ± 9.54 %, 24.72 ± 9.54 % during the second 2-min, and 15.81 ± 12.27 % during the third 2-min bin. Compared to the pooled results (Fig. 9B), the percent differences were greater when the 19 kHz USV served as the CS+ (Fig. 9C): 36.92 ± 12.01 % during the first time bin, 44.91 ± 13.05 % during the second time bin, and 41.17 ± 46.71 % during the third time bin. The group differences were smaller, compared to the pooled results, when the 50 kHz USV served as the CS+ (Fig. 9D): 11.11 ± 11.14 % during the first time bin, 4.53 ± 11.11 % during the second time bin, and 9.56 ± 16.55 % during the third time bin. During both the CS+ and CS−presentations, the mean freezing levels were considerably above the baseline levels (Fig. 9B – D). Independent-samples t-test revealed no significant difference between the these USVs, when serving as a CS+, in total conditional freezing during the testing period (t(18) = 0.66, p > 0.05).
ANOVA revealed a significant main effect for time interval (F(3,57) = 38.11, p < 0.001) and differential reinforcement (F(1,19) = 6.05, p < 0.05), reflective of the fact that subjects were fear-conditioned to the cues and the fact that they were able to display differential responses to the CS+ and CS−. Post-hoc paired t-tests showed that subjects froze significantly more when the CS+ was presented during the first (66.63 ± 5.79 %; t(19) = −11.22, p < 0.001), second (60.63 ± 8.51 %; t(19) = −8.89, p < 0.001), and third (48.92 ± 9.10 %; t(19) = −5.08, p < 0.001) 2-min bins relative to the baseline level (1.89 ± 0.71%). During the CS− presentation, freezing was also elevated above the baseline level (2.35 ± 0.88 %) during the first (42.61 ± 7.89 %; t(19) = −4.93, p < 0.001), second (35.91 ± 8.16 %; t(19) = −3.92, p < 0.01), and third (33.12 ± 9.03 %; t(19) = −3.30, p < 0.01) 2-min time bins. There was also a significant interaction between time interval and reinforcement (F(3,57) = 2.82, p < 0.05) that could be due to greater decline in freezing across time bins to the CS+.
As indicated by the asterisks in Fig. 9C, subjects showed significantly higher freezing levels during the 19 kHz USV CS+ than during the 50 kHz USV CS−. The group differences were significant during the first (t(9) = 3.07, p < 0.05), second (t(9) = 3.44, p < 0.01) and third (t(9) =2.79, p < 0.05) 2-min bins (Fig. 9C). By contrast, there were no significant differences in mean levels of freezing during the 50 kHz USV CS+ and the 19 kHz USV CS− presentations (first bin, t(9) = 1.00, p > 0.05; second bin, t(9) = 0.41, p > 0.05; third bin, t(9) = −0.58, p > 0.05; Fig. 9D). The two time series essentially superimpose. This is another example of asymmetrical generalization of freezing. Fear generalized from the 50 kHz USV CS+ to the 19 kHz USV CS−more than it generalized from the 19 kHz USV CS+ to the 50 kHz USV CS−. Equivalently, conditioning to the 19 kHz USV was more “specific”. This “discrimination bias” (or AG in Eq. 4) thus persisted when the other member of the stimulus pair was a higher-frequency social signal with a larger bandwidth. The bias does not extend to all auditory social signals, but seems peculiar to 22 kHz USVs and similar stimuli.
Figure 9.

Differential fear conditioning to a 19 kHz USV and a 50 kHz USV. (A) Spectrograms of the 19 kHz USV (top) and the 50 kHz USV (bottom). (B) Overall mean percent freezing to the CS+ and the CS− (N = 20). (C) Mean percent freezing among subjects (n = 10) that received the 19 kHz USV (part A, top) as the CS+ and the 50 kHz USV (part A, bottom) as the CS−. (D) Mean percent freezing among subjects (n = 10) that received the 50 kHz USV as CS+ and the 19 kHz USV as CS−. The baseline level of freezing (before the CS onset) is plotted on the left of the vertical dashed line. Asterisks (*) denote significant differences between CS+ and CS−. Error bars represent ± 1 SE.
4.2.3. Effect sizes for discrimination
Figure 10 summarizes the effect sizes for discrimination in both cue pairs. The pooled results (Fig. 10A) show good overall discrimination between the 19 kHz USV and the 50 kHz USV cues (d = 0.79). Subjects also discriminated well (d = 0.62) between the 22 and 23 kHz USVs. The amount of asymmetrical stimulus generalization (AG in Eq. 4) within each cue pair is shown in the stippled bars in Fig. 10B. In the group receiving a 19 kHz USV and a 50 kHz USV as the cue pair, there was greater generalization of fear toward the 19 kHz USV stimulus (centripetal spread) than from it (centrifugal spread; AG = 1.15). The root frequencies of these two USVs differed by ~34 kHz (Fig. 9A). In the group receiving a 22 kHz USV and a 23 kHz USV as the cue pair, there was greater generalization of fear toward the 23 kHz USV (centripetal spread) stimulus than from it (centrifugal spread; AG = 1.19). The most obvious difference between these two stimuli is that the call durations of the 22 kHz USV were unusually long (Fig. 8A). The results of Experiments 2 and 3 are consistent with the supposition that root frequency and temporal discontinuity combine to determine asymmetrical stimulus generalization.
Figure 10.

Effect sizes for discrimination and magnitudes of asymmetrical generalization. (A) Overall effect size (d from Eq. 1) for discrimination between the CS+ and CS− for each of the 2 stimulus pairs. The 3 horizontal dotted lines denote small (S), medium (M), and large (L) effect sizes (see Cohen, 1988). (B) The black and white bars are partial effect sizes for discrimination (d1 and d2 from Eqs. 2 & 3). For each cue pair, the more USV-like stimulus (d1) is plotted on the right (black bars). The stippled bar is the amount of asymmetrical generalization (AG from Eq. 4).
4.3. Discussion
The 22 kHz and 50 kHz USVs were equally salient or effective in supporting delay fear conditioning (compare panels C and D of Fig. 9). After several CS-US pairings, there were no significant differences between the USVs in terms of CS+-elicited freezing levels. Overall, rats were able to discriminate between the 22 kHz and 50 kHz USVs (d = 0.79). Fear generalized from the 50 kHz USV CS+ to the 19 kHz USV CS− to a greater extent than from the 19 kHz CS+ to the 50 kHz USV CS−.
The 22 kHz USV and the 23 kHz USV were also equally salient or effective in supporting conditional freezing (compare panels C and D of Fig. 8). Overall, rats were able to discriminate between these USV pairs (d = 0.62). The generalization of fear from the 22 kHz USV CS+ to the 23 kHz USV CS− was greater than the generalization of fear from the 23 kHz USV CS+ to the 22 kHz USV CS−. These two USVs differed most prominently in terms of call durations (see Fig. 8A). Call durations have been suggested to reflect the degree of danger or urgency associated with the USVs (Brudzynski, 2001; 2005). The greatest urgency or danger was proposed to be associated with 0.4 – 0.8 s call durations (Brudzynski, 2001). The mean call duration of the 23 kHz USV (0.42 s) was within this range. The mean call duration of the 22 kHz USV (1.92 s) was unusually large. The results show that differential auditory conditioning can be difficult to interpret without knowing both the overall effect size (d in Eq. 1) and the partial effect sizes (d1 from Eq. 2 and d2 from Eq. 3).
Experiments 2 and 3 show that differences in principal frequency or discontinuity can support differential fear conditioning. Stimulus generalization was always greater when a 22 kHz USV or a similar stimulus (based on root frequency and temporal discontinuity) served as the CS− than when these stimuli served as the CS+. When the stimuli consisted of pairs of 22 kHz USVs, stimulus generalization was greater when the more typical one, which had a 0.4 s mean call duration, served as the CS− than when it served as the CS+. Similarly, when the stimulus pairs consisted of a 22 kHz USV and a 50 kHz USV, stimulus generalization was greater when the 22 kHz USV served as the CS− than when it served as the CS+. The prototype for introducing this discrimination bias could be ~22 kHz sounds that repeat at 1 - 3 Hz. Alternatively, there may be classes of stimuli that simply cannot support differential conditioning (discussed below). One wonders whether 50 kHz USVs introduce an analogous bias when the US is rewarding.
5. Experiment 4
In Experiments 2 and 3, rats displayed asymmetrical stimulus generalization of fear. The direction of the asymmetry was consistently toward the 22 kHz USV or similar cue (see discussion of Eq. 4). In principle, this interesting phenomenon might reflect non-associative sensitization to 22 kHz USV-like stimuli. Experiment 4 asks whether cue-specific sensitization can account for the discrimination bias. This experiment specifically evaluated the possibility that rats might become sensitized by the US to “fear-relevant stimuli” but not to “fear-irrelevant stimuli”, where relevance is based on evolutionary contingencies with other significant events. In Experiment 4, 19 kHz pips and 4 kHz pips cues were presented as in Experiments 2 and 3. The difference was that neither cue was presented during the time of the footshock US and neither cue predicted the US onset. This particular stimulus pair was selected because (in Experiment 2) it was associated with the greatest overall discrimination (d = 1.37) and the greatest asymmetry of generalization (AG = 1.68). The issue was whether sensitization (or context conditioning) can selectively increase freezing to the 19 kHz pips cue. The US grid shock was the same as in Experiments 2 and 3.
5.1. Materials and Methods
5.1.1. Subjects
Eight male Sprague-Dawley rats were used (230–280 g; Charles River Laboratories, Kingston, NY). Subjects were individually housed and had ad libitum access to food and water. They were kept on a 12-hr dark/light cycle. Experiments were in compliance with Yale University’s Institutional Animal Care and Use Committee guidelines.
5.1.2. Auditory stimuli
The 19 kHz and 4 kHz discontinuous tone pips were identical to those used in Experiment 2. Both discontinuous tones were 7.8 s with 10 ms rise/fall time (Fig. 11). The loudness of both tones was 65 dbSPL.
5.1.3. Behavioral procedures
The apparatus was identical to that used in Experiments 2 and 3. Upon arrival, naïve rats were briefly handled for 3 – 5 days. On the day of pseudorandom conditioning, rats were presented with a total of 30 trials, consisting of 10 trials each of a 4 kHz pips stimulus, a 19 kHz pips stimulus, and a US footshock (0.4 s, 0.6 mA). Stimulus presentations were at pseudo-random times (ITI = 120 ± 30 s) with the restriction that none of the stimuli were presented in more then two consecutive trials.
After conditioning, animals were returned to their home cages. On the next two days, freezing to the two cues was tested in two novel testing chambers. CS1 and CS2 testing days were counterbalanced between animals to lessen serial-order or extinction effects. In each testing session, animals were presented with 6-min of cue presentation following a 2-min baseline. All testing sessions were recorded for off-line analysis.
5.1.4. Data Analysis
Freezing behavior was measured by automated freezing-recognition software as in the previous experiments. The total amounts of freezing (during the 2-min baseline period and during the 6-min of the stimulus presentation) were converted to percentages. Statistical analysis used paired-samples t-tests.
5.2. Results
Figure 11 shows the mean percentage of time spent freezing during the baseline period and during the 6-min of stimulus presentation. The plot clearly shows that the conditioning procedure had little or no effect on freezing to either cue and certainly had no cue-specific effect. During the 6-min testing session, there was no difference between the cues in terms of levels of freezing (t(7) = −0.02, p > 0.05). Although freezing during the 19 kHz pips cue (Fig. 11A, bottom spectrogram) was 10.81 ± 8.42 % higher than during the baseline period (where the mean was 3.31 ± 1.23 %), these differences were not significant (t(7) = −1.28, p > 0.05). Similarly, freezing during the 4 kHz pips (Fig. 11A, top spectrogram) was 12.98 ± 5.95 % higher than during the baseline period (where the mean was 0.98 ± 0.67 %), but these differences were also insignificant (t(7) = 2.18, p > 0.05). There was no hint of “cue-specific” sensitization or cue-specific effects of context conditioning (Fig. 11B).
Figure 11.
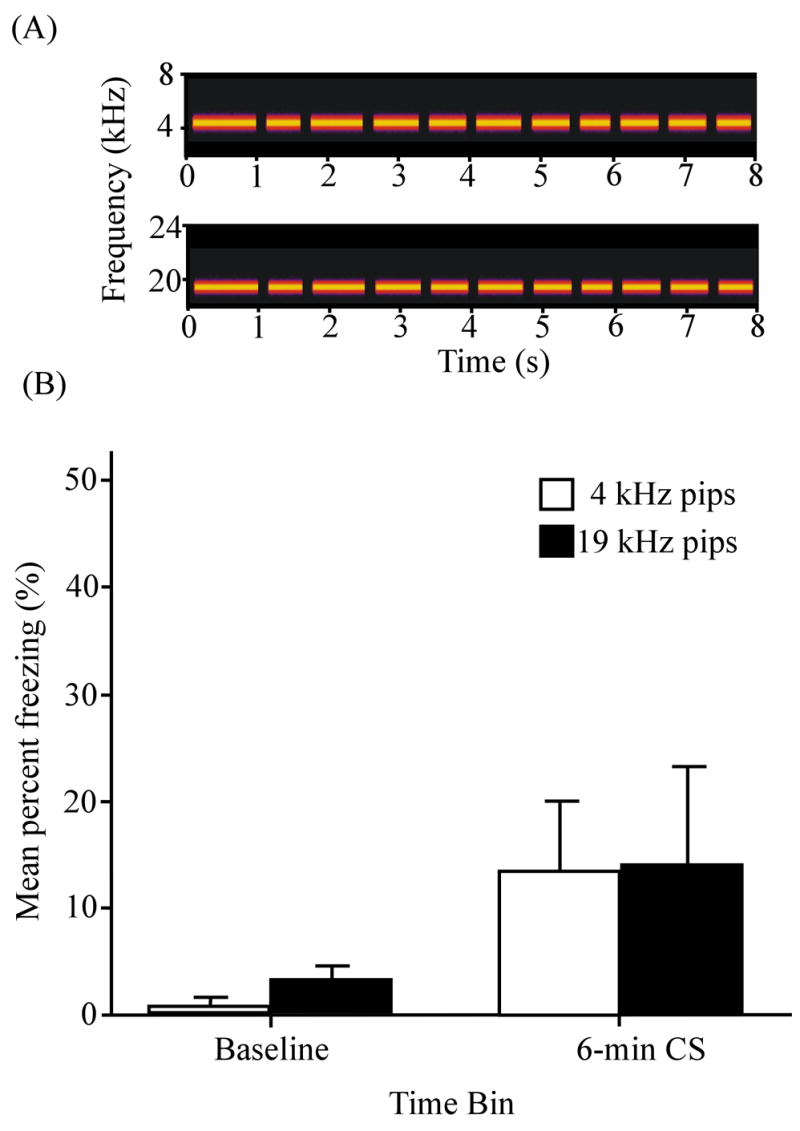
Pseudo-conditioning using 4 kHz and 19 kHz discontinuous tones. This stimulus pair was selected because it previously resulted in the greatest overall discrimination (Fig. 7A) and asymmetrical generalization (Fig. 7B). (A) Spectrograms of the 4 kHz tone pips (top; same as Fig. 5A bottom) and the 19 kHz tone pips (bottom; same as Fig. 5A top). (B) Mean percent freezing during the 2 min baseline period and during 6 min of cue presentation (N = 8). White and black bars denote 4 kHz pips and 19 kHz pips, respectively. Error bars represent ± 1 SE.
5.3. Discussion
Experiment 4 evaluated the working assumption that the differences in freezing to the CS+ and CS− reflect the outcome of associative conditioning to the CS+. Experiment 4 examined the two alternative possibilities. The first is that the asymmetry reflects a form of non-associative sensitization that has cue-specific effects. The second is that context conditioning has cue-specific effects. Both possibilities suppose that pre-wired circuitry supports the processing of “fear-relevant” stimuli and that this circuitry becomes enabled under conditions of high fear, anxiety or arousal (Gray, 1982; 1987; Lovibond et al., 1993). One study of humans found that an aversive electrical stimulation sensitized responding to “fear-relevant” stimuli but not to “fear-irrelevant” stimuli (Öhman et al., 1975).
Quite clearly, the results of Experiment 4 (Fig. 11) do not support these alternative interpretations. Asymmetrical stimulus generalization in differential cue conditioning clearly emerges from a pairing-dependent (associative) mechanism. This novel bias on discrimination/generalization (AG in Eq. 4) may reflect an innate tendency to generalize auditory-elicited fear toward social-alarm-like signals. Said differently, aversive conditioning to alarm signals is more stimulus-specific.
6. General Discussion
6.1. Summary of five main findings
The present study was the first examination of differential fear conditioning to natural auditory stimuli in rodents. The auditory stimuli consisted of 22 kHz USVs, a 50 kHz USV, and various synthetic stimuli that were designed to “deconstruct” the 22 kHz USVs into simpler acoustic features. We focused on three categories of auditory features: principal frequency, discontinuity, and frequency/amplitude modulations. Five main findings emerged.
First, 22 kHz USVs did not differ from 50 kHz USVs, continuous tones, or temporally-matched discontinuous tones in terms of the unconditional elicitation of freezing behavior (Fig. 2). More specifically, among experimentally naïve Sprague-Dawley rats, there were no significant differences between 22 kHz USVs and any of the other stimuli in terms of the elicitation of freezing. Based on freezing behavior, 22 kHz USVs were therefore as “neutral” as the other stimuli prior to conditioning, as reported in another recent study (Endres et al., 2007).
Second, when serving as the reinforced stimulus (the CS+), the 22 kHz USV was no more effective than the 50 kHz USV or the tones in supporting conditional freezing. Thus, the natural and synthetic stimuli were equivalently “salient” or efficacious in supporting delay fear conditioning (compare panel C and D in Figs. 3–6, 8 & 9). Notably, these experiments were designed to minimize “ceiling effects” that might otherwise obscure differences among the cues. We previously compared continuous tones (22 kHz and 50 kHz) and USVs (22 kHz and 50 kHz) in single-cue conditioning (Tankhiwale et al., 2007). Using this non-differential conditioning paradigm, there were also no significant differences among stimuli in terms of levels of conditional freezing (Tankhiwale et al., 2007).
The results thus suggest that freezing to 22 kHz USVs is not innate, but instead emerges as a consequence of associative learning. A recent study of Sprague-Dawley rats reached this same conclusion (Endres et al., 2007). Evidence that adaptive responses to social signals require learning has also been reported in monkeys, squirrels, and birds (Herzog & Hopf, 1984; Mateo, 1996; Mateo & Holmes, 1997; McCowan et al., 2001; Platzen & Magrath, 2005; Ramakrishnan & Coss, 2000). Rodent USVs appear to be another example of a social signal whose meaning or significance depends on experience. The present findings do not challenge well-established views regarding the communicative significance of USVs (Blanchard & Blanchard, 1989; Blanchard et al., 1991; Brunelli, 2005; D’Amato et al., 2005; Hofer et al., 1998), but they certainly pique curiosity about how affective or defensive reactions become associated with these social signals.
Third, rats discriminated between the CS+ and the un-reinforced cue (the CS−) based on the principal frequency and/or temporal discontinuity of the signal (Figs. 3–5), but they failed to discriminate based on the presence or absence of the frequency and amplitude modulations that characterize 22 kHz USVs. In particular, rats failed to respond differentially to a 19 kHz USV and 19 kHz discontinuous tone pips (Fig. 6). The discontinuous tone was matched to the USV in terms of loudness, principal frequency, and on-off pattern (Fig. 6A). The discontinuous tone differed in that it lacked the amplitude and frequency modulations that are characteristics of 22 kHz USVs. The presence/absence of these modulations was not sufficient to support differential freezing to the CS+ and CS−. These results were anticipated by one prominent hypothesis (Brudzynski, 2001; 2005) about the “communicative information” in a 22 kHz USV. According to this hypothesis, the principal frequency of a 22 kHz USV and call durations are the key dimensions for communication, whereas the modulations carry no significant information (also see Allen et al., 2007).
Fourth, conditioning to the 22 kHz USV or a similar synthetic stimulus was more “cue specific”. When a 22 kHz USV or similar stimulus (19 kHz discontinuous tone pips) served as the CS+, there was less generalization of fear (freezing) to the CS− than when these same stimuli instead served as the CS− (compare panel C and D in Figs. 3–5 & 9). Surprisingly, rats failed to discriminate between the CS+ and CS− when a 22 kHz USV or a similar stimulus served as the CS−. By contrast, they clearly did discriminate when the 22 kHz USV or a similar stimulus served as the CS+. Thus, the amount of stimulus generalization (from the CS+ to the CS−) depended on which stimuli served as the CS+ or the CS−. This asymmetrical stimulus generalization is alternatively viewed as a “discrimination bias” (Eq. 4 and associated text).
Fifth, asymmetrical stimulus generalization cannot be explained in terms of a non-associative mechanism (“cue-specific sensitization”). This possibility was examined using pseudorandom conditioning trials in which animals were exposed to two cues in the usual manner except that neither cue was explicitly paired with the US. The results revealed no cue-specific sensitization (no cue-specific pseudo-conditioning effect; Fig. 11). These same results also ruled out cue-specific effects of context conditioning. Thus, asymmetrical stimulus generalization depends on associative cue conditioning. The asymmetrical stimulus generalization reported here appears to reflect a novel form of “biological preparedness” (see Domjan et al., 2004; Garcia et al., 1989; Mineka & Öhman, 2002; Öhman & Mineka, 2001; Seligman, 1970; 1971; Seligman & Hager, 1972) in the auditory fear conditioning system.
We do not know whether the outcomes would be identical during testing if the CS−presentations were eliminated from the conditioning stage of the experiment. One reason for the uncertainty is that CS− presentations might cause long-term synaptic depression in the fear circuit (Collins & Paré, 2000). Another reason is that inhibitory conditioning might accrue to the CS− by virtue of its being explicitly unpaired with the US.
6.2. Potentially relevant findings in other studies
Asymmetrical stimulus generalization has also been reported in studies of differential appetitive cue conditioning in honey bees (Bhagavan & Smith, 1997; Sandoz et al., 2001). The CS pairs were an alarm odor (pheromone) and a floral odor. The US was a sucrose reward. The bees showed considerable generalization from the CS+ to the CS− when the alarm odor served as the CS+; whereas they showed little generalization when the floral odor served as the CS+ (Sandoz et al., 2001). Thus, conditioning was more cue-specific when the CS+ and US were “congruent”. One presumes that, during the evolution of honey bees, floral smells have been more predictive than alarm signals of sucrose reward. A discrimination bias was also recently reported in bumble bees subjected to differential odor conditioning (Laloi & Pham-Delègue, 2004). The present findings in rats might also be viewed in terms of CS/US congruency.
Turning to rats, we first note that asymmetrical stimulus generalization is not an inevitable consequence of differential fear conditioning. One recent study (Goosens et al., 2003) used a 2 kHz continuous tone and a white noise burst as cues that were differentially paired with a grid shock US. In contrast to our results (Figs. 3–5, 8 & 9), they report that differential freezing to the CS+ and CS− did not depend on which stimulus served as the CS+. Results similar to ours have been reported using pairs of drugs as interceptive discriminative stimuli. When rats are differentially conditioned to pairs of drugs (acting as the CS+ and CS−), the outcomes are commonly described as exhibiting “asymmetrical generalization” (Bondareva et al., 2002) or “asymmetrical cross generalization” (Desai et al., 2003; Kelley et al., 1995; Wiley & Martin, 1999).
Studies of monkeys have also found discrimination biases similar to those observed here. In one set of studies (Cook & Mineka, 1989, 1990), monkeys watched a model monkey show fearful reactions to an image of a fear-relevant stimulus (toy snake or toy crocodile) or a fear-irrelevant stimulus (flowers or a toy rabbit). When the model monkey displayed fearful responses to the fear-relevant stimuli and not to the fear-irrelevant stimuli, the observer monkeys developed selective fear reactions to the CS+. However, when the fear response of the model monkey was paired with a fear-irrelevant stimulus, the observer monkeys failed to display differential responses to the CS+ and CS− (Cook & Mineka, 1989; 1990). As in the present study, differential responding depended on which stimulus served as the CS+.
A similar discrimination bias has been reported in humans. One study found differential skin conductance responses to a CS+ and a CS− when fearful faces served as the CS+, but not when happy faces served as the CS+ (Orr & Lanzetta, 1980). Other studies failed to detect differential responses when the CS+ and CS− were fear-irrelevant (Öhman & Dimberg, 1978; Olsson et al., 2005; but see McNally & Foa, 1986; Merckelbach et al., 1987). It has been suggested that the effects of fear-relevant and fear-irrelevant stimuli reflect an adaptive form of biological preparedness in humans (Öhman & Mineka, 2001).
6.3. General Conclusions
The asymmetrical stimulus generalization reported here is a novel form of “biological preparedness” (Seligman, 1970; 1971) in the auditory fear conditioning system. Rats appear to have a predisposition to generalize acquired fear toward 22 kHz USVs or similar stimuli. Just as with other preparedness phenomena (see Cusato & Domjan, 1998; Domjan et al., 2004; Krause et al., 2003), asymmetrical stimulus generalization is unpredicted by conventional animal learning theories. Our brief survey of the literature shows that related findings have been reported across phylogeny—from honey bees to humans. In rats, asymmetrical generalization has now been well documented for both exteroceptive and interoceptive stimuli. The cumulative effect of discrimination biases of the kind described here could be profound. These biases strongly encourage developmental and neurobiological studies of emotional responses to social signals. More generally, they encourage focus on ethologically important classes of natural stimuli.
Acknowledgments
We thank Dr. Michael Domjan for useful discussion. This research was supported by National Institutes of Health grants MH58405 and AG19645 (THB) and Yale University.
Footnotes
Publisher's Disclaimer: This is a PDF file of an unedited manuscript that has been accepted for publication. As a service to our customers we are providing this early version of the manuscript. The manuscript will undergo copyediting, typesetting, and review of the resulting proof before it is published in its final citable form. Please note that during the production process errors may be discovered which could affect the content, and all legal disclaimers that apply to the journal pertain.
References
- Allen TA, Furtak SC, Brown TH. Single-unit responses to 22 kHz ultrasonic vocalizations in rat perirhinal cortex. Behavioural Brain Research. 2007;182(2):327–336. doi: 10.1016/j.bbr.2007.03.009. [DOI] [PMC free article] [PubMed] [Google Scholar]
- Anderson JW. The production of ultrasonic sounds by laboratory rats and other mammals. Science. 1954;119(3101):808–809. doi: 10.1126/science.119.3101.808. [DOI] [PubMed] [Google Scholar]
- Barfield RJ, Geyer LA. Sexual behavior: Ultrasonic postejaculatory song of the male rat. Science. 1972;176(41):1349–1350. doi: 10.1126/science.176.4041.1349. [DOI] [PubMed] [Google Scholar]
- Bhagavan S, Smith BH. Olfactory conditioning in the honey bee, Apis mellifera: Effects of odor intensity. Physiology & Behavior. 1997;61(1):107–117. doi: 10.1016/s0031-9384(96)00357-5. [DOI] [PubMed] [Google Scholar]
- Blair HT, Sotres-Bayon F, Moita MA, LeDoux JE. The lateral amygdala processes the value of conditioned and unconditioned aversive stimuli. Neuroscience. 2005;133(2):561–569. doi: 10.1016/j.neuroscience.2005.02.043. [DOI] [PubMed] [Google Scholar]
- Blanchard RJ, Blanchard DC. Antipredator defensive behaviors in a visible burrow system. Journal of Comparative Psychology. 1989;103(1):70–82. doi: 10.1037/0735-7036.103.1.70. [DOI] [PubMed] [Google Scholar]
- Blanchard RJ, Blanchard DC, Rodgers J, Weiss SM. The characterization and modelling of antipredator defensive behavior. Neuroscience and Biobehavioral Reviews. 1990;14(4):463–472. doi: 10.1016/s0149-7634(05)80069-7. [DOI] [PubMed] [Google Scholar]
- Blanchard RJ, Blanchard DC, Agullana R, Weiss SM. Twenty-two kHz alarm cries to presentation of a predator, by laboratory rats living in visible burrow systems. Physiology & Behavior. 1991;50(5):967–972. doi: 10.1016/0031-9384(91)90423-l. [DOI] [PubMed] [Google Scholar]
- Boguszewski PM, Bang S, Brown TH. Machine analysis of conditional and unconditional freezing behavior in rats. Society for Neuroscience Abstract. 2007;33:316.1. [Google Scholar]
- Bondareva TS, Young R, Glennon RA. Central stimulants as discriminative stimuli: Asymmetric generalization between (−)ephedrine and S(+)methamphetamine. Pharmacology, Biochemistry and Behavior. 2002;74(1):157–162. doi: 10.1016/s0091-3057(02)00963-2. [DOI] [PubMed] [Google Scholar]
- Borg E. Auditory thresholds in rats of different age and strain. A behavioral and electrophysiological study. Hearing Research. 1982;8(2):101–115. doi: 10.1016/0378-5955(82)90069-7. [DOI] [PubMed] [Google Scholar]
- Borta A, Wöhr M, Schwarting RKW. Rat ultrasonic vocalization in aversively motivated situations and the role of individual differences in anxiety-related behavior. Behavioural Brain Research. 2006;166(2):271–280. doi: 10.1016/j.bbr.2005.08.009. [DOI] [PubMed] [Google Scholar]
- Brown RE. The 22-kHz pre-ejaculatory vocalizations of the male rat. Physiology & Behavior. 1979;22(3):483–489. doi: 10.1016/0031-9384(79)90014-3. [DOI] [PubMed] [Google Scholar]
- Brudzynski SM. Pharmacological and behavioral characteristics of 22 kHz alarm calls in rats. Neuroscience and Biobehavioral Reviews. 2001;25(7–8):611–617. doi: 10.1016/s0149-7634(01)00058-6. [DOI] [PubMed] [Google Scholar]
- Brudzynski SM. Principles of rat communication: quantitative parameters of ultrasonic calls in rats. Behavior Genetics. 2005;35(1):85–92. doi: 10.1007/s10519-004-0858-3. [DOI] [PubMed] [Google Scholar]
- Brudzynski SM. Ultrasonic calls of rats as indicator variables of negative or positive states: Acetylcholine-dopamine interaction and acoustic coding. Behavioural Brain Research. 2007;182(2):261–273. doi: 10.1016/j.bbr.2007.03.004. [DOI] [PubMed] [Google Scholar]
- Brudzynski SM, Chiu EMC. Behavioural responses of laboratory rats to playback of 22 kHz ultrasonic calls. Physiology & Behavior. 1995;57(6):1039–1044. doi: 10.1016/0031-9384(95)00003-2. [DOI] [PubMed] [Google Scholar]
- Brudzynski SM, Holland G. Acoustic characteristics of air puff-induced 22-kHz alarm calls in direct recordings. Neuroscience & Biobehavioral Reviews. 2005;29(8):1169–1180. doi: 10.1016/j.neubiorev.2005.04.007. [DOI] [PubMed] [Google Scholar]
- Brudzynski SM, Bihari F, Ociepa D, Fu XW. Analysis of 22 kHz ultrasonic vocalization in laboratory rats: Long and short calls. Physiology & Behavior. 1993;54(2):215–221. doi: 10.1016/0031-9384(93)90102-l. [DOI] [PubMed] [Google Scholar]
- Brunelli SA. Selective breeding for an infant phenotype: Rat pup ultrasonic vocalization (USV) Behavior Genetics. 2005;35(1):53–65. doi: 10.1007/s10519-004-0855-6. [DOI] [PubMed] [Google Scholar]
- Brunelli SA, Vinocur DD, Soo-Hoo D, Hofer MA. Five generations of selective breeding for ultrasonic vocalization (USV) responses in N: NIH strain rats. Developmental Psychobiology. 1997;31(4):255–265. doi: 10.1002/(sici)1098-2302(199712)31:4<255::aid-dev3>3.0.co;2-q. [DOI] [PubMed] [Google Scholar]
- Burgdorf J, Panksepp J. Tickling induces reward in adolescent rats. Physiology & Behavior. 2001;72(1–2):167–173. doi: 10.1016/s0031-9384(00)00411-x. [DOI] [PubMed] [Google Scholar]
- Burgdorf J, Panksepp J, Brudzynski SM, Kroes R, Moskal JR. Breeding for 50-kHz positive affective vocalization in rats. Behavior genetics. 2005;35(1):67–72. doi: 10.1007/s10519-004-0856-5. [DOI] [PubMed] [Google Scholar]
- Choi JS, Brown TH. Central amygdala lesions block ultrasonic vocalization and freezing as conditional but not unconditional responses. Journal of Neuroscience. 2003;23(25):8713–8721. doi: 10.1523/JNEUROSCI.23-25-08713.2003. [DOI] [PMC free article] [PubMed] [Google Scholar]
- Ciucci MR, Ma ST, Fox C, Kane JR, Ramig LO, Schallert T. Qualitative changes in ultrasonic vocalization in rats after unilateral dopamine depletion or haloperidol: A preliminary study. Behavioural Brain Research. 2007;182(2):284–289. doi: 10.1016/j.bbr.2007.02.020. [DOI] [PMC free article] [PubMed] [Google Scholar]
- Cohen J. Statistical power analysis for the behavioral sciences. New York: Academic Press; 1988. [Google Scholar]
- Collins DR, Paré D. Differential fear conditioning induces reciprocal changes in the sensory responses of lateral amygdala neurons to the CS(+) and CS(−) Learning & Memory. 2000;7(2):97–103. doi: 10.1101/lm.7.2.97. [DOI] [PMC free article] [PubMed] [Google Scholar]
- Cook M, Mineka S. Observational conditioning of fear to fear-relevant versus fear-irrelevant stimuli in rhesus monkeys. Journal of Abnormal Psychology. 1989;98(4):448–459. doi: 10.1037//0021-843x.98.4.448. [DOI] [PubMed] [Google Scholar]
- Cook M, Mineka S. Selective associations in the observational conditioning of fear in rhesus monkeys. Journal of Experimental Psychology: Animal Behavior Processes. 1990;16(4):372–389. [PubMed] [Google Scholar]
- Cuomo V, Cagiano R, De Salvia MA, Maselli MA, Renna G, Racagni G. Ultrasonic vocalization in response to unavoidable aversive stimuli in rats: Effects of benzodiazepines. Life Sciences. 1988;43(6):485–491. doi: 10.1016/0024-3205(88)90149-x. [DOI] [PubMed] [Google Scholar]
- Cusato B, Domjan M. Special efficacy of sexual conditioned stimuli that include species typical cues: Tests with a conditioned stimuli pre-exposure design. Learning and Motivation. 1998;29(2):152–167. [Google Scholar]
- D’Amato FR, Scalera E, Sarli C, Moles A. Pups call, mothers rush: Does maternal responsiveness affect the amount of ultrasonic vocalizations in mouse pups? Behavior Genetics. 2005;35(1):103–112. doi: 10.1007/s10519-004-0860-9. [DOI] [PubMed] [Google Scholar]
- Davey GC, Cavanagh K, Lamb A. Differential aversive outcome expectancies for high- and low-predation fear-relevant animals. Journal of Behavior Therapy and Experimental Psychiatry. 2003;34(2):117–128. doi: 10.1016/s0005-7916(03)00024-7. [DOI] [PubMed] [Google Scholar]
- Desai RI, Barber DJ, Terry P. Dopaminergic and cholinergic involvement in the discriminative stimulus effects of nicotine and cocaine in rats. Psychopharmacology. 2003;167(4):335–343. doi: 10.1007/s00213-003-1426-x. [DOI] [PubMed] [Google Scholar]
- Domjan M, Cusato B, Krause M. Learning with arbitrary versus ecological conditioned stimuli: Evidence from sexual conditioning. Psychonomic Bulletin & Review. 2004;11(2):232–246. doi: 10.3758/bf03196565. [DOI] [PubMed] [Google Scholar]
- Endres T, Widmann K, Fendt M. Are rats predisposed to learn 22 kHz calls as danger-predicting signals? Behavioural Brain Research. 2007;185(2):69–75. doi: 10.1016/j.bbr.2007.07.012. [DOI] [PubMed] [Google Scholar]
- Garcia J, Koelling RA. The relation of cue to consequence in avoidance learning. Psychonomic Science. 1966;4:123–124. [Google Scholar]
- Garcia J, Brett LP, Rusiniak KW. Limits of Darwinian conditioning. In: Klein SB, Mowrer RR, editors. Contemporary learning theories: instrumental conditioning theory and the impact of biological constraints on learning. Hillsdale, NJ: Erlbaum; 1989. pp. 181–203. [Google Scholar]
- Gemberling GA, Domjan M. Selective associations in one-day-old rats: Taste-toxicosis and texture-shock aversion learning. Journal of Comparative and Physiological Psychology. 1982;96(1):105–113. doi: 10.1037/h0077855. [DOI] [PubMed] [Google Scholar]
- Goosens KA, Hobin JA, Maren S. Auditory-evoked spike firing in the lateral amygdala and Pavlovian fear conditioning: Mnemonic code or fear bias? Neuron. 2003;40(5):1013–1022. doi: 10.1016/s0896-6273(03)00728-1. [DOI] [PubMed] [Google Scholar]
- Gourevitch G. Auditory masking in the rat. Journal of the Acoustical Society of America. 1965;37:439–443. doi: 10.1121/1.1909348. [DOI] [PubMed] [Google Scholar]
- Gourevitch G, Hack MH. Audibility in the rat. Journal of Comparative and Physiological Psychology. 1966;62(2):289–291. doi: 10.1037/h0023669. [DOI] [PubMed] [Google Scholar]
- Gray JA. The neuropsychology of anxiety: An enquiry into the functions of the septohippocampal system. Oxford: Clarendon Press; 1982. [Google Scholar]
- Gray JA. The psychology of fear and stress. 2. New York: McGraw-Hill; 1987. [Google Scholar]
- Green DM, Swets JA. Signal detection theory and psychophysics. New York: Wiley; 1966. [Google Scholar]
- Hahn ME, Hewitt JK, Adams M, Tully T. Genetic influences on ultrasonic vocalizations in young mice. Behavior Genetics. 1987;17(2):155–166. doi: 10.1007/BF01065994. [DOI] [PubMed] [Google Scholar]
- Hamdani S, White NM. Effects of lateral amygdala lesions on conditioned taste aversion (CTA) and ultrasonic vocalizations (USV) at two levels of water deprivation. Society for Neuroscience Abstract. 2007;33:934.1. [Google Scholar]
- Hamdani S, Killikelly C, Tuerke KJ, White NM. Rats’ ultrasound vocalizations as indices of affective state in conditioned taste aversion. Society for Neuroscience Abstract. 2006;32:752.8. [Google Scholar]
- Herzog M, Hopf S. Behavioral responses to species-specific warning calls in infant squirrel monkeys reared in social isolation. American Journal of Primatology. 1984;7(2):99–106. doi: 10.1002/ajp.1350070204. [DOI] [PubMed] [Google Scholar]
- Hofer MA, Masmela JR, Brunelli SA, Shair HN. The ontogeny of maternal potentiation of the infant rats’ isolation call. Developmental Psychobiology. 1998;33(3):189–201. doi: 10.1002/(sici)1098-2302(199811)33:3<189::aid-dev1>3.0.co;2-n. [DOI] [PubMed] [Google Scholar]
- Irwin RJ, Stillman JA, Hautus MJ, Huddleston LM. The measurement of taste discrimination with the same-different task: A detection-theory analysis. Journal of Sensory Studies. 1993;8(3):229–239. [Google Scholar]
- Kelley BM, Porter JH, Varvel SA. Mianserin as a discriminative stimulus in rats: Asymmetrical cross-generalization with scopolamine. Psychopharmacology. 1995;120(4):491–493. doi: 10.1007/BF02245823. [DOI] [PubMed] [Google Scholar]
- Kelly JB, Masterton RB. Auditory sensitivity of the albino rat. Journal of Comparative and Physiological Psychology. 1977;91(4):930–936. doi: 10.1037/h0077356. [DOI] [PubMed] [Google Scholar]
- Knutson B, Burgdorf J, Panksepp J. Anticipation of play elicits high-frequency ultrasonic vocalizations in young rats. Journal of Comparative Psychology. 1998;112(1):65–73. doi: 10.1037/0735-7036.112.1.65. [DOI] [PubMed] [Google Scholar]
- Knutson B, Burgdorf J, Panksepp J. High-frequency ultrasonic vocalizations index conditioned pharmacological reward in rats. Physciology & Behavior. 1999;66(4):639–643. doi: 10.1016/s0031-9384(98)00337-0. [DOI] [PubMed] [Google Scholar]
- Knutson B, Burgdorf J, Panksepp J. Ultrasonic vocalizations as indices of affective states in rats. Psychological Bulletin. 2002;128(6):961–77. doi: 10.1037/0033-2909.128.6.961. [DOI] [PubMed] [Google Scholar]
- Krause MA, Cusato B, Domjan M. Extinction of conditioned sexual responses in male Japanese quail (Coturnix japonica): Role of species-typical cues. Journal of Comparative Psychology. 2003;117(1):76–86. doi: 10.1037/0735-7036.117.1.76. [DOI] [PubMed] [Google Scholar]
- Laloi D, Pham-Delègue MH. Bumble bees show asymmetrical discrimination between two odors in a classical conditioning procedure. Journal of Insect Behavior. 2004;17(3):385–396. [Google Scholar]
- Lee HJ, Choi JS, Brown TH, Kim JJ. Amygdalar NMDA receptors are critical for the expression of multiple conditioned fear responses. Journal of Neuroscience. 2001;21(11):4116–4124. doi: 10.1523/JNEUROSCI.21-11-04116.2001. [DOI] [PMC free article] [PubMed] [Google Scholar]
- Litvin Y, Blanchard DC, Blanchard RJ. Rat 22 kHz ultrasonic vocalizations as alarm cries. Behavioural Brain Research. 2007;182(2):166–172. doi: 10.1016/j.bbr.2006.11.038. [DOI] [PubMed] [Google Scholar]
- Lovibond PF, Siddle DA, Bond NW. Resistance to extinction of fear-relevant stimuli: Preparedness or selective sensitization? Journal of Experimental Psychology: General. 1993;122(4):449–461. doi: 10.1037//0096-3445.122.4.449. [DOI] [PubMed] [Google Scholar]
- Macmillan NA, Creelman CD. Detection theory: A user’s guide. Cambridge: Cambridge University Press; 1991. [Google Scholar]
- Madden DJ, Turkington TG, Provenzale JM, Denny LL, Hawk TC, Gottlob LR, Coleman RE. Adult age differences in the functional neuroanatomy of verbal recognition memory. Human Brain Mapping. 1999;7(2):115–135. doi: 10.1002/(SICI)1097-0193(1999)7:2<115::AID-HBM5>3.0.CO;2-N. [DOI] [PMC free article] [PubMed] [Google Scholar]
- Mateo JM. The development of alarm call response behaviour in free living juvenile Belding’s ground squirrels. Animal Behaviour. 1996;52(3):489–505. doi: 10.1006/anbe.1996.0446. [DOI] [PubMed] [Google Scholar]
- Mateo JM, Holmes WG. Development of alarm-call responses in Belding’s ground squirrels: the role of dams. Animal Behaviour. 1997;54(3):509–524. doi: 10.1006/anbe.1996.0446. [DOI] [PubMed] [Google Scholar]
- McCowan B, Franceschini NV, Vicino GA. Age differences and developmental trends in alarm peep responses by squirrel monkeys (Saimiri sciureus) American Journal of Primatology. 2001;53(1):19–31. doi: 10.1002/1098-2345(200101)53:1<19::AID-AJP2>3.0.CO;2-#. [DOI] [PubMed] [Google Scholar]
- McGinnis MY, Vakulenko M. Characterization of 50-kHz ultrasonic vocalizations in male and female rats. Physiology & Behavior. 2003;80(1):81–88. doi: 10.1016/s0031-9384(03)00227-0. [DOI] [PubMed] [Google Scholar]
- McNally RJ, Foa EB. Preparedness and resistance to extinction to fear-relevant stimuli: A failure to replicate. Behaviour Research and Therapy. 1986;24(5):529–535. doi: 10.1016/0005-7967(86)90033-1. [DOI] [PubMed] [Google Scholar]
- Merckelbach H, van der Molen GM, van den Hout MA. Electrodermal conditioning to stimuli of evolutionary significance: Failure to replicate the preparedness effect. Journal of Psychopathology and Behavioral Assessment. 1987;9(3):313–326. [Google Scholar]
- Mineka S, Öhman A. Phobias and preparedness: The selective, automatic, and encapsulated nature of fear. Biological Psychiatry. 2002;52(10):927–937. doi: 10.1016/s0006-3223(02)01669-4. [DOI] [PubMed] [Google Scholar]
- Öhman A, Dimberg U. Facial expressions as conditioned stimuli for electrodermal responses: A case of “preparedness”? Journal of Personality and Social Psychology. 1978;36(11):1251–1258. doi: 10.1037//0022-3514.36.11.1251. [DOI] [PubMed] [Google Scholar]
- Öhman A, Mineka S. Fears, phobias, and preparedness: Toward an evolved module of fear and fear learning. Psychological Review. 2001;108(3):483–522. doi: 10.1037/0033-295x.108.3.483. [DOI] [PubMed] [Google Scholar]
- Öhman A, Eriksson A, Olofsson C. One-trial learning and superior resistance to extinction of autonomic responses conditioned to potentially phobic stimuli. Journal of Comparative and Physiological Psychology. 1975;88(2):619–627. doi: 10.1037/h0078388. [DOI] [PubMed] [Google Scholar]
- Olsson A, Ebert JP, Banaji MR, Phelps EA. The role of social groups in the persistence of learned fear. Science. 2005;309(5735):785–787. doi: 10.1126/science.1113551. [DOI] [PubMed] [Google Scholar]
- Orr SP, Lanzetta JT. Facial expressions of emotion as conditioned stimuli for human autonomic responses. Journal of Personality and Social Psychology. 1980;38(2):278–282. doi: 10.1037//0022-3514.38.2.278. [DOI] [PubMed] [Google Scholar]
- Panksepp J. Neuroevolutionary sources of laughter and social joy: Modeling primal human laughter in laboratory rats. Behavioural Brain Research. 2007;182(2):231–244. doi: 10.1016/j.bbr.2007.02.015. [DOI] [PubMed] [Google Scholar]
- Panksepp J, Burgdorf J. 50-kHz chirping (laughter?) in response to conditioned and unconditioned tickle-induced reward in rats: Effects of social housing and genetic variables. Behavioural Brain Research. 2000;115(1):25–38. doi: 10.1016/s0166-4328(00)00238-2. [DOI] [PubMed] [Google Scholar]
- Panksepp J, Burgdorf J, Gordon N. Towards a genetics of joy: Breeding rats for “laughter”. In: Kaszniak A, editor. Emotions, qualia, and consciousness. Singapore: World Scientific; 2001. pp. 124–136. [Google Scholar]
- Platzen D, Magrath RD. Adaptive differences in response to two types of parental alarm call in altricial nestlings. Proceedings of the Royal Society B. 2005;272(1568):1101–1106. doi: 10.1098/rspb.2005.3055. [DOI] [PMC free article] [PubMed] [Google Scholar]
- Ramakrishnan U, Coss RG. Age differences in the response to adult and juvenile alarm calls by bonnet macaques (Macaca radiate) Ethology. 2000;106(2):131–144. [Google Scholar]
- Sales GD. The effect of 22 kHz calls and artificial 38 kHz signals on activity in rats. Behavioural Processes. 1991;24(2):83–93. doi: 10.1016/0376-6357(91)90001-G. [DOI] [PubMed] [Google Scholar]
- Sales G, Pye D. Ultrasonic Communication by Animals. London: Chapman and Hall; 1974. [Google Scholar]
- Sales GD, Smith JC. Comparative studies of the ultrasonic calls of infant murid rodents. Developmental Psychobiology. 1978;11(6):595–619. doi: 10.1002/dev.420110609. [DOI] [PubMed] [Google Scholar]
- Sally SL, Kelly JB. Organization of auditory cortex in the Albino rat: Sound frequency. Journal of Neurophysiology. 1988;59(5):1627–1638. doi: 10.1152/jn.1988.59.5.1627. [DOI] [PubMed] [Google Scholar]
- Sandoz JC, Pham-Delègue MH, Renou M, Wadhams LJ. Asymmetrical generalisation between pheromonal and floral odours in appetitive olfactory conditioning of the honey bee (Apis mellifera L.) Journal of Comparative Physiology A. 2001;187(7):559–568. doi: 10.1007/s003590100228. [DOI] [PubMed] [Google Scholar]
- Seligman MEP. On the generality of the laws of learning. Psychological Reviews. 1970;77(5):406–418. [Google Scholar]
- Seligman MEP. Phobias and preparedness. Behavior Therapy. 1971;2:307–320. [Google Scholar]
- Seligman MEP, Hager JL, editors. Biological boundaries of learning. New York: Appleton-Century-Crofts; 1972. [Google Scholar]
- Sewell GD. Ultrasound in adult rodents. Nature. 1967;215(5100):512. doi: 10.1038/215512a0. [DOI] [PubMed] [Google Scholar]
- Tankhiwale AA, Bang S, Allen TA, Boguszewski PB, Brown TH. Video analysis of unconditional and conditional freezing elicited by rat ultrasonic vocalizations. Pavlovian Society Annual Meeting; Austin, Texas. 2007. [Google Scholar]
- Triesman M. Is signal detection theory fundamentally flawed? A response to Balakrishnan (1998a, 1998b, 1999) Psychonomic Bulletin & Review. 2002;9(4):845–857. doi: 10.3758/bf03196344. [DOI] [PubMed] [Google Scholar]
- White NR, Cagiano R, Moises AU, Barfield RJ. Changes in mating vocalizations over the ejaculatory series in rats (Rattus norvegicus) Journal of Comparative Psychology. 1990;104(3):255–262. doi: 10.1037/0735-7036.104.3.255. [DOI] [PubMed] [Google Scholar]
- Wiley JL, Martin BR. Effects of SR141716A on diazepam substitution for delta9-tetrahydrocannabinol in rat drug discrimination. Pharmacology, Biochemistry, and Behavior. 1999;64(3):519–522. doi: 10.1016/s0091-3057(99)00130-6. [DOI] [PubMed] [Google Scholar]
- Wintink AJ, Brudzynski SM. The related roles of dopamine and glutamate in the initiation of 50-kHz ultrasonic calls in adult rats. Pharmacology, Biochemistry and Behavior. 2001;70(2–3):317–323. doi: 10.1016/s0091-3057(01)00615-3. [DOI] [PubMed] [Google Scholar]
- Wöhr M, Schwarting RKW. Ultrasonic communication in rats: Can playback of 50-kHz calls induce approach behavior? PLoS ONE. 2007;2(12):e1365. doi: 10.1371/journal.pone.0001365. [DOI] [PMC free article] [PubMed] [Google Scholar]
- Zippelius HM, Schleidt WM. Ultraschall-Laute bei jungen Mäusen. Naturwissenschaften. 1956;43(21):502. [Google Scholar]