

Abstract
We have previously shown that the linkage of temperature-dependent protonation and DNA base unstacking equilibria contribute significantly to both the negative enthalpy change (ΔHobs) and the negative heat capacity change (ΔCp,obs) for E. coli SSB homotetramer binding to single stranded (ss) DNA. Using isothermal titration calorimetry we have now examined ΔHobs over a much wider temperature range (5°C to 60°C) and as a function of monovalent salt concentration and type for SSB binding to (dT)70 under solution conditions that favor the fully wrapped (SSB)65 complex (monovalent salt concentration ≥ 0.20 M). Over this wider temperature range we observe a strongly temperature dependent ΔCp,obs. The ΔHobs decreases as temperature increases from 5°C to 35°C (ΔCp,obs <0), but then increase at higher temperatures up to 60°C (ΔCp,obs >0). Both salt concentration and anion type have large effects on ΔHobs and ΔCp,obs. These observations can be explained by a model in which SSB protein can undergo a temperature and salt dependent conformational transition (below 35°C), the midpoint of which shifts to higher temperature (above 35°C) for SSB bound to ssDNA. Anions bind weakly to free SSB, with the preference, Br- > Cl- > F-, and these anions are then released upon binding ssDNA, affecting both ΔHobs and ΔCp,obs. We conclude that the experimentally measured values of ΔCp,obs for SSB binding to ssDNA cannot be explained solely on the basis of changes in accessible surface area (ASA) upon complex formation, but rather result from a series of temperature dependent equilibria (ion binding, protonation and protein conformational changes) that are coupled to the SSB-ssDNA binding equilibrium. This is also likely true for many other protein-nucleic acid interactions.
Obtaining an understanding of the molecular origins for stability and specificity of protein-nucleic acid interactions is a complex problem. Such interactions not only involve multiple networks of hydrogen bonds, salt bridges and non-polar interactions, but are also accompanied by the coupled binding and/or release of small molecules, such as protons, salt ions and water. These coupled binding equilibria will generally contribute significantly to the thermodynamics of protein-nucleic acid binding (ΔG°, ΔH° and ΔS°). For this reason, thermodynamic information obtained under only one set of solution conditions is generally of limited utility for understanding the origins of stability and specificity of any macromolecular interaction, including protein-nucleic acid binding.
We have been studying the thermodynamics of E. coli SSB protein binding to single stranded (ss) nucleic acids (for reviews see (1-3)), a protein that is involved in DNA replication, recombination and repair (4). E.coli SSB protein is a stable homotetramer (4×18,843 Da) (5), that can interact with ssDNA in multiple binding modes, depending on solution conditions and binding density. Two major binding modes have been characterized in vitro, referred to as (SSB)65 and (SSB)35, where the subscript denotes the average number of ssDNA nucleotides occluded by each bound tetramer. The relative stabilities of these two binding modes are sensitive to solution conditions, especially monovalent salt concentration and type (with distinct effects due to both anion and cation type), divalent cations, polyamines, pH and temperature (6-10). High monovalent salt concentrations (>0.2 M NaCl) favor the low cooperativity (SSB)65 mode in which ssDNA interacts with all four subunits and wraps around the tetramer, whereas at lower monovalent salt concentrations (< 20 mM NaCl), the high cooperativity (SSB)35 binding mode is favored in which ssDNA interacts with an average of only two subunits within the tetramer (2, 6, 7, 11-13). Topologies for ssDNA wrapping around the homotetramer in both the (SSB)65 and (SSB)35 binding modes have been suggested based on an x-ray crystal structure of a C-terminal truncation of SSB, (SSBc tetramer) bound to two molecules of (dC)35 (14). The proposed structure of the (SSB)65 complex is shown schematically in Figure 1.
Figure 1.
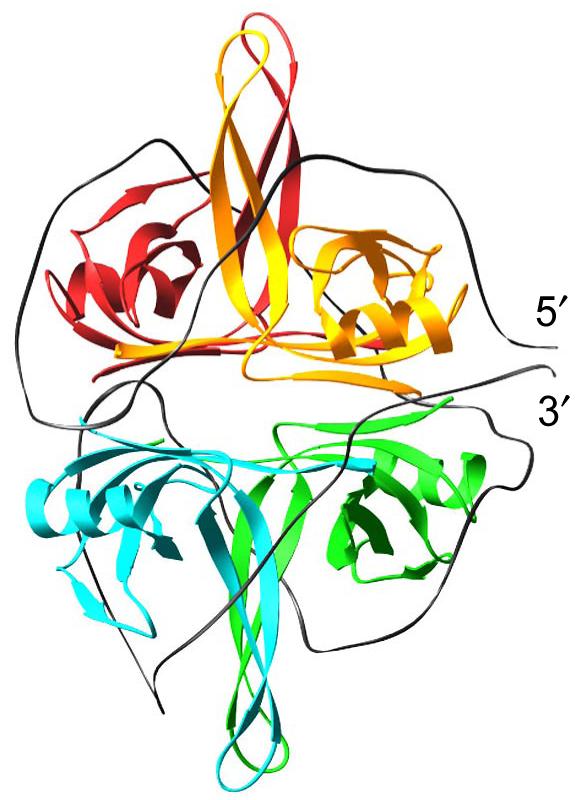
Structural model for an SSB tetramer bound to a ssDNA (gray ribbon) of 70 nucleotides in the fully wrapped (SSB)65 binding mode, based on an x-ray crystallographic structure of the SSBc tetramer bound to two molecules of (dC)35 (14).
We have previously used isothermal titration calorimetry (ITC) to examine the effects of monovalent salt concentration and type, pH and base composition on the enthalpy change (ΔHobs) for SSB binding to oligodeoxynucleotides (15-17). SSB binding to ssDNA is accompanied by a large and negative ΔHobs (as large as ∼ -150 kcal/mol for binding to (dT)70 at < 10 mM monovalent salt concentration) as well as a large and negative ΔCp,obs (16, 17). The molecular basis for a negative ΔCp,obs in macromolecular interactions has been the subject of much interest and discussion (16-26) and several origins have been proposed: (1)- net burial of nonpolar surfaces upon complexation (hydrophobic effect) (18, 20-22), (2) - changes in the vibrational modes of the macromolecules and participating water (18, 23, 26), and (3)- thermodynamic coupling of one or more binding or conformational equilibria to the main binding reaction of interest (16-19, 27, 28).
Our studies of E. coli SSB binding to ssDNA have shown that temperature dependent coupled equilibria contribute significantly to the observed ΔHobs as well as ΔCp,obs. For example, the ΔCp,obs for SSB binding to oligodeoxyadenylates ((dA)N) is approximately two-fold larger in magnitude than for binding to oligodeoxycytidylates ((dC)N) or oligodeoxythymidylates ((dT)N) (16). This effect results primarily from the fact that the bases within the ssDNA are relatively unstacked within an SSB-ssDNA complex, yet the bases within free (dA)N have a higher propensity to stack upon each other than do the bases within (dC)N and (dT)N. Disruption of these temperature dependent stacking interactions upon binding of (dA)N to SSB contributes to ΔHobs in a temperature dependent manner resulting in contributions to ΔCp,obs, whereas such contributions are insignificant for binding of (dC)N or (dT)N. Another significant contribution to ΔCp,obs originates from the linkage of SSB protonation reactions that accompany formation of the SSB-ssDNA complex (16, 17, 29). For oligo(dT)-SSB interactions this effect was estimated to contribute half of the measured ΔCp,obs (17).
Other contributions to ΔCp,obs for the SSB-ssDNA interaction might potentially result from coupled interactions of salt ions with the protein and/or DNA or temperature dependent conformational transitions within the protein. We have shown previously that there is a dramatic effect of monovalent salt concentration and anion type on ΔHobs for SSB-(dT)70 binding at constant temperature (25°C) (15). These effects were ascribed to weak binding of anions to the protein. We now report an investigation of the effects of monovalent salt concentration and type on the temperature dependences of ΔHobs for SSB-ssDNA binding at salt concentrations ≥0.20 M, where the protein binds in the fully wrapped (SSB)65 binding mode. These studies were performed over a much wider temperature range (5°C to 60°C) than were previous studies and demonstrate a significant temperature dependent ΔCp,obs that is influenced substantially by anion dependent effects.
MATERIALS AND METHODS
Reagents and Buffers
All solutions were prepared with reagent grade chemicals and glass distilled water that was subsequently treated with a Milli Q (Millipore, Bedford, MA) water purification system. Buffer T is Tris (tris(hydroxymethyl) aminomethane), buffer H is Hepes (4-(hydroxyethyl)-1-piperazineethanesulfonic acid) and buffer B is Bicine (N,N bis[2-Hydroxyethyl]glycine). All buffer concentrations were 10 mM and contained 0.1 mM Na3EDTA (ethylenediaminetetraacetic acid). The concentrations of NaF, NaCl and NaBr in each buffer are specified in the text. For buffers used at low temperatures (5-35°C) the pH was adjusted to 8.1 at 25°C by titrating with 5 M NaOH (Hepes, Bicine) or 5 M HCl (Tris). Since the pKa and ΔHion of the buffers are dependent on temperature, the final pH of the solution and ΔHion of the buffers were calculated for each particular experimental temperature, T, as described (17, 30) using the following reference values (25°C): pKa = 7.45 ; ΔHion=5.02 kcal/mol and ΔCp,ion=12 cal/mol K (Hepes); pKa = 8.22; ΔHion= 6.47 kcal/mol and ΔCp,ion= - 0.5 cal/mol K (Bicine) (30) and pKa = 8.06; ΔHion=11.34 kcal/mol and ΔCp,ion= -17 cal/mol K (Tris) (31). For experiments at low temperatures (5-35°C), the resulting pH of the buffers varied over this temperature range from 8.7 to 7.8 for Tris and 8.4 to 8.0 for Hepes, respectively. For the buffers used at high temperatures (40-60°C) the pH was adjusted at 25°C by titrating with 5 M NaOH (Hepes, Bicine) or 5 M HCl (Tris) so that the resulting pH at 50°C would be 8.1. The resulting pH of the buffers at high temperatures (40-60°C) varied over this temperature range from 8.3 to 7.9 for Tris and 8.2 to 8.0 for Bicine, respectively. For the experiments shown in Figure 2D that were performed at low temperatures (5-35°C) in Hepes as a function of pH (buffers were prepared at 25°C having pH values of 6.5, 7.0, 7.5 and 8.4), the variation with temperature never exceeded 0.3 pH relative to the indicated pH at 25°C. The error in calculating the pH for a particular experiment is within ±0.1 pH unit as estimated based on direct measurements of the pH of the buffer at several temperatures.
Figure 2.
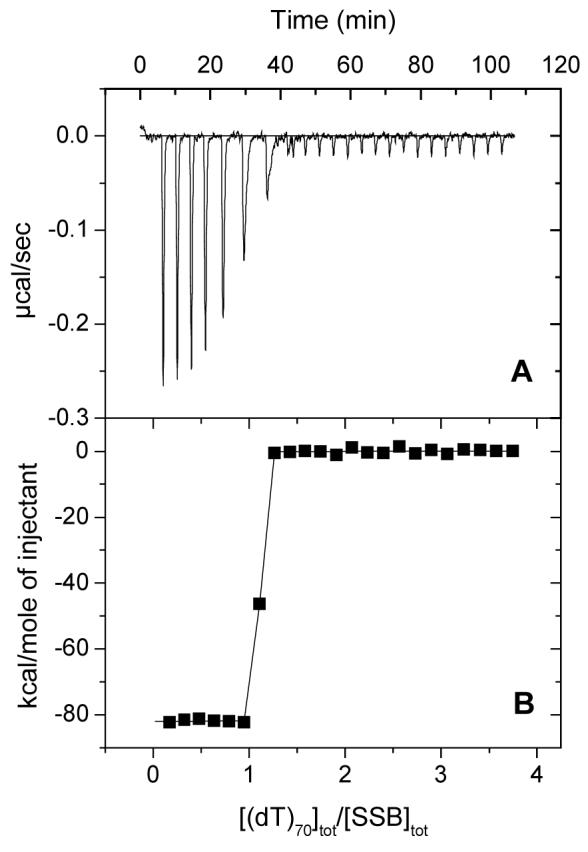
Results of a typical ITC titration of SSB with (dT)70. A: Raw titration data, plotted as heat signal (microcalories per second) versus time (minutes), obtained for 23 injections (8 μl each) of (dT)70 (12.2 μM) into a solution containing SSB protein (0.45μM tetramer) (Tris buffer (pH 8.24), 2M NaCl, 20°C). B: Integrated heat responses per injection from A, normalized to the moles of injected ligand ((dT)70), after subtraction of the heats of dilution obtained from a blank titration of (dT)70 into buffer. The continuous curve shows the best fit of the data to a 1:1 binding model with n=1.03±0.01, ΔH=- 81.93±0.80 kcal/mol. The affinity of (dT)70 is too high to measure under these conditions. A minimum estimate of K=9×10¹⁰ M-1 was used for the simulation in B.
E. coli SSB Protein and Nucleic Acids
SSB protein was purified as described (32) with the addition of a double stranded DNA cellulose column to remove a minor exonuclease contaminant (33). SSB protein concentration was determined spectrophotometrically in buffer T plus 0.20 M NaCl using the extinction coefficient, ∈280=1.13×10⁵ M-1 (tetramer) cm-1 (6). The SSB tetramer is stable at all protein concentrations, NaCl, NaBr and NaF concentrations (15, 27, 34) and temperatures up to 58°C (partial unfolding of the protein at higher temperatures is discussed in the text). The oligodeoxynucleotide, (dT)70, was synthesized and purified as described (13) and was ≥98% pure as judged by denaturing gel electrophoresis and autoradiography of a sample that was 5′ end-labeled with 32P using polynucleotide kinase. Concentrations of (dT)70 were determined spectrophotometrically in buffer T (pH 8.1), 0.1M NaCl using the extinction coefficient, ε260=8.1×10³ M-1 (nucleotide) cm-1 (35). All SSB and (dT)70 samples were dialyzed extensively against the identical buffer at the indicated salt concentration that was used in each ITC experiment.
Isothermal Titration Calorimetry (ITC)
ITC experiments were performed using both an OMEGA titration microcalorimeter and VP-ITC titration microcalorimeter (MicroCal Inc., Northhampton, MA) (36). For the SSB-(dT)70 interaction we have shown previously that ΔHobs is independent of protein and DNA concentrations and the order of titration (15, 37). Generally, experiments were carried out by titrating SSB solutions (0.25-1.2 μM tetramer) with oligodeoxynucleotide (generally stock concentrations ranging from 5-30 μM). Lower concentrations of SSB protein (0.25-0.5 μM tetramer) had to be used in experiments in buffers containing NaF due to the lowered solubility of SSB protein with increasing [NaF]. The heats of dilution obtained from reference titrations of DNA into buffer were independent of DNA concentration at all salt conditions and temperatures. All corrections for heats of dilution were applied as described previously (15).
The equilibrium binding constant of SSB tetramer for (dT)70 is too high to be measured accurately by ITC under most of the solution conditions used in our studies. Only stoichiometric binding (1 tetramer per (dT)70) is observed at all [NaCl] studied (0.2 - 2.0 M) and at [NaBr] < 1 M. Therefore, under these conditions only ΔHobs can be measured accurately as described (15, 37). At [NaBr]> 1 M the equilibrium association constant (Kobs) for SSB binding to (dT)70 is lowered into a range that can be measured accurately. Values of ΔHobs and Kobs (where it was possible to measure) for SSB binding to (dT)70 were obtained by fitting the experimental binding isotherm to a 1:1 interaction model as described (15). Non-linear least squares fitting of the data was performed using the “ITC Data Analysis in Origin” software provided by the manufacturer. Fitting of the data and simulations were performed using the scheme in Fig. 7 and eqs 5 (Appendix I) using the nonlinear regression package in Scientist (MicroMath Scientific Software, Salt Lake City, UT). All uncertainties reported are at the 68% confidence level (one standard deviation). All experimental values of ΔH’obs (see below) shown in Fig. 3 and Fig. 6A and B are available online through the Binding Database (http://www.bindingdb.org/bind/index.jsp).
Figure 7.
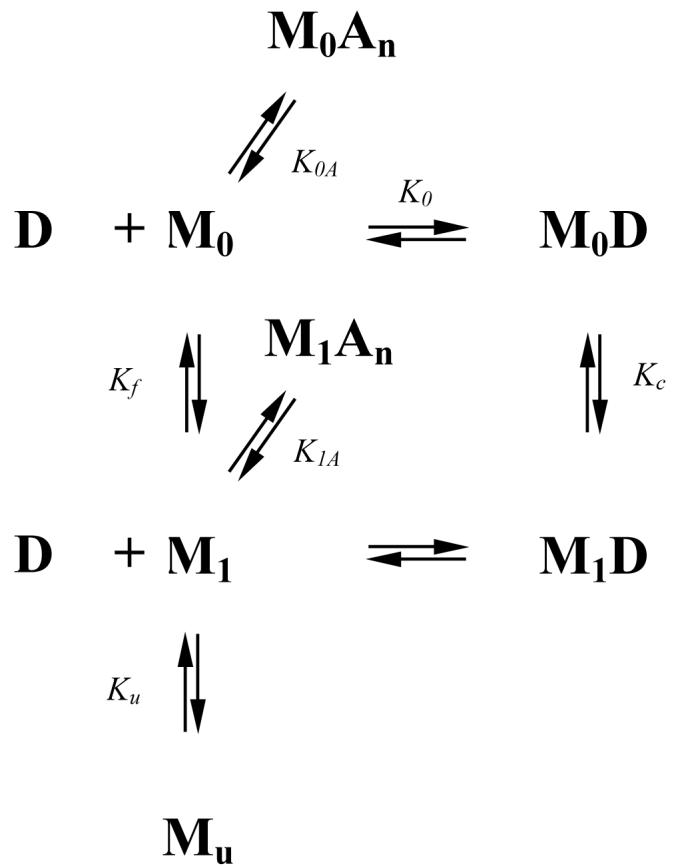
Thermodynamic model for the binding of SSB (M) to (dT)70 (D). This model proposes that the free SSB protein exists in two conformational states, M0 and M1, both of which can bind to D to form M0D and M1D, respectively. Both forms of the free protein (M0 and M1) have n independent and identical sites for binding of monovalent anions, A. The free protein can also undergo an unfolding transition to form Mu.
Figure 3.

Dependences of ΔH’obs on temperature obtained in Tris and Hepes buffers at low temperatures (5 to 35°C) at varying salt concentrations, types of anion and pH. A: Data obtained in 0.20 M, 1.0 M, 1.4 M and 2.0 M NaCl in Hepes buffer (closed circles) and in 0.20 M and 2.0 M NaCl in Tris buffer (open circles). B: Data obtained in 0.20 M, 1.0 M and 2.0 M NaCl in Hepes buffer (closed squares) and in 0.20 M and 2.0 M NaCl in Tris buffer (open squares). C: Data obtained in 0.20 M NaF (triangles), NaCl (circles) and NaBr (squares) in Hepes (closed symbols) and Tris (open symbols). Smooth lines represent linear least squares fits through the data points over the temperature range from 5 to 25°C. Corresponding values of ΔC’p,obs calculated from the slopes are presented in Table 2. D: Data obtained in 0.20 M NaBr in Hepes buffer with pH 8.43 (△), 8.1 (■), 7.46 (○), 6.95 (▲) and 6.48 (◇) at 25°C. Smooth lines are arbitrarily drawn through the data points.
Figure 6.

Temperature dependences of ΔHobs for SSB-(dT)70 binding in 0.2 M salts. The dependences of ΔH’obs on temperature (not corrected for buffer ionization and protonation effects) obtained in (A)- 0.20 M NaCl and (B)- 0.20 M NaF. Data are shown for: Tris (pH 8.1, 25°C) - dark yellow symbols and Tris (pH 8.1, 50°C) - orange symbols; Hepes (pH 8.1, 25°C) - purple symbols and Bicine (pH 8.1, 50°C) - light blue symbols. (C) - Dependences of ΔHobs,corr on temperature after corrections for contributions due to buffer ionization and protonation, according to eq 3 and the parameters presented in Table 1 (first column) for 0.20 M NaF (triangles), 0.20 M NaCl (circles) and 0.20 M NaBr (squares).
Corrections for Contributions to ΔH’obs due to Proton Release from the Buffer and Protonation which Accompanies Formation of the SSB-(dT)70 Complex
As in our previous studies (16, 17) we use a “prime” (ΔH’obs) to designate experimental values of ΔHobs determined in a particular buffer, which include contributions from the heat of ionization of the buffer due to the linked protonation reactions that accompany (dT)70 binding to the SSB tetramer. Values of ΔHobs without a prime have been corrected for contributions due to the ionization of the buffer as indicated in eq 1.
| (1) |
where ΔnH+ is the number of protons released (positive value) or absorbed (negative value) by the buffer as a result of binding or release, respectively, of protons upon DNA - protein complexation (38). Using eq 1 it is possible, in a model-independent manner, to estimate the values of ΔHobs and ΔnH+ at any pH by performing a series of experiments in buffers which differ in their ionization enthalpies (ΔHion). A plot of ΔH’obs vs. ΔHion yields a straight line with slope equal to ΔnH+ and intercept equal to ΔHobs. However, ΔHobs in eq 1 still includes any contributions from the heats of protonation of ionizable groups on the protein or DNA, as indicated in eq 2.
| (2) |
Where, ΔHobs,corr is the observed enthalpy change for SSB-ssDNA binding and ΔHapp,prot is the related enthalpic contribution due to protonation of the ionizable group (or groups) on the protein or DNA upon complex formation. Note that ΔHapp,prot in eq 2 is a function of pH and temperature and cannot be determined in a model independent manner.
For the corrections due to buffer ionization (ΔnH+ΔHion in eq 1) and coupled protonation reactions (ΔHapp,prot in eq 2), we used the protonation model described in previous studies of 1:1 binding of SSB to (dT)35, in which (dT)35 interacts with an average of only two subunits of the SSB tetramer (17). It was established that a net protonation of SSB occurs upon (dT)35 binding over a broad pH range (5.0-10.0), with contributions from at least three sets of protonation sites with pKa1=5.9-6.6, pKa2=8.2-8.4, and pKa3=10.2-10.3 at 25°C (pKai values for the first set decrease slightly and for the second and third sets increase with increasing [NaCl] from 0.02 M to 1.0 M). The number of protonation sites (ni), pKai and ΔHi values for each set (i=1,2,3) have been determined at the reference temperature of 25°C based on global fitting of the experimental values of ΔH’obs obtained in different buffers varying in pH and temperature (17). The second and the third sets of protonation sites appear to correspond to the N terminal α-amino group and four lysine residues of each SSB subunit interacting with (dT)35. We have been unable to identify the amino acids involved in the first set of protonation sites (pKa1=5.9-6.6), although based on their low protonation enthalpy (-0.4 to -1.8 kcal/mol) these might be carboxylate groups of glutamic and/or aspartic acids, with a higher than expected pKa resulting from complexation with (dT)35.
In the present study we show that the same model can adequately describe the protonation effects for the formation of the 1:1 molar complex of SSB tetramer bound to (dT)70, if we account for the fact that the longer (dT)70 interacts with all four SSB subunits (6, 14, 39, 40) (see Results section). Therefore, by simply multiplying the number of protonation sites for each set (ni) by a factor of two, while maintaining the values of the remaining parameters (pKai and ΔHi) the same as for the SSB-(dT)35 interaction, we can calculate for any buffer and condition, the contributions to ΔH’obs due to buffer ionization and coupled protonation reactions. The value of the enthalpy change corrected for these effects (ΔHobs,corr) can be calculated by combining eqs 1 and 2 and is given in eq 3.
| (3) |
Where
| (3a) |
| (3b) |
| (3c) |
Eq 3a was used for calculations of ΔHion for a particular buffer at the indicated temperature using the reference values of ΔHion,ref (25°C) and ΔCp,ion reported above (see Reagents and Buffers). In eqs 3b and 3c [H+]=10-pH is the concentration (activity) of protons in solution; ni is the number of protonation sites for each particular set (i=1,2,3); Kf,i ΔHf,i and Kc,i, ΔHc,i are the association constants and enthalpy changes for protonation of the corresponding set of sites on free (f) and (dT)70-bound (c) SSB protein. The dependence of the protonation constant on temperature was calculated according to eq 3d, neglecting the temperature dependence of ΔHi.
| (3d) |
Where Ki,ref is the value of the constant at 25°C. Details of the protonation model along with derivations of the equations presented above have been presented (17).
The parameters used to correct the values of ΔH’obs to obtain ΔHobs are presented in Table 1 and were adapted from our studies of the SSB-(dT)35 (17). We used the parameters determined in 0.20 M NaCl to correct all values of ΔH’obs obtained at 0.20 M monovalent salt independent of monovalent salt type (NaCl, NaBr, NaF) and the parameters determined in 1.0 M NaCl to correct the values of ΔH’obs obtained at salt concentrations ≥1.0 M for data in both NaCl and NaBr. Although little difference was observed (within our uncertainties) between the parameters determined at 0.2 M and 1.0 M NaCl, we used the exact values for consistency. We made one change in the value of ΔHc,1, which was averaged to -1 kcal/mol. In addition, since in the original study (17) no parameters were determined for the third set of protonation sites at 1.0 M NaCl due to difficulties in the determination of ΔH’obs at high pH, we used the parameters obtained in 0.20 M NaCl for these high salt calculations, using ΔHf,3 = -10 kcal/mol, as expected for the protonation of lysine (41, 42). Finally, we note that the contribution to the overall protonation effects from the second set of protonation sites always dominates under the conditions used in the experiments reported here, whereas the contribution from the first and the third set of sites is smaller, not exceeding 10%.
Table 1.
Parameters Used for Correction of the Observed Enthalpy Changes (ΔH’obs) for (dT)70 Binding to SSB due to Contributions from Buffer Ionization and Linked Protonation reactions. Adapted from (17)
| [salt] = 0.2M | [salt] ≥ 1M | |
|---|---|---|
| n1 | 6 | 6 |
| pKc,1 | 6.2 | 5.9 |
| ΔHc,1, kcal/mol | -1 | -1 |
| n2 | 4 | 4 |
| pKf,2 | 8.3 | 8.4 |
| ΔHf,2, kcal/mol | -11 | -10.3 |
| n3 | 16 | 16 |
| pKf,3 | 10.2 | 10.2 |
| ΔHf,3, kcal/mol | -10 | -10 |
RESULTS
Temperature dependence of ΔH’obs for SSB-(dT)70 binding at low temperature (5-35°C) is influenced by pH, monovalent salt concentration and anion type
Fluorescence (27, 43) and ITC (15) studies show that at monovalent salt concentrations ≥ 0.20 M, an SSB tetramer binds one molecule of (dT)70 in the (SSB)65 binding mode such that ssDNA wraps around all four subunits (see Fig. 1) (14, 44). At 25°C, the binding interaction is characterized by a very large and negative enthalpy change (ΔH’obs) that is dependent on monovalent salt concentration and anion type (15). Under the same conditions, an SSB tetramer can bind two molecules of (dT)35, each interacting with two subunits, although with a salt dependent negative cooperativity (15, 39, 40). ITC studies of (dT)35 binding to SSB tetramers show that binding of the first (dT)35 molecule is stoichiometric (the binding constant is too high to measure) and is characterized by large negative values of ΔHobs and ΔCp,obs (5-35°C), with contributions from coupled protonation (16, 17).
Here we examine, using ITC, the effects of pH and monovalent salt concentration and type on the enthalpy and heat capacity change for SSB tetramer binding to (dT)70 in its (SSB)65 binding mode ([salt]≥0.2M) over a broad temperature range from 5 to 62.5°C in Tris, Hepes and Bicine buffers and as a function of [NaBr], [NaCl] and [NaF]. The first series of titrations of SSB with (dT)70 was performed over the temperature range from 5-35°C as a function of monovalent salt concentration and type and pH in Hepes and Tris buffers. Under all conditions the binding stoichiometry is one mol SSB tetramer/mol (dT)70, although the binding constant is too high to measure accurately (except at [NaBr] ≥ 1.0 M, T≥25°C) (a typical isotherm is shown in Fig. 2 for 2.0 M NaCl,Tris, pH 8.2, 20°C). Therefore, only values of ΔH’obs can be determined accurately.
Temperature dependences of ΔH’obs obtained in Tris and Hepes buffer as a function of salt concentration ([NaCl]=0.2; 1.0; 1.4; 2 M and [NaBr]=0.2; 1.0; 2.0 M) are shown in Fig. 3A and 3B, respectively. All values of ΔH’obs decrease linearly in the range from 5-25°C, indicating that the observed heat capacity change (ΔC’p,obs) is negative and fairly constant. However, as the temperature increases above 25°C a deviation from linearity becomes obvious indicating that ΔC’p,obs decreases in magnitude.
The effect of NaBr and NaCl concentraton on the magnitude of ΔH’obs is clearly observable at all temperatures examined. Less negative values of ΔH’obs are observed in both Tris and Hepes buffers as the salt concentration increases (on average the shift upon changing from 0.20 M to 2.0 M is approximately 40-45 kcal/mol and 45-48 kcal/mol in NaBr and NaCl, respectively). On the other hand, the effect of salt concentration on ΔC’p,obs is more complicated. In fact, upon increasing [NaCl] form 0.20 M to 2.0 M, ΔC’p,obs decreases slightly from -0.83±0.08 to -1.07±0.03 kcal/mol°K in Tris buffer and from - 0.94±0.05 to -1.08±0.09 kcal/mol°K in Hepes buffer (see Table 2, columns 5 and 6, respectively). However, this trend is reversed in NaBr, such that ΔC’p,obs increases slightly with increasing [NaBr] from -1.03±0.03 to -0.89±0.11 kcal/mol°K in Tris buffer and from -1.14±0.11 to -0.82±0.09 kcal/mol°K in Hepes over the same salt concentration range (Table 2, columns 8 and 9).
Table 2.
Heat Capacity Changes for SSB-(dT)70 Binding Obtained from Linear Least Squares Analyses of the Data at Low Temperature (5-25°C) as a Function of Salt Concentration and Type in Tris and Hepes Buffers and after Corrections for Buffer Ionization and Protonation Effects
| NaF | NaCl | NaBr | |||||||
|---|---|---|---|---|---|---|---|---|---|
| SALT CONC. | ΔCp,Tris kcal mol-1 °K-1 | ΔCp,Hepes kcal mol-1 °K-1 | ΔCp,corr kcal mol-1 °K-1 | ΔCp,Tris kcal mol-1 °K-1 | ΔCp,Hepes kcal mol-1 °K-1 | ΔCp,corr kcal mol-1 °K-1 | ΔCp,Tris kcal mol-1 °K-1 | ΔCp,Hepes kcal mol-1 °K-1 | ΔCp,corr kcal mol-1 °K-1 |
| 0.2 M | -0.67±0.11 | -0.81±0.06 | -0.64±0.05 | -0.83±0.08 | -0.94±0.05 | -0.82±0.05 | -1.03±0.03 | -1.14±0.11 | -1.01±0.05 |
| 1.0 M | - | - | - | - | -1.00±0.15 | -0.87±0.11 - | - | -1.10±0.03 | -0.93±0.04 |
| 1.4 M | - | - | - | -0.94±0.15 | -1.01±0.15 | -0.97±0.13 | - | - | - |
| 2.0 M | - | - | - | -1.07±0.03 | -1.08±0.09 | -0.99±0.05 | -0.89±0.11 | -0.82±0.09 | -0.82±0.10 |
The data in Fig. 3A and 3B show a clear effect of anion type on both ΔH’obs and ΔC’p,obs. At the same salt concentrations, the values of ΔH’obs obtained in NaBr are less negative by approximately 6-13 kcal/mol than the values in NaCl. Likewise, except for the data at 2.0 M salt, the magnitude of ΔC’p,obs increase slightly upon switching from NaCl to NaBr (see Table 2). The most pronounced effect of anion type is observed at 0.20 M monovalent salt (see Fig. 3C and Table 2). The overall decrease in the magnitude of ΔH’obs ranges from 23-32 kcal/mol upon replacing F- with Cl- and then Br-, with a concomitant increase in the magnitude of ΔC’p,obs. The corresponding values of ΔC’p,obs decrease from - 0.67±0.11 to -1.03±0.05 kcal/mol°K in Tris and from -0.81±0.06 to -1.14±0.11 kcal/mol°K in Hepes (see Table 2, line 3).
The data in Fig. 3A, B and C indicate that the values of ΔH’obs and ΔC’p,obs are also dependent on the nature of the buffer (see also Table 2). Both ΔH’obs and ΔC’p,obs determined in Hepes are larger in magnitude and more negative than those determined in Tris in agreement with our previous studies of SSB binding to (dT)35 (17) and suggest that significant protonation accompanies formation of the SSB-(dT)70 complex. Further support for this conclusion comes from experiments performed in Hepes buffer at 0.20 M NaBr with the pH varying from 6.48 to 8.43 (see Fig. 3D), which show that both ΔH’obs and ΔC’p,obs increase in magnitude as the pH increases.
Correction of ΔH’obs for SSB-(dT)70 binding due to contributions from buffer ionization and protonation effects
The values of ΔH’obs presented in Fig. 3 were corrected for contributions from buffer ionization and protonation of SSB using eq 3 and the parameters listed in Table 1 ([salt]=0.20 M and [salt]≥1.0 M) (17). As discussed in Materials and Methods, we have extended the model presented previously (17) describing protonation of a 1:1 SSB-(dT)35 complex, in which (dT)35 interacts with an average of only two SSB subunits and apply it to describe the protonation accompanying formation of a 1:1 SSB-(dT)70 complex in which (dT)70 interacts with all four SSB subunits. We assume that each SSB subunit contains identical sets of protonation sites that contribute equally to the SSB-ssDNA interaction and thus simply multiply by two the number of protonation sites determined in our studies of the SSB-(dT)35 interaction. This assumption seems appropriate based on the following experimental observations. First, the binding of a second (dT)35 molecule to the SSB tetramer is characterized by the same protonation effects as the binding of the first (dT)35. Second, the overall protonation effect for the binding of two (dT)35 molecules to the SSB tetramer is identical to the effect of binding one (dT)70 molecule.
We determined the number of protons absorbed upon binding of the first (Δn1,H+) and the second (Δn2,H+) molecule of (dT)35 to the SSB tetramer using two approaches. In the first model-independent approach we measured values of ΔH’obs,1 using ITC for (dT)35-SSB binding in 1.0 M NaCl over a broad pH range at 25°C (some of these data are from (17)). Values of ΔH’obs,1 were measured at constant pH, using a series of buffers differing in ΔHion. In these experiments, we can only determine ΔH’obs,1 (not Kobs) for the binding of the first (dT)35 molecule, since binding is stoichiometric under most of the conditions examined. Analysis of the dependence of ΔH’obs,1 on ΔHion according to eq 1 for experiments performed at several pH values yields the dependence of Δn1,H+ on pH, which is shown as the open squares in Fig. 4A. In the second, approach, we used eq 3b and the model-dependent parameters obtained from a global fit of the pH dependence of ΔH’obs,1 published previously (17). The predicted values of Δn1,H+ and their dependence on pH is shown as a dashed line in Figure 3A. This comparison shows that the model-dependent and model-independent values agree very well.
Figure 4.
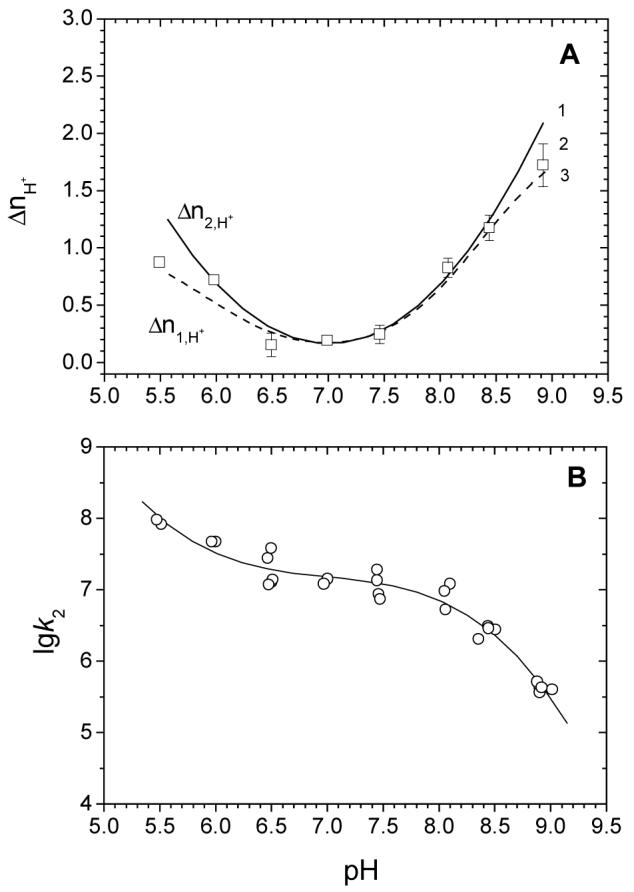
Protonation effects are the same for the binding of the first and second molecules of (dT)35 to the SSB tetramer (1.0 M NaCl, 25°C).
A: (1) (solid line) - number of protons absorbed upon binding of the second molecule of (dT)35 with SSB as a function of pH, calculated based on the dependence shown in panel B; (2) (open squares) - number of protons absorbed upon binding of the first molecule of (dT)35 to SSB as a function of pH, calculated in a model independent manner (from (17)); and (3) (dashed line) number of protons absorbed upon binding of the first molecule of (dT)35 to SSB as a function of pH calculated according to eq 3b (using parameters from (17)).
B: Logarithmic dependence of microscopic binding constant k2 on pH for the binding of the second molecule of (dT)35 to the SSB tetramer. The smooth line shows a polynomial approximation of the data. The slope to the curve at each point reflects Δn2H+ = -dlogk2/dpH.
Unfortunately, construction of the dependence of Δn2,H+ on pH for the binding of the second (dT)35 molecule using the first approach is not possible since ΔH’obs,2 cannot be determined with sufficient accuracy. However, we can use the second approach to calculate the dependence of Δn2,H+ on pH from the pH dependence of the microscopic binding constant, k2, which is readily measurable over the pH range examined. These values of k2 are plotted as a function of pH in Fig. 4B, with a polynomial function describing the data shown as a smooth curve. The values of k2 decrease with increasing pH indicating that protons are absorbed upon (dT)35 binding to SSB over the entire pH range. Since the absolute value of the slope of the curve at a specified pH defines the average number of protons absorbed upon binding of the second molecule of (dT)35 to SSB (i.e., dlogk2/dpH= - Δn2H+), we can obtain the dependence of Δn2H+ on pH for binding of the second (dT)35 molecule by estimating the slope as a function of pH using the smooth curve (line 1) in Fig. 4A. Clearly, the dependences of Δn1H+ and Δn2H+ on pH agree very well, except at the extremes of the pH range where the uncertainties from the second method are significantly higher.
According to Fig 4A, the binding of two (dT)35 molecules to the SSB tetramer at pH 8.1 is accompanied by absorption of approximately 0.8×2=1.6 protons. For the same conditions (1M NaCl, pH 8.1), model independent analyses of ΔH’obs obtained in Tris and Hepes buffers for (dT)70-SSB binding using eq 1, indicates ΔnH+=1.60±0.22 (see Table 3). Similar estimates based on the data obtained in Tris and Hepes buffers (25°C, pH 8.1) at different concentrations of NaF, NaCl and NaBr are presented in Table 3. The values of ΔnH+ are in the range of 1.2-1.8 and are in good agreement with the values of 1.75 and 1.50 calculated according to eq 3b based on the parameters from Table 1. Thus the binding of each (dT)35 molecule appears to be accompanied by protonation of identical sites on each SSB subunit. Thus, our use of the parameters in Table 1 to describe the protonation effects for SSB binding to (dT)70 seems justified.
Table 3.
Experimental and Predicted Values for the Number of Protons (ΔnH+) Absorbed upon SSB-(dT)70 Complex Formation (pH 8.1)
SSB-(dT)70 binding at low temperatures (5-35°C) in NaF, NaCl and NaBr displays a negative ΔCp,obs
The values of ΔHobs,corr (ΔH’obs from Figure 3 after correction for buffer ionization and protonation effects using eqs 3) are shown in Fig. 5. These values of ΔHobs,corr are independent of pH (and represent the values for the hypothetical binding of (dT)70 to SSB, where the second and third set of sites are protonated near pH 7 (17)). As such, these values of ΔHobs,corr depend only on temperature and salt concentration and type, regardless of whether they were obtained in Tris or Hepes buffers or at a different pH.
Figure 5.

Dependences of ΔHobs,corr on temperature for SSB-(dT)70 binding in different salts at low temperatures (5-35°C) after correction for buffer ionization and protonation effects. Corrected data shown in panels A, B and C correspond to the data presented in Fig. 3 A, B and C, respectively. Data shown in panel C for 0.20 M NaBr (upper curve) represents a combination of all data obtained in 0.20 M NaBr (see Fig. 3C and D). Smooth lines are linear least square fits through all data over the temperature range from 5 to 25°C. The ΔCp,corr values calculated from the slopes are reported in Table 2.
The data in Fig. 5 show a significant decrease in the magnitude of ΔHobs,corr (≈40-45 kcal/mol) as the salt concentration increases from 0.20 to 2.0 M (Fig. 5A and B). The magnitude of ΔHobs,corr also changes with monovalent anion type. The overall drop in magnitude of ΔHobs,corr is approximately 26-28 kcal/mol in proceeding from NaF to NaCl to NaBr (Fig. 5C). At the same time the values of ΔCp,corr (estimated from the slopes of the plots) are all negative, but increase in magnitude following the same anion series with values of -(0.64 ± 0.05), -(0.82 ± 0.05) and -(1.01 ± 0.05) cal/mol°K, in NaF, NaCl and NaBr, respectively (see Table 2). The data in Table 2 also indicate that [NaCl] and [NaBr] have opposite effects on ΔCp,corr over the range from 0.20 - 2.0 M, with ΔCp,corr decreasing slightly from -(0.82 ± 0.05) to -(0.99 ± 0.05) cal/mol°K in NaCl, but increasing from -(1.01 ± 0.05) to -(0.82 ± 0.10) cal/mol°K in NaBr.
Close inspection of the data shown in Fig. 5 reveals that nearly all of the data begin to deviate from a linear dependence on temperature above 30°C, such that ΔCp,corr decreases in magnitude, becoming less negative. Since such nonlinear behavior is not the result of linked protonation reactions, it must result from other processes, such as temperature-dependent conformational transitions within the protein or the DNA, which are linked to binding and therefore contribute to ΔHobs in a temperature dependent manner (16, 19, 38). To investigate this possibility we extended our studies to higher temperatures.
SSB-(dT)70 binding at high temperatures (35-60°C) displays a positive ΔCp,obs
A series of calorimetric titrations of SSB with (dT)70 was performed at 0.20 M NaF, NaCl and NaBr in the temperature range from 30°C to 62.5°C in Bicine and Tris buffers (pH 8.1 at 50°C). At temperatures below 60°C, the SSB tetramer is stable based on DSC data obtained under similar conditions (unpublished data). However, these data show a noticeable increase in partial molar heat capacity at temperatures above 60°C reflecting the onset of partial SSB unfolding. The unfolding transition occurs between 65 and 73°C, showing a sharp asymmetric peak with a maximum at 70-71°C. The unfolding is irreversible and results in aggregation of the protein, although reversibility is observed if the temperature does not exceed 65°C.
In our SSB-(dT)70 binding experiments we examined temperatures up to 62.5°C. Any loss of active protein due to unfolding and/or aggregation would be reflected in a decrease in the apparent binding stoichiometry for the SSB-(dT)70 interaction. At low temperatures, we consistently observe a stoichiometry of 1.00 ± 0.04. However, this value decreases ∼10% for experiments performed in NaCl at 62.5°C and ∼10-20% in NaF at T ≥ 55°C, reflecting the possible loss of a corresponding fraction of the protein due to unfolding and/or aggregation. In fact, for the ITC experiments performed in NaF (T≥55°C), the stability of the observed signal decreases somewhat, possibly due to the presence of some amount of aggregated protein in the calorimetric cell. As a result, the values of ΔH’obs determined from these data have larger uncertainties (see Fig. 6B)
As with the ITC experiments at low temperature, those performed at higher temperatures show stoichiometric binding under most conditions indicating that the equilibrium binding constant is too high to be determined accurately. Reliable estimates of the binding constant can only be made in 0.20 M NaBr at T≥55°C or in 0.20 M NaCl at T≥60°C. This is consistent with previous studies showing that the affinity of SSB for poly(U) (29, 37) increases upon changing the anion from Br- to Cl- to F-.
The data obtained at higher temperatures in Tris and Bicine buffers along with the data for lower temperatures in Tris and Hepes buffers are shown in Fig. 6A and B for titrations performed in 0.20 M NaCl and 0.20 M NaF, respectively. At T > 40°C, ΔH’obs increases (becomes less negative) with increasing temperature indicating that ΔC’p,obs > 0. As the temperature exceeds 58°C an abrupt change to a more negative ΔH’obs is observed, suggesting that the free SSB protein begins to unfold, but refolds upon binding DNA, which makes an exothermic contribution to the observed enthalpy change.
As at lower temperatures, significant protonation accompanies SSB-(dT)70 binding as judged from the shift in ΔH’obs at each temperature for experiments performed in Tris vs. Bicine buffers (Fig. 6A and B). The number of protons absorbed upon complex formation can be calculated at 50°C (pH 8.1) in a model independent manner using eq 1, yielding 3.41±0.32 and 3.24± 0.32 in NaCl and NaF, respectively. These are at least two fold higher than the values determined in the same manner at 25°C at the same pH of 8.1 (see Table 3). This is due to the fact that a larger fraction of protons dissociates from the free protein at the elevated temperatures and these must be absorbed upon SSB binding to the ssDNA. A model dependent value of ΔnH+ = 3.43 can be calculated using eq 3 at 50°C (pH 8.1), in good agreement with the model independent values. This indicates that we can use the same model and parameters (Table 1) at these higher temperatures to correct ΔH’obs for contributions from buffer ionization and protonation as we used to correct the data at lower temperatures. Indeed, after applying these corrections to the data obtained in Tris and Bicine buffers (Fig.6 A and B), the values of ΔHobs,corr are in very good agreement (see Figure 6 C).
All of the corrected data (ΔHobs,corr) obtained in 0.20 M NaF, NaCl and NaBr over the entire temperature range 5-62.5°C are shown in Fig. 6C. These results indicate that the observed heat capacity changes for the SSB-(dT)70 interaction are not constant, but rather are dependent on temperature. At low temperatures (5-25°C) ΔHobs,corr decreases almost linearly with increasing temperature (ΔCp,obs,corr<0), but then starts to deviate toward less negative values going through a minimum near 35-40°C (ΔCp,obs,corr=0). Upon further increases in temperature, ΔHobs,corr increases (ΔCp,obs,corr>0) up to approximately 57-60°C, but then decreases sharply, likely due to the onset of partial unfolding of the SSB protein. This positive heat capacity change may be due to the effects of a linked temperature dependent conformational transition within the SSB tetramer, assuming that both free SSB and SSB in complex with (dT)70 can undergo such a conformation change (see discussion section). It is also obvious from the data in Fig. 6C that the type of anion affects the magnitude of the observed enthalpy change as well as the observed heat capacity change.
DISCUSSION
There has been much interest in understanding the molecular origins of heat capacity changes accompanying protein-DNA interactions and macromolecular interactions in general (16-18, 20-23, 25-27, 45-51). Most discussions have focused on apparent correlations between changes in accessible polar and non-polar surface area that accompany macromolecular binding (20-22, 45). However, such approaches have often ignored the fact that heat capacity changes can generally be dependent on solution conditions (see Introduction). In addition, the use of static structures for such calculations ignores the fact that temperature dependent changes in the ensemble of conformational states populated by the free and bound macromolecules will also contribute to a heat capacity change. Furthermore, the thermodynamic parameters associated with any macromolecular interaction, including protein-nucleic acid interactions, are influenced not only by the net formation of contacts that occur between them (e.g., hydrogen bonds, salt bridges, hydrophobic and van der Waals contacts) but also by the differential binding of low molecular weights solutes (e.g., water, ions, protons, osmolytes). For these reasons, although the suggestion that changes in accessible polar and non-polar surface area might correlate with observed heat capacity changes for macromolecular interactions was an important contribution to the development of this field, numerous experimental studies now suggest that such correlations do not apply generally (26, 46-49, 51, 52). Thus, it is clear that changes in accessible surface area do not make the sole contribution to ΔCp,obs, and may not even be dominant. As a dramatic example, the results reported here show that the heat capacity change for E. coli SSB binding to (dT)70 is extremely dependent upon temperature, as well as salt concentration and type, with the very sign of ΔCp,obs changing with temperature. Hence, any attempt to explain ΔCp,obs solely in terms of changes in accessible surface area cannot possibly succeed since all of these calculations predict a constant value for ΔCp,obs (20-22, 45).
For the reasons mentioned above, assessments of the molecular contributions to the thermodynamic properties of any macromolecular interaction require systematic experimental studies over a wide range of solution conditions. Unfortunately, few macromolecular systems have been studied in such detail to allow a serious investigation of the possible contributions to observed heat capacity changes. We have undertaken systematic studies of E. coli SSB tetramer binding to ssDNA in an attempt to define the molecular bases for the thermodynamic changes associated with this system, especially the large enthalpy and heat capacity changes. We have previously shown significant effects of adenine base stacking (16, 27) and coupled protonation (17) on ΔCp,obs for SSB binding to (dT)N and (dA)N. Here we have shown that there are also significant effects of monovalent anion concentration and type as well as contributions from conformational transitions within the SSB protein to both ΔCp,obs and ΔHobs for SSB-(dT)70 binding. These data also demonstrate a dramatic reversal of the sign of the heat capacity change with temperature for a protein-nucleic acid binding interaction.
A model linking SSB-ssDNA binding to anion binding and protein conformational transitions
The major results of our study show that at any salt concentration and type ΔHobs is a nonlinear function of temperature. For the data obtained in 0.20 M salts (Fig 6C), the initial decrease in ΔHobs with increasing temperature (ΔCp,obs<0) is followed by an increase (ΔCp,obs>0), with ΔHobs passing through a minimum at 35-40°C. Such a temperature dependent ΔCp,obs could reflect a temperature dependent conformational transition within the SSB protein or the ssDNA that is linked to the main binding equilibrium. In fact, a sigmoidal dependence of ΔHobs on temperature is expected if one of the interacting species undergoes a conformational transition in only one of its end states (unligated or ligated state), whereas a bell shaped dependence (with a minimum or maximum) is expected if one of the interacting species undergoes conformational transitions in both end states (19, 38, 53, 54). The system under study here is SSB binding to (dT)70. In contrast to a ssDNA such as (dA)N, which displays significant temperature dependent base stacking/unstacking equilibria that can contribute significantly to ΔCp,obs (16), (dT)70 does not display significant temperature dependent changes in base stacking in solution. Thus, we hypothesize that the observed temperature dependent ΔCp,obs results from one or more temperature dependent conformational transitions within the SSB protein and SSB-(dT)70 complex as depicted in Fig. 7, although contributions from the (dT)70 cannot be ruled out.
Increasing monovalent salt concentration affects the magnitude of ΔHobs, causing it to become less negative, but also affects ΔCp,obs (see Fig. 5 and Table 2). These effects increase upon replacing F- with Cl- and then with Br- (see Fig. 6). We have not observed any significant effects of [NaF] on ΔHobs (15), consistent with the fact that F- does not interact well with most proteins since it remains highly hydrated (34, 35, 55, 56). Hence, the dependence of ΔHobs on temperature obtained in 0.20 M NaF (Fig. 6C, lower curve) could reflect any intrinsic heat capacity changes (e.g., due to changes in ASA) as well as any conformational transitions within the free SSB protein and its DNA complex (see Fig. 7). In the model discussed here, we suggest that the decrease in ΔHobs with increasing temperature at low temperatures reflects a transition within SSB from M0 (which is the reference state for ssDNA binding) to M1, defined by parameters Tf, and ΔHf, although changes in ASA could also contribute. We ascribe the increase in ΔHobs with increasing temperature (T >35°C) to a transition within the SSB-DNA complex (M0D → M1D), defined by parameters Tc and ΔHc (Tc > Tf). To explain the abrupt drop in ΔHobs at temperatures above 58°C we introduce the additional equilibrium M1 → Mu, which corresponds to SSB unfolding defined by the parameters Ku and ΔHu. For formation of the M0D complex, we assume ΔH0<<0. It also seems reasonable to suggest that ΔHf and ΔHc>0, since partial unfolding of flexible elements within the SSB structure that are involved in its interaction with ssDNA (e.g. the L4-5 and L2-3 loops, or α-helices 3-4, (14)) can be expected as the temperature increases. For simplicity, our model neglects any contributions from ΔCp,0, ΔCp,f, ΔCp,c and ΔCp,u, although changes in ASA could also contribute to these intrinsic heat capacity changes.
To explain the effects of salt concentration and type on ΔHobs we introduce two additional equilibria in the scheme in Fig. 7. Since there is no direct information on anion binding to SSB we assume a simple model of anion binding to n independent and identical sites on the free protein. The corresponding association constants and enthalpy changes are K0A, K1A and ΔH0A, ΔH1A, for anion binding to both forms, M0 and M1, respectively. We assign negative values to ΔH0A and ΔH1A, since binding of the ssDNA will displace anions into solution resulting in positive contributions to ΔHobs as observed experimentally.
Using eq 5a, which is derived from the scheme in Fig.7, and the parameters shown in Table 4, we simulated the dependences of ΔHobs on temperature and salt concentration (details of the derivation of eq 5a and the procedure of finding optimal parameters are described in the Appendix). These predictions are shown in Fig. 8 (solid lines) and are superimposed on the experimental data. These simulations reproduce the observed effects of anion type (Fig. 8A) and salt concentration (Fig. 8B and Fig.8C) indicating that the linkage model presented in Fig.7 adequately describes all of the experimental data. Although not all of the parameters required for these simulations (see Table 4) are well constrained and thus a range of values yield equally good results, these simulations indicate that the model presented in Fig.7 provides a possible explanation for our observations with the SSB-(dT)70 system, including the reversal of sign for ΔCp,obs.
Table 4.
Thermodynamic Parameters Used to Simulate the Effects of Temperature and Salt on SSB-(dT)70 Binding Enthalpy (see Fig. 8) According to Fig. 7 and eqs 5
| Parameters reflecting conformational transitions within a free SSB and its 1:1 complex with (dT)70 | Parameters reflecting anion binding to free SSB | ||
|---|---|---|---|
| ΔHo, kcal/mol | -130 | nCl- | 16 |
| Tf, °C | 13 | K°0,Cl-=K°1,Cl-, M-1 | 1 |
| ΔHf , kcal/mol | 20 | ΔH0,Cl-=ΔH1,Cl-, kcal/mol | -5.2 |
| Tc , °C | 58 | nBr- | 16 |
| ΔHc, kcal/mol | 35 | K°0,Br-=K°1,Br-, M-1 | 2 |
| Tu , °C | 65 | ΔH0,Br-=ΔH1,Br-, kcal/mol | -5.2 |
| ΔHu , kcal/mol | 200 | - | - |
Figure 8.

Predicted effects of salt concentration and type on the observed enthalpy (ΔHobs) and heat capacity change (ΔCp,obs) for SSB-(dT)70 binding based on the scheme in Fig. 7. Solid lines are simulated using eqs 5 and the parameters in Table 4. Effects of anion type (panel A) and NaCl and NaBr concentration (panels B and C, respectively). (D) - Predicted dependence of ΔCp on NaBr and NaCl concentrations at 15°C.
A model similar to the scheme in Fig. 7 (i.e., a temperature dependent conformational transition within the protein-DNA complex) was used to explain the positive heat capacity change observed at low temperature for a mutant of Sac7d binding to poly(dGdC) (28). Although, for this system a negative ΔCp,obs was observed for the wild type Sac7d protein-DNA interaction and was interpreted as reflecting changes in accessible surface area.
The SSB-(dT)70 system displays similar behavior to that of mutant Sac7d in the temperature range from 40-62.5°C, which we also ascribe to a conformational transition within the protein-DNA complex and to protein unfolding. However, we assume that the same temperature dependent conformational change occurs within the free protein (at a lower T) and that this contributes to the reversal of the sign of ΔCp,obs at temperatures below 40°C. We suggest that this transition might reflect a temperature dependent partial unfolding of α-helices (which refold upon ssDNA binding) as follows. Inspection of the SSB structure indicates that four α-helices are involved in interactions with ssDNA (14), whereas in free SSB these do not appear to form any contacts with the rest of the tetramer. Recent differential scanning calorimetric (DSC) studies of a series of helical peptides (57) revealed that the helix-coil transitions occur noncooperatively at relatively low temperatures (<40°C) and with enthalpy changes of approximately 1 kcal/mol residue. DSC profiles for free SSB protein (data not shown) show a nonlinear decrease of the partial heat capacity at temperatures below 35°C, similar to those observed for helical peptides (57), which might be related to an unfolding of helical elements within SSB. In fact, the complete unfolding of four SSB helices (10 amino acids each) would result in an enthalpic change of ≈40 kcal/mol. A conformational change requiring only half of that enthalpic change (ΔHf ≈ 20 kcal/mol, see Table 4) can explain the SSB-(dT)70 data reported here. Further investigations will be required to test this hypothesis. It is also possible that part of the negative heat capacity change observed at low temperatures could have contributions from changes in non-polar accessible surface area.
The positive heat capacity change observed at high temperatures could also have contributions from temperature dependent changes in how the wrapped (dT)70 is phased around the SSB tetramer. Since SSB is a non-specific DNA binding protein, then it is not likely that all of the (dT)70 in the ensemble of complexes is phased (i.e., all SSB-(dT)70 complexes will not have the 3′ and 5′ ends of the (dT)70 at the same position within each tetramer). If this is the case and the relative distribution of phased (dT)70 within the ensemble of complexes changes with temperature, then this could yield a positive heat capacity of binding. At this point, we have no information of this distribution or whether it changes with temperature. On the other hand, since one can clearly see electron density of much of the ssDNA in the crystal structure of tetrameric (SSB)c bound to two molecules of (dC)35 (14), the majority of the ssDNA must be phased under those conditions. Hence, this explanation may not apply.
Estimates of the various contributions to ΔCp,obs for the SSB-(dT)70 interaction
It is informative to calculate the individual contributions to ΔCp,obs due to coupled protonation reactions, anion binding and the hypothesized protein conformational transition. Of course, due to the fact that ΔCp,obs is temperature dependent, this decomposition will also be influenced by temperature. Therefore, the following discussion applies to the low temperature range (5-25°) where the dependences of ΔHobs on temperature are nearly linear and where the overall ΔCp,obs is negative. First, based on the parameters in Table 1 and eq 3c, we can estimate the contribution to ΔCp,obs due to protonation by simulating values of ΔHapp,prot over the temperature range 5-25°C and determining the slope of this dependence, which is very nearly linear. This yields ΔCp,prot = -0.52 and -0.58 kcal/mol°K at 0.20 M and higher salt concentrations, respectively (see Table 5). The contribution due to the proposed temperature dependent SSB conformational change was obtained in a similar manner using eq 5b and the parameters in Table 4 (no salt effects were considered) and yields Δ Cp,conf = -0.55 kcal/mol°K.
Table 5.
Contributions to Heat Capacity Changes for SSB-(dT)70 Binding Predicted at Low Temperatures (5-25°C) at 0.20 and 2.0 M monovalent salt
| NaF 0.2M | NaCl 0.2M | NaCl 1M | NaCl 2M | NaBr 0.2M | NaBr 1M | NaBr 2M | |
|---|---|---|---|---|---|---|---|
| ΔCp,prot a kcal/mol deg | -0.52 | -0.52 | -0.58 | -0.58 | -0.52 | -0.58 | -0.58 |
| ΔCp,conf kcal/mol deg | -0.55 | -0.55 | -0.55 | -0.55 | -0.55 | -0.55 | -0.55 |
| ΔCp,salt b kcal/mol deg | - | -0.45 | -0.64 | -0.52 | -0.60 | -0.52 | -0.35 |
| ΔCp,salt,exp c kcal/mol deg | - | -0.18±0.07 | -0.36±0.16 | -0.44±0.11 | -0.37±0.07 | -0.29±0.07 | -0.18±0.11 |
obtained from the slopes of dependences of ΔHapp,prot (eq 3c) and parameters in Table 1 for the range 5-25°C
obtained from the slopes of dependences of ΔHobs (eq 5a) and parameters in Table 4 for the range 5-25°C, subtracting value ΔCp,conf (-0.55 kcal/mol°K) calculated in the same manner using eq 5b.
obtained from experimental data in Table 2 as the difference ΔCp,corr,F - ΔCp,corr,A, where the latter term is the value at corresponding concentrations of NaCl or NaBr
The contributions due to changes in salt concentration and type (ΔCp,salt) were estimated by subtracting the contribution ΔCp,conf= -0.55 kcal/mol°K from ΔCp,obs determined from the slope of the dependences simulated within the range 5-25°C using eq 5a and the parameters in Table 4 (solid lines in Fig. 8A, B and C). The experimental values of ΔCp,salt,exp were calculated (see Table 5) as the difference, (ΔCp,corr,A - ΔCp,corr,F), where ΔCp,corr,A is the value at the corresponding NaCl or NaBr concentration from Table 2 and ΔCp,corr,F = - 0.64 kcal/mol°K is the value estimated for the proposed conformational transition within the free protein in this temperature range. As seen from Table 5, the ΔCp,salt values range from -0.4 to -0.6 kcal/mol°K and ΔCp,salt,exp values range from -0.2 to -0.4 kcal/mol°K. These agree reasonably well considering the experimental uncertainties. Therefore, as we see from Table 5, the contribution to ΔCp,obs at low temperatures from each coupled equilibrium can be as much as -0.5 kcal/mol°K, yielding a total of -1.5 kcal/mol°K.
Recall that for simplicity our analysis neglected ΔCp,0 (i.e., the intrinsic heat capacity change for the formation of the SSB-ssDNA complex in the reference state, M0D). In fact, we cannot rule out the possibility that part of the low temperature negative ΔCp,obs results from an intrinsic ΔCp,0, originating from a change in non-polar accessible surface area. Unfortunately, we are not able to estimate this contribution based on changes in accessible surface area since the available structural data is incomplete (for the complex in particular, which is missing a number of ssDNA fragments (14)). It is also difficult to know how to model the ensemble of structures for the free ssDNA, and there is limited model compound data available to calculate the contributions to ΔCp,obs due to burial of ssDNA within a protein. However, we note that inclusion of this term in the analysis would affect mostly the parameters reflecting the conformational transitions within the free protein (ΔHf) and complex (ΔHc), with little effect on the parameters describing anion binding.
The model in Fig.7 explains why the observed values for ΔCp increase in magnitude with increasing [NaCl], but decrease with increasing [NaBr] (see Table 2). An expression for the dependence of ΔCp,obs on anion concentration, [A-], and temperature can be obtained by differentiating eq 5a with respect to temperature. From this, the dependences of ΔCp,obs on salt concentration can be constructed at any chosen temperature. Figure 8D shows predictions of the dependences of ΔCp,obs on NaF, NaBr and NaF at 15°C based on model in Fig.7 and the parameters in Table 4. Since we assume no interaction of F- with SSB, the constant value of ΔCp,NaF = -0.6 kcal/mol K should reflect only contributions from the conformational transition, M0→M1, or changes in non-polar accessible surface area. These simulations predict a bell shaped curve for both salts, although the curves are shifted due to the different affinities of Br- vs. Cl- for the SSB protein. In fact, the minimum in ΔCp,obs is sensitive to the association constant for anion binding to SSB at this temperature, since [A-]min=1/KA, as determined from the condition, Therefore, the fact that we observe a decrease in the magnitude of ΔCp,obs with increasing [NaBr] simply reflects the fact that our experiments were performed at NaBr concentrations greater than 1/KBr. On the other hand, we observe an increase in the magnitude of ΔCp,obs with increasing [NaCl] since our experiments were performed at [NaCl] concentrations below 1/KCl.
Nature of the weak interactions of anions with SSB manifested at high salt concentrations
The effects of salt concentration and type on protein-DNA interactions are complex. The free energy of binding can have contributions from polyelectrolyte effects (58-60) as well as from specific and nonspecific interactions of salt ions with both protein and DNA (61, 62). In addition, preferential hydration can contribute significantly at salt concentrations above 0.50 M (59, 63, 64). In this study and in our previous work (15) we suggest that the dominant effect of salt on both the enthalpy and heat capacity change for SSB-ssDNA binding is due to a weak interaction of anions with the protein. Although, there is evidence that cations also affect SSB-ssDNA complex formation (34, 40), we do not consider these effects explicitly since we do not observe any influence of cation type on ΔHobs at concentrations >0.10 M (15).
The nature of the weak interactions of anions with proteins continues to be a matter of some discussion (55, 56, 65-68). These effects are often described as “Hofmeister effects” (69) and are generally attributed to the indirect effects that ions exert through their influences on the structure and hydrogen-bonding properties of water (56, 67, 70-72). However, such ions can also interact directly with proteins, although it is difficult to assess quantitatively the different contributions from direct anion binding vs. effects on preferential hydration.
In our analysis we have used a simple site-binding model to describe anion binding to the SSB tetramer. Quantitative estimates of the thermodynamic parameters for the binding of Cl- and Br- to SSB presented in Table 4 suggest that Br- binds with a two fold higher affinity than Cl-(KCl-1 ≈ 1 M-1 and KBr- ≈ 2 M-1), whereas the enthalpy change for both anions is approximately the same (ΔHCl- ≈ ΔHBr- ≈ -5.2 kcal/mol). These are within the range of estimates reported for other systems (73-78), although these estimates also generally depend on the model used.
Other models for salt effects on ΔHobs and ΔCp,obs
Effects of salt concentration on ΔHobs and ΔCp,obs have been reported for other protein-nucleic acid systems (25, 26, 47, 49, 51, 79). The effect of [KCl] on ΔHobs and ΔCp,obs for specific and nonspecific binding of E. coli IHF (Integration Host Factor) to a 34bp DNA fragment was studied using ITC (25). At low KCl concentration both ΔHobs and ΔCp,obs are large and negative, but their magnitudes decrease non-linearly as the salt concentration increases. These results, which are similar to those reported here and previously (15), were interpreted as reflecting the DNA binding dependent disruption of salt bridges on the protein surface formed between cationic (Lys, Arg and His) and anionic (Asp and Glu) residues (25, 80). According to this model, at low salt concentrations the salt bridges on the protein are mainly intact in the free protein, but are disrupted by DNA binding, resulting in hydration of both cationic and anionic side chains prior to DNA binding. These hydration processes are considered as a primary source of the large and negative values of ΔHobs and ΔCp,obs. The stability of these salt bridges is proposed to decrease with increasing salt concentration and decreasing temperature. As a result, this model predicts a corresponding decrease in ΔHobs and ΔCp,obs with increasing [KCl].
Although E.coli SSB protein also has a large number of basic side chains that are in close proximity to acidic side chains so that salt bridges could form as suggested for IHF (25), the salt bridge disruption model does not appear compatible with the observed thermodynamic behavior for SSB-(dT)70 binding for the following reasons. The salt bridge model does not predict the observed minimum in the dependence of ΔCp,obs on [KCl], which is also observed for IHF binding to DNA (25). Secondly, the salt bridge model does not explain the effects of anion type on ΔHobs and ΔCp,obs that we observe for the SSB-(dT)70 interaction, which were not examined for the IHF-DNA interaction (25). The thermodynamic linkage model presented in the scheme in Fig. 7 can account for both the salt dependent minimum in ΔCp,obs as well as the effects of anion type on both ΔHobs and ΔCp,obs.
Summary
The results presented here, along with our previous studies (15-17) demonstrate that solution conditions (pH, salt concentration and type) and temperature can have a profound effect on the observed binding enthalpy and heat capacity change for SSB-ssDNA binding. In fact, the dramatic nonlinear dependence of ΔHobs on temperature indicates that the observed heat capacity change results from contributions from multiple temperature dependent equilibria that are coupled to the main protein-DNA binding equilibrium and cannot be explained solely on the basis of changes in accessible surface are upon complex formation. For the SSB-ssDNA system, we have documented contributions from the following coupled equilibria: protonation, anion binding, ssDNA base unstacking and protein conformational changes. These temperature dependent contributions result in an observed ΔCp,obs that is temperature dependent; ΔCp,obs even changes sign from highly negative to highly positive with increasing temperature. The positive heat capacity change observed at high temperatures appears to be the result of SSB and/or ssDNA conformational transitions within the protein-DNA complex. These effects are further modulated by weak interactions with anions.
Table 5 presents our estimates of the various contributions to ΔCp,obs in the low temperature range (5-25°C) due to protonation (-0.5 to -0.6 kcal/mol°K), anion binding (-0.2 to -0.6 kcal/mol°K) and conformational transitions within the SSB protein and/or changes in ASA (-0.55 kcal/mol°K). Each of these processes can contribute approximately equally to the total observed heat capacity change. We further estimate that as much as -1.0 kcal/mol°K can result from temperature dependent base unstacking transitions upon binding of SSB to ssDNA that has a high propensity for base stacking, such as oligo(dA) (15). As a result the total ΔCp,obs for an SSB-ssDNA binding interaction can be very large and negative (up to -2.8 kcal/mol°K), even if the intrinsic ΔCp,0 is small. However, at higher temperatures, the overall ΔCp,obs can even become positive. We note that of the above contributions, only the contribution due to conformational transitions within the SSB protein and/or changes in ASA (-0.55 kcal/mol°K) can potentially correlate with changes in accessible surface area, suggesting that the “hydrophobic effect” is not the dominant contributor to the observed ΔCp. In fact it is likely that many of the large negative values of ΔCp,obs observed for other macromolecular interactions are dominated by contributions due to multiple temperature dependent equilibria that are linked to the main equilibrium of interest, rather than the hydrophobic effect. The data presented here underscore the complexity of macromolecular interactions in solution and the importance of systematically examining the effects of multiple solution factors for any analysis of such interactions.
ACKNOWLEDGMENTS
We thank Dr. Nathan Baker, Dr. M. Thomas Record, Jr. and Dr. Ruth Saecker for useful discussions, Dr. Gabriel Waksman for preparing Figure 1 and T. Ho for synthesis and purification of oligodeoxynucleotides.
Abbreviations
- SSB
Single Stranded DNA binding protein
- ssDNA
single stranded DNA
- ITC
isothermal titration calorimetry
- ASA
accessible surface area
- Tris
tris(hydroxymethyl)aminomethane
- EDTA
(ethylenediaminetetraacetic acid)
- ΔH’obs
enthalpy change determined directly from the experimental data
- ΔHobs,corr
enthalpy change after correcting for contributions from buffer ionization and protonation effects (see Materials and Methods).
APPENDIX
Based on the scheme in Fig. 7, the observed equilibrium constant for the binding of (dT)70 (D) to SSB (M) in a monovalent salt of anion, A, can be expressed as in eq 4, using the method of binding polynomials (53),
| (4) |
where K0 is the equilibrium association constant for D binding to protein conformation M0, Kf=[M1]/[M0], Kf=[M1D]/[M0D] and Ku=[Mu]/[M1]. We model the interaction of anions with SSB by assuming n independent and identical anion binding sites on the SSB tetramer. This introduces two additional terms, P0A=(1+K0A[A])n and P1A=(1+K1A[A])n, in the denominator of eq 4, which describe anion binding to M0 and to M1, respectively.
The expression for ΔHobs as a function of temperature and monovalent salt concentration in eq 5a is obtained from eq 4 by applying the van’t Hoff relationship, , where Z is the denominator in eq 4.
| (5a) |
If anions do not bind to the protein then eq 5a reduces to eq 5b.
| (5b) |
In this analysis, we neglect any intrinsic ΔCp associated with each equilibrium (i.e., dΔHO/dT = dΔHc/dT = dΔHf/dT = 0). Thus, we assume that the only parameters in eqs 5a and 5b that are dependent on temperature are the equilibrium constants: Kf, Kc, Ku, K0A and K1A. These temperature dependences can be expressed as in eq 5c, according to the integrated van’t Hoff relationship,
| (5c) |
where the are the equilibrium constants at the reference temperature (Tref=298°K). It is worth mentioning that in the calculations using eqs 5a and 5b we can replace the parameters which characterize the conformational transitions within the protein , and by the corresponding values of n Tf, Tc and Tu, reflecting the temperatures defining the transition midpoints of these conformational changes (where ). With these assumptions, eq 5c becomes eq 5d.
| (5d) |
Direct fitting of the experimental data to eq 5a cannot be performed due to the large number of parameters, many of which are highly correlated. In fact, even after the number of simplifying assumptions discussed below, a total of 12 parameters are needed to describe the three sets of experimental data in NaF, NaCl and NaBr (see Figure 8). In fact, we cannot obtain unique estimates for all of these 12 parameters. However, we can provide reasonable estimates for these 12 parameters that are used to demonstrate that the scheme in Fig. 7 is able to describe the thermodynamic behavior of the SSB-(dT)70 interaction reported here.
To obtain a set of 12 parameters needed to describe the three sets of experimental data we used the following procedure. We first estimated the seven parameters in eq 5b needed to describe the conformational transitions within SSB (Tf and ΔHf), within the SSB- DNA complex (Tc and ΔHc), for SSB unfolding (Tu and ΔHu) and for SSB-(dT)70 binding (ΔH0) for the “reference” set of experimental data obtained in 0.20 M NaF (see Fig. 6C, lower curve). We use the NaF data as the “reference” since we assume that F- does not bind to the SSB protein or its complex with DNA. From inspection of this “reference” curve, we made initial guesses for Tf ≈ 15°C and ΔHf ≈ 15-20 kcal/mol, and Tc ≈ 50-55°C, ΔHc ≈ 20 kcal/mol by assessing the overall change in magnitude of ΔHobs over the range of low (5-35°C) and high (35-60°C) temperatures, assuming that the midpoints correspond to Tf and Tc, respectively. For the unfolding transition we fix ΔHu=200 kcal/mol with Tu within the range 65-70°C, based on DSC studies of SSB protein (data not shown). We next assigned ΔH0 ≈-130 kcal/mol, since according to eq 5b, ΔH0 ≈ ΔHobs at low temperatures. These initial values were refined by successively constraining one, two or three parameters and fitting for the remaining parameters by non-linear least squares analysis using eq 5b.
A description of the effects of salt concentration and type on the dependences of ΔHobs on temperature (eq 5a) requires five additional parameters for each anion type (Cl- and Br-). These include the number of anion binding sites on the SSB protein (n), the association constants (K0A and K1A) at the reference temperature, and the enthalpy changes (ΔH0A and ΔH1A) for anion (A = Cl- or Br-) binding to each form of the SSB protein (M0 or M1, see the scheme in Fig. 7). We reduced the number of parameters needed for each anion to three as follows. First, we eliminated two parameters by assuming that the affinities and enthalpies of binding of the anions are the same for the two conformations of SSB protein, thus K0A = K1A= KA and ΔH0A = ΔH1A = ΔHA (A= Br- or Cl-). In fact, after fixing the parameters for the conformational transitions (Tf, ΔHf, Tc, ΔHc, Tu, ΔHu and ΔH0), global fitting of the data in NaBr or NaCl (plus the “reference” NaF data) results in only slight (less than 10%) differences between K0A and K1A and ΔH0A and ΔH1A (for each anion, Br- or Cl-) This leaves three parameters for each salt (n, KA, ΔHA). We assumed further a total number of n=16 anion binding sites (4 per subunit). This is based on the assumption that anions interact with the four lysines (K43,K62, K73 and K87) appear to interact with phosphates of ssDNA (14, 81). We note that if n is assumed to be smaller as in previous studies (29), there will be a proportional increase in the magnitude of ΔHA due to the correlation between these parameters. Therefore, a total of 12 parameters are needed to describe the behavior of ΔHobs as a function of salt concentration and temperature. To refine these parameters (two of them are fixed), we globally fit the 0.20 M NaF “reference” data (Fig. 8A, lower dependence) along with the data in NaCl (Fig. 8B) or NaBr (Fig. 8C) to eq 5a. The resulting parameters are listed in Table 4, which were used to simulate the solid curves in Fig. 8A, 8B and 8C.
Footnotes
This research was supported in part by the NIH (R01 GM30498)
REFERENCES
- 1.Lohman TM, Bujalowski W, Overman LB. E. coli single strand binding protein: a new look at helix-destabilizing proteins. Trends Biochem Sci. 1988;13:250–255. [PubMed] [Google Scholar]
- 2.Lohman TM, Bujalowski W. Escherichia coli single strand binding protein: Multiple single-stranded DNA binding modes and cooperativities. In: Revzin A, editor. The Biology of Nonspecific DNA-Protein Interactions. CRC Press; Boca Raton, Fla: 1990. pp. 131–170. [Google Scholar]
- 3.Lohman TM, Ferrari ME. Escherichia coli single-stranded DNA- binding protein: multiple DNA-binding modes and cooperativities. Annu Rev Biochem. 1994;63:527–570. doi: 10.1146/annurev.bi.63.070194.002523. [DOI] [PubMed] [Google Scholar]
- 4.Meyer RR, Laine PS. The single-stranded DNA-binding protein of Escherichia coli. Microbiol Rev. 1990;54:342–380. doi: 10.1128/mr.54.4.342-380.1990. [DOI] [PMC free article] [PubMed] [Google Scholar]
- 5.Raghunathan S, Ricard CS, Lohman TM, Waksman G. Crystal structure of the homo-tetrameric DNA binding domain of Escherichia coli single- stranded DNA-binding protein determined by multiwavelength x-ray diffraction on the selenomethionyl protein at 2.9-A resolution. Proc Natl Acad Sci U S A. 1997;94:6652–6657. doi: 10.1073/pnas.94.13.6652. [DOI] [PMC free article] [PubMed] [Google Scholar]
- 6.Lohman TM, Overman LB. Two binding modes in Escherichia coli single strand binding protein-single stranded DNA complexes. Modulation by NaCl concentration. J Biol Chem. 1985;260:3594–3603. [PubMed] [Google Scholar]
- 7.Bujalowski W, Lohman TM. Escherichia coli single-strand binding protein forms multiple, distinct complexes with single-stranded DNA. Biochemistry. 1986;25:7799–7802. doi: 10.1021/bi00372a003. [DOI] [PubMed] [Google Scholar]
- 8.Bujalowski W, Overman LB, Lohman TM. Binding mode transitions of Escherichia coli single strand binding protein-single-stranded DNA complexes. Cation, anion, pH, and binding density effects. J Biol Chem. 1988;263:4629–4640. [PubMed] [Google Scholar]
- 9.Chrysogelos S, Griffith J. Escherichia coli single-strand binding protein organizes single-stranded DNA in nucleosome-like units. Proc Natl Acad Sci U S A. 1982;79:5803–5807. doi: 10.1073/pnas.79.19.5803. [DOI] [PMC free article] [PubMed] [Google Scholar]
- 10.Wei TF, Bujalowski W, Lohman TM. Cooperative binding of polyamines induces the Escherichia coli single-strand binding protein-DNA binding mode transitions. Biochemistry. 1992;31:6166–6174. doi: 10.1021/bi00141a029. [DOI] [PubMed] [Google Scholar]
- 11.Griffith JD, Harris LD, Register J., 3rd. Visualization of SSB- ssDNA complexes active in the assembly of stable RecA-DNA filaments. Cold Spring Harb Symp Quant Biol. 1984;49:553–559. doi: 10.1101/sqb.1984.049.01.062. [DOI] [PubMed] [Google Scholar]
- 12.Lohman TM, Overman LB, Datta S. Salt-dependent changes in the DNA binding co-operativity of Escherichia coli single strand binding protein. J Mol Biol. 1986;187:603–615. doi: 10.1016/0022-2836(86)90338-4. [DOI] [PubMed] [Google Scholar]
- 13.Ferrari ME, Bujalowski W, Lohman TM. Co-operative binding of Escherichia coli SSB tetramers to single-stranded DNA in the (SSB)35 binding mode. J Mol Biol. 1994;236:106–123. doi: 10.1006/jmbi.1994.1122. [DOI] [PubMed] [Google Scholar]
- 14.Raghunathan S, Kozlov AG, Lohman TM, Waksman G. Structure of the DNA binding domain of E. coli SSB bound to ssDNA. Nat Struct Biol. 2000;7:648–652. doi: 10.1038/77943. [DOI] [PubMed] [Google Scholar]
- 15.Kozlov AG, Lohman TM. Calorimetric studies of E. coli SSB protein-single-stranded DNA interactions. Effects of monovalent salts on binding enthalpy. J Mol Biol. 1998;278:999–1014. doi: 10.1006/jmbi.1998.1738. [DOI] [PubMed] [Google Scholar]
- 16.Kozlov AG, Lohman TM. Adenine base unstacking dominates the observed enthalpy and heat capacity changes for the Escherichia coli SSB tetramer binding to single-stranded oligoadenylates. Biochemistry. 1999;38:7388–7397. doi: 10.1021/bi990309z. [DOI] [PubMed] [Google Scholar]
- 17.Kozlov AG, Lohman TM. Large contributions of coupled protonation equilibria to the observed enthalpy and heat capacity changes for ssDNA binding to Escherichia coli SSB protein. Proteins Suppl. 2000;4:8–22. doi: 10.1002/1097-0134(2000)41:4+<8::aid-prot20>3.0.co;2-h. [DOI] [PubMed] [Google Scholar]
- 18.Sturtevant JM. Heat capacity and entropy changes in processes involving proteins. Proc Natl Acad Sci U S A. 1977;74:2236–2240. doi: 10.1073/pnas.74.6.2236. [DOI] [PMC free article] [PubMed] [Google Scholar]
- 19.Eftink MR, Anusiem AC, Biltonen RL. Enthalpy-entropy compensation and heat capacity changes for protein-ligand interactions: general thermodynamic models and data for the binding of nucleotides to ribonuclease A. Biochemistry. 1983;22:3884–3896. doi: 10.1021/bi00285a025. [DOI] [PubMed] [Google Scholar]
- 20.Ha JH, Spolar RS, Record MT., Jr. Role of the hydrophobic effect in stability of site-specific protein-DNA complexes. J Mol Biol. 1989;209:801–816. doi: 10.1016/0022-2836(89)90608-6. [DOI] [PubMed] [Google Scholar]
- 21.Murphy KP, Freire E. Thermodynamics of structural stability and cooperative folding behavior in proteins. Adv Protein Chem. 1992;43:313–361. doi: 10.1016/s0065-3233(08)60556-2. [DOI] [PubMed] [Google Scholar]
- 22.Spolar RS, Record MT., Jr. Coupling of local folding to site- specific binding of proteins to DNA. Science. 1994;263:777–784. doi: 10.1126/science.8303294. [DOI] [PubMed] [Google Scholar]
- 23.Morton CJ, Ladbury JE. Water-mediated protein-DNA interactions: the relationship of thermodynamics to structural detail. Protein Sci. 1996;5:2115–2118. doi: 10.1002/pro.5560051018. [DOI] [PMC free article] [PubMed] [Google Scholar]
- 24.Jen-Jacobson L, Engler LE, Ames JT, Kurpiewski MR, Grigorescu A. Thermodynamic parameters of specific and nonspecific protein-DNA binding. Supramolecular Chemistry. 2000;12:143–160. [Google Scholar]
- 25.Holbrook JA, Tsodikov OV, Saecker RM, Record MT., Jr. Specific and non-specific interactions of integration host factor with DNA: thermodynamic evidence for disruption of multiple IHF surface salt-bridges coupled to DNA binding. J Mol Biol. 2001;310:379–401. doi: 10.1006/jmbi.2001.4768. [DOI] [PubMed] [Google Scholar]
- 26.Bergqvist S, Williams MA, O’Brien R, Ladbury JE. Heat capacity effects of water molecules and ions at a protein-DNA interface. J Mol Biol. 2004;336:829–842. doi: 10.1016/j.jmb.2003.12.061. [DOI] [PubMed] [Google Scholar]
- 27.Ferrari ME, Lohman TM. Apparent heat capacity change accompanying a nonspecific protein-DNA interaction. Escherichia coli SSB tetramer binding to oligodeoxyadenylates. Biochemistry. 1994;33:12896–12910. doi: 10.1021/bi00209a022. [DOI] [PubMed] [Google Scholar]
- 28.Peters WB, Edmondson SP, Shriver JW. Thermodynamics of DNA binding and distortion by the hyperthermophile chromatin protein Sac7d. J Mol Biol. 2004;343:339–360. doi: 10.1016/j.jmb.2004.08.042. [DOI] [PubMed] [Google Scholar]
- 29.Overman LB, Lohman TM. Linkage of pH, anion and cation effects in protein-nucleic acid equilibria. Escherichia coli SSB protein-single stranded nucleic acid interactions. J Mol Biol. 1994;236:165–178. doi: 10.1006/jmbi.1994.1126. [DOI] [PubMed] [Google Scholar]
- 30.Fukada H, Takahashi K. Enthalpy and heat capacity changes for the proton dissociation of various buffer components in 0.1 M potassium chloride. Proteins. 1998;33:159–166. [PubMed] [Google Scholar]
- 31.Christensen JJ, Hansen LD, Izatt RM. Handbook of proton ionization heats. John Wiley & Sons; New York: 1976. [Google Scholar]
- 32.Lohman TM, Green JM, Beyer RS. Large-scale overproduction and rapid purification of the Escherichia coli ssb gene product. Expression of the ssb gene under lambda PL control. Biochemistry. 1986;25:21–25. doi: 10.1021/bi00349a004. [DOI] [PubMed] [Google Scholar]
- 33.Bujalowski W, Lohman TM. Monomer-tetramer equilibrium of the Escherichia coli ssb-1 mutant single strand binding protein. J Biol Chem. 1991;266:1616–1626. [PubMed] [Google Scholar]
- 34.Overman LB, Bujalowski W, Lohman TM. Equilibrium binding of Escherichia coli single-strand binding protein to single-stranded nucleic acids in the (SSB)65 binding mode. Cation and anion effects and polynucleotide specificity. Biochemistry. 1988;27:456–471. doi: 10.1021/bi00401a067. [DOI] [PubMed] [Google Scholar]
- 35.Kowalczykowski SC, Lonberg N, Newport JW, vonHippel PH. Interactions of bacteriophage T4-coded gene 32 protein with nucleic acids. I. Characterization of the binding interactions. J Mol Biol. 1981;145:75–104. doi: 10.1016/0022-2836(81)90335-1. [DOI] [PubMed] [Google Scholar]
- 36.Wiseman T, Williston S, Brandts JF, Lin LN. Rapid measurement of binding constants and heats of binding using a new titration calorimeter. Anal Biochem. 1989;179:131–137. doi: 10.1016/0003-2697(89)90213-3. [DOI] [PubMed] [Google Scholar]
- 37.Lohman TM, Overman LB, Ferrari ME, Kozlov AG. A highly salt-dependent enthalpy change for Escherichia coli SSB protein-nucleic acid binding due to ion-protein interactions. Biochemistry. 1996;35:5272–5279. doi: 10.1021/bi9527606. [DOI] [PubMed] [Google Scholar]
- 38.Eftink M, Biltonen R. Biological Microcalorimetry. In: Beezer AE, editor. Thermodynamics of Interacting Biological Systems. Academic Press; New York: 1980. pp. 343–412. [Google Scholar]
- 39.Bujalowski W, Lohman TM. Negative co-operativity in Escherichia coli single strand binding protein-oligonucleotide interactions. II. Salt, temperature and oligonucleotide length effects. J Mol Biol. 1989;207:269–288. doi: 10.1016/0022-2836(89)90455-5. [DOI] [PubMed] [Google Scholar]
- 40.Bujalowski W, Lohman TM. Negative co-operativity in Escherichia coli single strand binding protein-oligonucleotide interactions. I. Evidence and a quantitative model. J Mol Biol. 1989;207:249–268. doi: 10.1016/0022-2836(89)90454-3. [DOI] [PubMed] [Google Scholar]
- 41.Marini MA, Berger RL, Lam DP, Martin CJ. Thermal titrimetric evaluation of the heats of ionization of the commonly occurring amino acids and their derivatives. Anal Biochem. 1971;43:188–198. doi: 10.1016/0003-2697(71)90124-2. [DOI] [PubMed] [Google Scholar]
- 42.Shiao DD, Sturtevant JM. Heats of binding protons to globular proteins. Biopolymers. 1976;15:1201–1211. doi: 10.1002/bip.1976.360150613. [DOI] [PubMed] [Google Scholar]
- 43.Lohman TM, Bujalowski W. Effects of base composition on the negative cooperativity and binding mode transitions of Escherichia coli SSB-single- stranded DNA complexes. Biochemistry. 1994;33:6167–6176. doi: 10.1021/bi00186a016. [DOI] [PubMed] [Google Scholar]
- 44.Kozlov AG, Lohman TM. Kinetic mechanism of direct transfer of Escherichia coli SSB tetramers between single-stranded DNA molecules. Biochemistry. 2002;41:11611–11627. doi: 10.1021/bi020361m. [DOI] [PubMed] [Google Scholar]
- 45.Makhatadze GI, Privalov PL. Energetics of protein structure. Adv Protein Chem. 1995;47:307–425. doi: 10.1016/s0065-3233(08)60548-3. [DOI] [PubMed] [Google Scholar]
- 46.Ladbury JE, Wright JG, Sturtevant JM, Sigler PB. A thermodynamic study of the trp repressor-operator interaction. J Mol Biol. 1994;238:669–681. doi: 10.1006/jmbi.1994.1328. [DOI] [PubMed] [Google Scholar]
- 47.Berger C, Jelesarov I, Bosshard HR. Coupled folding and site- specific binding of the GCN4-bZIP transcription factor to the AP-1 and ATF/CREB DNA sites studied by microcalorimetry. Biochemistry. 1996;35:14984–14991. doi: 10.1021/bi961312a. [DOI] [PubMed] [Google Scholar]
- 48.O’Brien R, DeDecker B, Fleming KG, Sigler PB, Ladbury JE. The effects of salt on the TATA binding protein-DNA interaction from a hyperthermophilic archaeon. J Mol Biol. 1998;279:117–125. doi: 10.1006/jmbi.1998.1743. [DOI] [PubMed] [Google Scholar]
- 49.Oda M, Furukawa K, Ogata K, Sarai A, Nakamura H. Thermodynamics of specific and non-specific DNA binding by the c-Myb DNA- binding domain. J Mol Biol. 1998;276:571–590. doi: 10.1006/jmbi.1997.1564. [DOI] [PubMed] [Google Scholar]
- 50.Holbrook JA, Capp MW, Saecker RM, Record MT., Jr. Enthalpy and heat capacity changes for formation of an oligomeric DNA duplex: interpretation in terms of coupled processes of formation and association of single- stranded helices. Biochemistry. 1999;38:8409–8422. doi: 10.1021/bi990043w. [DOI] [PubMed] [Google Scholar]
- 51.Lundback T, Chang JF, Phillips K, Luisi B, Ladbury JE. Characterization of sequence-specific DNA binding by the transcription factor Oct- 1. Biochemistry. 2000;39:7570–7579. doi: 10.1021/bi000377h. [DOI] [PubMed] [Google Scholar]
- 52.Barbieri CM, Srinivasan AR, Pilch DS. Deciphering the origins of observed heat capacity changes for aminoglycoside binding to prokaryotic and eukaryotic ribosomal RNA a-sites: a calorimetric, computational, and osmotic stress study. J Am Chem Soc. 2004;126:14380–14388. doi: 10.1021/ja0457516. [DOI] [PubMed] [Google Scholar]
- 53.Wyman J, Gill SJ. Bindng and Linkage. University Science Books, Mill Valley; California: 1990. [Google Scholar]
- 54.Fisher HF, Singh N. Calorimetric methods for interpreting protein- ligand interactions. Methods Enzymol. 1995;259:194–221. doi: 10.1016/0076-6879(95)59045-5. [DOI] [PubMed] [Google Scholar]
- 55.von Hippel PH, Schleich T. Ion effects on the solution structure of biological macromolecules. Accts Chem. Res. 1969;2:257–265. [Google Scholar]
- 56.Collins KD. Charge density-dependent strength of hydration and biological structure. Biophys J. 1997;72:65–76. doi: 10.1016/S0006-3495(97)78647-8. [DOI] [PMC free article] [PubMed] [Google Scholar]
- 57.Richardson JM, Makhatadze GI. Temperature dependence of the thermodynamics of helix-coil transition. J Mol Biol. 2004;335:1029–1037. doi: 10.1016/j.jmb.2003.11.027. [DOI] [PubMed] [Google Scholar]
- 58.Record MT, Jr., Lohman ML, De Haseth P. Ion effects on ligand- nucleic acid interactions. J Mol Biol. 1976;107:145–158. doi: 10.1016/s0022-2836(76)80023-x. [DOI] [PubMed] [Google Scholar]
- 59.Record MT, Jr., Anderson CF, Lohman TM. Thermodynamic analysis of ion effects on the binding and conformational equilibria of proteins and nucleic acids: the roles of ion association or release, screening, and ion effects on water activity. Q Rev Biophys. 1978;11:103–178. doi: 10.1017/s003358350000202x. [DOI] [PubMed] [Google Scholar]
- 60.Manning GS. The molecular theory of polyelectrolyte solutions with applications to the electrostatic properties of polynucleotides. Q Rev Biophys. 1978;11:179–246. doi: 10.1017/s0033583500002031. [DOI] [PubMed] [Google Scholar]
- 61.Leirmo S, Harrison C, Cayley DS, Burgess RR, Record MT., Jr. Replacement of potassium chloride by potassium glutamate dramatically enhances protein-DNA interactions in vitro. Biochemistry. 1987;26:2095–2101. doi: 10.1021/bi00382a006. [DOI] [PubMed] [Google Scholar]
- 62.Lohman TM, Mascotti DP. Thermodynamics of ligand-nucleic acid interactions. Methods Enzymol. 1992;212:400–424. doi: 10.1016/0076-6879(92)12026-m. [DOI] [PubMed] [Google Scholar]
- 63.Tanford C. Extension of the theory of linked functions to incorporate the effects of protein hydration. J Mol Biol. 1969;39:539–544. doi: 10.1016/0022-2836(69)90143-0. [DOI] [PubMed] [Google Scholar]
- 64.Ha JH, Capp MW, Hohenwalter MD, Baskerville M, Record MT., Jr. Thermodynamic stoichiometries of participation of water, cations and anions in specific and non-specific binding of lac repressor to DNA. Possible thermodynamic origins of the “glutamate effect” on protein-DNA interactions. J Mol Biol. 1992;228:252–264. doi: 10.1016/0022-2836(92)90504-d. [DOI] [PubMed] [Google Scholar]
- 65.Jencks WP. In: Catalysis in Chemistry and Enzymology. Hume NH, King LK, Stork G, Herschbach DR, Pople JA, editors. McGraw- Hill, Inc; New York: 1969. pp. 358–392. [Google Scholar]
- 66.Collins KD, Washabaugh MW. The Hofmeister effect and the behaviour of water at interfaces. Q Rev Biophys. 1985;18:323–422. doi: 10.1017/s0033583500005369. [DOI] [PubMed] [Google Scholar]
- 67.Parsegian VA. Hopes for Hofmeister. Nature. 1995;378:335–336. [Google Scholar]
- 68.Baldwin RL. How Hofmeister ion interactions affect protein stability. Biophys J. 1996;71:2056–2063. doi: 10.1016/S0006-3495(96)79404-3. [DOI] [PMC free article] [PubMed] [Google Scholar]
- 69.Hofmeister F. On the understanding of the effect of salts. Second report. On regularities in the precipitating effect of salts and their relationship to their physiological behavior. Naunyn-Schmiedebergs archive fuer Experimentelle Pathologie und Pharmokologie (Leipzig) 1888;24:247–260. [Google Scholar]
- 70.Leberman R, Soper AK. Effect of high salt concentrations on water structure. Nature. 1995;378:364–366. doi: 10.1038/378364a0. [DOI] [PubMed] [Google Scholar]
- 71.Hribar B, Southall NT, Vlachy V, Dill KA. How ions affect the structure of water. J Am Chem Soc. 2002;124:12302–12311. doi: 10.1021/ja026014h. [DOI] [PMC free article] [PubMed] [Google Scholar]
- 72.Dill KA, Truskett TM, Vlachy V, Hribar-Lee B. Modeling water, the hydrophobic effect, and ion solvation. Annu Rev Biophys Biomol Struct. 2005;34:173–199. doi: 10.1146/annurev.biophys.34.040204.144517. [DOI] [PubMed] [Google Scholar]
- 73.Lovrien R, Sturtevant JM. Calorimetric determination of the enthalpies of binding of ions to deionized bovine serum albumin. Biochemistry. 1971;10:3811–3815. doi: 10.1021/bi00797a001. [DOI] [PubMed] [Google Scholar]
- 74.Norne JE, Hjalmarsson SG, Lindman B, Zeppezauer M. Anion binding properties of human serum albumin from halide ion quadrupole relaxation. Biochemistry. 1975;14:3401–3408. doi: 10.1021/bi00686a017. [DOI] [PubMed] [Google Scholar]
- 75.Herskovits TT, Cavanagh SM, San George RC. Light-scattering investigations of the subunit dissociation of human hemoglobin A. Effects of various neutral salts. Biochemistry. 1977;16:5795–5801. doi: 10.1021/bi00645a024. [DOI] [PubMed] [Google Scholar]
- 76.Makhatadze GI, Lopez MM, Richardson JM, 3rd, Thomas ST. Anion binding to the ubiquitin molecule. Protein Sci. 1998;7:689–697. doi: 10.1002/pro.5560070318. [DOI] [PMC free article] [PubMed] [Google Scholar]
- 77.McCrary BS, Bedell J, Edmondson SP, Shriver JW. Linkage of protonation and anion binding to the folding of Sac7d. J Mol Biol. 1998;276:203–224. doi: 10.1006/jmbi.1998.1500. [DOI] [PubMed] [Google Scholar]
- 78.Waldron TT, Schrift GL, Murphy KP. The salt-dependence of a protein-ligand interaction: ion-protein binding energetics. J Mol Biol. 2005;346:895–905. doi: 10.1016/j.jmb.2004.12.018. [DOI] [PubMed] [Google Scholar]
- 79.Lundback T, Hard T. Salt dependence of the free energy, enthalpy, and entropy of nonsequence specific DNA binding. J Phys Chem-Us. 1996;100:17690–17695. [Google Scholar]
- 80.Saecker RM, Record MT., Jr. Protein surface salt bridges and paths for DNA wrapping. Curr Opin Struct Biol. 2002;12:311–319. doi: 10.1016/s0959-440x(02)00326-3. [DOI] [PubMed] [Google Scholar]
- 81.Chen J, Smith DL, Griep MA. The role of the 6 lysines and the terminal amine of Escherichia coli single-strand binding protein in its binding of single-stranded DNA. Protein Sci. 1998;7:1781–1788. doi: 10.1002/pro.5560070813. [DOI] [PMC free article] [PubMed] [Google Scholar]