

Abstract
Polyunsaturated fatty acids (PUFAs) have beneficial effects on epileptic seizures and cardiac arrhythmia. We report that ω-3 and ω-6 all-cis-PUFAs affected the voltage dependence of the Shaker K channel by shifting the conductance versus voltage and the gating charge versus voltage curves in negative direction along the voltage axis. Uncharged methyl esters of the PUFAs did not affect the voltage dependence, whereas changes of pH and charge mutations on the channel surface affected the size of the shifts. This suggests an electrostatic effect on the channel's voltage sensors. Monounsaturated and saturated fatty acids, as well as trans-PUFAs did not affect the voltage dependence. This suggests that fatty acid tails with two or more cis double bonds are required to place the negative carboxylate charge of the PUFA in a position to affect the channel's voltage dependence. We propose that charged lipophilic compounds could play a role in regulating neuronal excitability by electrostatically affecting the channel's voltage sensor. We believe this provides a new approach for pharmacological treatment that is voltage sensor pharmacology.
INTRODUCTION
Polyunsaturated fatty acids (PUFAs) have beneficial effects on both epilepsy and cardiac arrhythmia (1,2). However, the molecular mechanism for their action is debated. To explain the effects of PUFAs on voltage-gated ion channels, a number of theories, ranging from unspecific effects on the cell membrane fluidity (3) to specific binding to the channel protein (4–8), have been proposed. In a prior investigation we showed that PUFAs open a voltage-gated K (Kv) channel, the Shaker K channel, by affecting the channel's voltage dependence, and computer simulations showed that this could clearly reduce neuronal excitability (9,10). A possible mechanism is that the PUFAs' negative charge electrostatically activates the Kv channel.
Kv channels are important for setting the resting potential, and regulating the duration and frequency of action potentials. The channels contain a positively charged voltage sensor, S4 (11–13), which induces channel opening on movement (14,15). Even though the exact movement of S4 is still debated, it is generally agreed on that the positive charges in S4 move through the membrane toward the extracellular side (14,16). S4 has also been proposed to be in contact with the lipid bilayer (15,17,18). This suggests that lipophilic substances can have access to the voltage sensor by binding to the lipid bilayer.
In this investigation we explored the molecular mechanism by which PUFAs activate Kv channels. The specific aims were to 1), identify the features of PUFAs important for the Shaker K channel effects; and 2), to present a biophysical model explaining the effects of the PUFAs. Our hypothesis suggests that the lipophilic PUFAs bind to a hydrophobic environment (the lipid bilayer or bilayer/channel interface or possibly to hydrophobic pockets in the channel protein itself) from where they act electrostatically on the voltage sensor and thereby change the voltage dependence of the channel. We call this the lipoelectric hypothesis. Specific features of the PUFAs place the negatively charged carboxyl group close to the voltage sensor. We believe this provides a new approach for pharmacological treatment in which ion channel voltage dependence is electrostatically modulated, that is voltage sensor pharmacology, instead of the more traditional pore block.
MATERIALS AND METHODS
Molecular biology and electrophysiology
All experiments were carried out on the Kv1-type Shaker H4 channel, made incapable of fast inactivation by the Δ6-46 deletion. To measure the gating current we used the nonconducting W434F mutation (19). To investigate the role of surface charges the A419C/F425K/V451K triple mutation was used (20). The cysteine-specific reagent MTSET (Toronto Research Chemicals, Toronto, Canada) was attached to 419C to make the residue positively charged (419C-ET+/425K/451K) giving a channel with a total of three extra positive charges. Site-directed mutagenesis, cRNA synthesis, and cRNA injection into Xenopus laevis oocytes were carried out as described previously (21). The electrophysiological experiments were made 2–6 days after injection. Currents were measured with the two-electrode voltage-clamp technique (CA-1B amplifier, Dagan Corporation, Minneapolis, MN) as described previously (21). The amplifier's capacitance and leak compensation were used and the currents were low-pass filtered at 5 kHz. For gating current measurements the capacitance compensation was done between 0 and +20 mV where the gating-charge movement is saturated. A control solution containing (in mM) 88 NaCl, 1 KCl, 15 HEPES, 0.4 CaCl2, and 0.8 MgCl2 was used. To adjust pH to 7.4, NaOH was added yielding a final sodium concentration of ∼100 mM. All experiments were carried out at room temperature (20–23°C). The holding potential was generally set to −80 mV. Animal experiments were approved by the local Animal Care and Use Committee at Linköping University.
Chemicals
Acetic acid, arachidic acid, arachidic acid methyl ester, butyric acid, 5,8,11,14-all-cis-eicosatetraenoic acid (arachidonic acid), 4,7,10,13,16,19-all-cis-docosahexaenoic acid (DHA), 4,7,10,13,16,19-all-cis-docosahexaenoic acid methyl ester (DHA-me), 5,8,11,14,17-all-cis-eicosapentaenoic acid, 9-cis-octadecenoic acid (oleic acid), methyl 9-cis-octadecenoate (oleic acid-me), 9,12-all-cis-octadecadienoic acid (linoleic acid), 9,12,15-all-cis-octadecatrienoic acid (linolenic acid), and methyl 9,12,15-all-cis-octadecatrienoate (linolenic acid-me) were purchased from Sigma-Aldrich Sweden AB (Stockholm, Sweden). 7,10,13-all-cis-hexadecatrienoic acid was purchased from Larodan Fine Chemicals (Malmö, Sweden) and 9,12-all-trans-octadecadienoic acid (all-trans-linolenic acid) from LabKemi (Stockholm, Sweden). Chemical structures are shown in Fig. 7. Pure fatty acids and methyl esters were dissolved in 99.5% ethanol to a concentration of 100 mM and stored at −20°C until usage. Right before experiments, stock solutions were diluted in pure control solution.
FIGURE 7.

Structure of fatty acids and fatty acid-like compounds used and G(V) shifts for respective compound. All data are for a compound concentration of 70 μM at pH 7.4 (except for data denoted with † that are for compound concentrations of 210 μM). n denotes the number of experiments, and ††, arachidonic acid with 1 μM indomethacin. Error bars indicate SE.
Pure control solution was added to the bath using a gravity-driven perfusion system. All test solutions were added manually to the bath using a glass Pasteur pipette to avoid binding of lipids to the perfusion system. The added volume was large enough to replace the bath solution manifold. In experiments with arachidonic acid, indomethacin (Sigma-Aldrich Sweden AB) was used to prevent conversion of arachidonic acid via the cyclooxygenase pathway. Cells were preincubated for 10 min in control solution containing 1 μM indomethacin and experiments were carried out as described above with the addition of 1 μM indomethacin in all solutions. At this concentration indomethacin itself did not have any effect on the channel activity. For Grammostola spatulata toxin experiments, GsMTx4 (Peptides International, Louisville, KY) was diluted to 0.1 mM in distilled water according to manufactures instructions and diluted to a final concentration of 5 μM in control solution before experiments.
Determination of the effective fatty acid concentration
Fatty acids can be absorbed to the surfaces in the experimental chamber resulting in an effective free fatty acid (FFA) concentration that is considerably lower than the nominal concentration (22). To determine the fraction of fatty acids binding to our Perspex chamber we used radioactively labeled [1-14C] oleic acid. Oleic acid and DHA have been shown previously to be absorbed to the same extent to the walls of an experimental chamber (22) and therefore we regard oleic acid as a good representative for all fatty acids used in this investigation. The following steps were used to determine the fractions: 1), Oleic acid and [1-14C] oleic acid were mixed and dissolved in control solution to final fatty acid concentrations of 30, 100, or 300 μM with appropriate activity level for scintillation measurements. 2), The activity in samples from each solution before application to the chamber was measured with a scintillation counter. 3), The oleic acid solution was added manually to the experimental chamber using the same procedure as for all other experiments. 4), The activity was measured in a sample from the experimental chamber (after possible absorption of oleic acid to the surfaces of the chamber). The percentage of oleic acid bound to the chamber was calculated from the counting rates before and after chamber exposure. 5), This was repeated for the other oleic acid concentrations with thorough washing of the chamber between the applications. For all tested oleic acid concentrations, 28%–32% of the fatty acids were bound to the chamber. This means that the effective FFA concentration is 30% lower than the nominal concentration, independent of the original fatty acid concentration. All fatty acid and methyl ester concentrations mentioned in this work have been corrected for fatty acid binding to the chamber and are thereby the effective concentrations, i.e., 70% of the nominal concentrations.
Electrophysiological analysis
The steady-state current, I, was measured every 5 mV at the end of the stimulation pulse (60–90 ms after the onset of the pulse) and the K conductance, G, was calculated as G(V) = I(V)/(V−VK), where V is the absolute membrane voltage and VK is the reversal potential for the K ion (−80 mV). For FFA in the concentration range 2.1–70 μM no current block at positive voltages but a leftward shift of the G(V) curve was seen. This shift could easily be determined by sliding the control curve to overlap the test curve, but to standardize the measurement of the shift of G(V) curves the following strategy was used: data points were connected by fitting the following Boltzmann-like equation to the data
 |
(1) |
where V50 is the midpoint and s the slope factor of the standard Boltzmann curve. n is an exponent making the equation to better fit the data. n was found to be between 3 and 8 but the exact value was not of interest because the equation was only used to get a smooth connection of the data points. The shift was measured at 10% of the maximum conductance in control solution because this level is less sensitive to possible alterations of G(V) max due to for instance endogenous currents (activated at positive voltages) and voltage-dependent block by intracellular ions (e.g., Mg2+ and Na+). Before fitting Eq. 1 to the data, declining values at positive voltages were excluded to obtain the best possible fit. Fig. 1 shows an example of the shift measurement. Eicosapentaenoic acid (70 μM) shifts the curve −5.8 mV along the voltage axis. As control data we used mean values of the control before the test solution and the recovery after the test solution. The continuous lines in Fig. 1 are best fits of Eq. 1. In all other G(V) curves shown in this study the data points are connected with a line. For nominal concentrations >100 μM (effective concentrations >70 μM) a current reduction was often seen and therefore we normalized test (DHA with or without Mg2+) G(V) to control G(V).
FIGURE 1.

Procedure for measuring the shift of the G(V) curve. Data for control (○), 70 μM eicosapentaenoic acid (□), and recovery (○) are shown together with Boltzmann raised to the power of n curves (continuous lines; Eq. 1). The area of interest for measurement is enlarged in the inset. The shift was measured at 10% of the maximum conductance.
To quantify the concentration dependence of the DHA-induced G(V) shift, ΔV, the following equating was used
 |
(2) |
where ΔVmax is the maximal shift, c0.5 is the concentration causing 50% of maximal shift, and c is the concentration of DHA.
To make sure that the lipophilic substances reach the ion channels and do not get stuck in the vitelline layer surrounding the Xenopus oocytes, we tested the effects on oocytes with the vitelline layer mechanically removed. The shifts in the G(V) curve were almost identical with (70 μM DHA: −4.4 ± 0.9 mV (n = 5); 210 μM DHA: −8.0 ± 0.7 mV (n = 7)) and without (70 μM DHA: −4.8 ± 1.9 mV (n = 3); 210 μM DHA: −7.8 ± 2.1 mV (n = 4)) the vitelline layer, suggesting that the vitelline layer did not affect the experiments. Similar tests were also carried out with the monounsaturated oleic acid with no effects. Because removal of the vitelline layer makes the oocytes fragile we kept it intact throughout the rest of the experiments.
Statistical analysis
Average values are expressed as mean ± SE. Statistical analyses on mean values for G(V) shifts were carried out using two-tailed one sample t-test where the mean values were compared with a hypothetical value of 0. For comparison between shifts of fatty acid and corresponding methyl ester two-tailed unpaired t-test was used. For comparison between shifts of activation and steady-state inactivation for DHA two-tailed paired t-test was used. p < 0.05 is considered as significant.
RESULTS
DHA affects ion channel voltage dependence: the lipoelectric hypothesis
As reported in a previous study (9,10) the ω-3 PUFA docosahexaenoic acid (DHA) increased the Shaker K channel current substantially at negative voltages by shifting the conductance versus voltage, G(V), curve in negative direction along the voltage axis (Fig. 2 A). The mean G(V) shift in physiological pH = 7.4 was −4.4 ± 0.9 mV for 70 μM DHA, and −8.0 ± 0.7 mV for 210 μM DHA. The maximum shift was found to be −9.6 mV and 50% shift was caused by 79 μM DHA (10) (Fig. 3 D). DHA (21 μM), which was estimated to be slightly lower than the increase in PUFA concentration in cerebrospinal fluid during ketogenic diet treatment, shifted the G(V) curve −2.3 ± 0.3 mV (n = 3) along the voltage axis. This was a small but robust shift that could prevent repetitive firing in computer simulations (9,10). In this study we sought the mechanism for the shift and we therefore used relatively high fatty acid concentrations (mostly 70 μM) that have large effects on the channels' voltage dependence. This facilitates the comparison between the effects for different compounds. However, we do not assume that the concentrations used in this work are to be found clinically during ketogenic diet treatment. Another reason for using 70 μM as a standard concentration is that this concentration is close to the midpoint of the dose-response curve for DHA and therefore any difference in effect for different substances should be most readily identified at this concentration.
FIGURE 2.

The importance of the charge for shifting the G(V) curve. (A) 210 μM DHA (□) shifted the control G(V) curve (○) in negative direction. The scaled DHA curve (▪) overlaps the control curve shifted −6.0 mV (•). Mean shift is −8.0 ± 0.7 mV (n = 7). (B) Addition of a methyl group to the carboxyl end abolished the shift (1.1 ± 0.8 mV, n = 5). Control (○), DHA-me (□). (C) The positively charged spider toxin GsMTx4 (□) shifted the control G(V) curve (○) in positive direction (+5.7 ± 0.3, n = 4). (D) A summary of the effects of DHA, DHA-me, and GsMTx4 on the channel's voltage dependence. Error bars indicate SE.
FIGURE 3.

pH dependence of the DHA effects. (A) 70 μM DHA at pH 9.0 increased the current at −40 mV 20-fold. (B) The corresponding G(V) curve was shifted −20.2 (mean shift −18.0 ± 1.4 mV, n = 9). Control (○), DHA (□). (C) DHA-me did not shift G(V) at pH 9.0. Control (○), DHA-me (□). (D) Shift data for DHA at pH 6.5 (•), pH 7.4 (○), pH 9.0 (□), and pH 10.0 (▪). Continuous lines show dose-response fits (Eq. 2) for pH 7.4 and 9.0. pH 7.4: ΔVmax = −9.6 mV, c0.5 = 79 μM; pH 9.0: ΔVmax = −19.7 mV, c0.5 = 5.5 μM. Error bars indicate SE. Small error bars are covered by symbols.
We also found that the opening of the channel was faster, the closing was slower, and the steady-state slow inactivation curve was shifted in negative direction along the voltage axis by the same amount as the G(V) curve by DHA (nonsignificant difference with paired t-test; mean −8.2 ± 1.0 (activation) and −6.1 ± 0.4 (inactivation) for 210 μM DHA; n = 4). These effects on all of the channel's voltage-dependent parameters suggest that DHA causes an electrostatic effect on the channel's voltage sensor.
DHA has two main structural elements (Fig. 2 A): 1), a lipophilic acyl chain that is incorporated easily into lipid bilayers; and 2), a carboxyl group at one end of the chain that is either protonated (uncharged), or deprotonated (negatively charged) depending on pH. From these structural features and the observed effect of DHA on the channel's voltage dependence a working hypothesis was suggested: the acyl chain is incorporated into the lipid bilayer in the vicinity of the ion channel or into hydrophobic pockets at the lipid bilayer/ion channel interface or channel protein. This places the negatively charged carboxyl group close to the ion channel where it electrostatically affects the channel, possibly by attracting the positively charged voltage sensor, S4, toward the extracellular side and thereby activating the channel. To test this lipoelectric hypothesis two critical factors were investigated: 1), the electrostatic effect of the negative charge; and 2), the structural requirements of the acyl chain. We first studied the electrostatic effect by a series of experimental tests.
The carboxylate charge is crucial for shifting the G(V) curve along the voltage axis
The importance of the FFA's negative charge was directly tested by eliminating the charge. This is done by esterifying the carboxyl group to its methyl ester, which gives an uncharged compound highly similar to the original fatty acid (compare the structure of DHA and DHA-me in Fig. 2). Fig. 2 B shows that the methyl ester of DHA did not shift the G(V) curve (mean shift 1.1 ± 0.8 mV, n = 5).
Another way to test the importance of the charge would be to use a positively charged PUFA to test whether it shifts the G(V) in positive direction. Unfortunately, no such PUFA is commercially available. Instead, we explored the effect of another type of charged lipophilic substance. Recently, a toxin from the Chilean rose tarantula Grammostola spatulata, was shown to affect stretch-activated ion channels by binding to the lipid bilayer and not through direct interaction with the channels (23). The toxin, GsMTx4, has a net charge of +4 elementary charges at pH 7.5 (24), suggesting that GsMTx4 could act electrostatically on Kv channels after incorporation into the membrane. As expected from our lipoelectric hypothesis, GsMTx4 shifted the G(V) curve in positive direction along the voltage axis (Fig. 2 C), +5.7 ± 0.3 mV (n = 4) for 5 μM GsMTx4. An alternative interpretation of the data is that the shift is caused by an allosteric interaction between the toxin and the voltage sensor. Other tarantula toxins like hanatoxin and SGTx1 have also been shown to partition into membranes and are suggested to interact directly with Kv channels (25). A direct toxin-channel interaction of these toxins is supported by the finding that the L and D enantiomers do not show the same effect on the channels. However, GsMTx4 differs from these toxins by having both the L and D enantiomers active on stretch-activated channels speaking against a direct interaction between the toxin and the channel for this specific toxin (23). Furthermore, residues shown to be important for SGTx to bind to a Kv channel are all different in GsMTx4 suggesting no specific toxin-channel interaction (26). We therefore believe that GsMTx4 can be used as a substitute for a positively charged PUFA. It should be noted, however, that little is known about the nature of the GsMTx4–Shaker channel interaction. Fig. 2 D summarizes the G(V) shifts for DHA, DHA-me, and GsMTx4. Thus, the negative charge of the carboxyl group is essential for shifting G(V) in negative direction.
The potency of DHA changes with pH
If the charge of the carboxyl group is important for shifting G(V), then increased pH could possibly increase the effect because a larger fraction of fatty acids would be deprotonated. To test this we investigated the DHA-induced G(V) shift at different pH. Fig. 3 A shows that the current increased more than 20-fold at −40 mV in the presence of 70 μM DHA at pH 9.0. The corresponding G(V) curve is shifted −20.2 mV (Fig. 3 B, mean −18.0 ± 1.4 mV, n = 9). At pH 9.0, the shift was saturated already at 21 μM DHA (−17.0 ± 0.3 mV, n = 5), which seemed to be the maximum effect because neither 210 μM DHA at pH 9.0 nor 70 μM at pH 10.0 induced larger shifts. At pH 6.5 DHA had no effect. DHA-me did not induce any G(V) shift at pH 9.0 indicating that the negative charge of the fatty acid is central for the increased shifts at higher pH (Fig. 3 C). Data for all different DHA concentrations and pH values are shown in Fig. 3 D. The dose-response curves for DHA at pH 9.0 and 7.4 showed that 1), the maximum G(V) shift was more than doubled; and 2), the dose-response curve was shifted left along the concentration axis by a factor of ∼10. The increased maximum shift can be explained by a larger fraction of the FFAs being deprotonated whereas the leftward shift suggests that the affinity for the interaction between the FFA and the ion channel is increased.
To explore the pH dependence, we used a simple four-state model (Fig. 4 A). Both the ion channel and the FFA can assume two states where the transition between the states is pH dependent. At a low pH the ion channel is in a conformation preventing FFA interaction (State 1). When pH is increased the ion channel changes its conformation, which allows for FFA interaction (State 2). At this point the FFA can interact either in a protonated form (State 3) or in a deprotonated form (State 4). It is only in its deprotonated form the FFA affects the channel's voltage dependence. In these calculations we used a combined binding constant, KD, for both closed and open channels (with either protonated or deprotonated FFAs). However, it should be noted that because the binding of a charged FFA to the channel promotes opening of the channel, the binding should be stronger to the open channel than to the closed channel. The apparent KD value used in these calculations reflects an average binding to open and closed channels. We refrained from using a more detailed model with more free parameters (see Appendix for more comments).
FIGURE 4.

A simple four-state model describing the pH dependence of the FFA effects. (A) At low pH the ion channel conformation prevents FFA interaction (State 1). Increased pH induces conformational changes making FFA interaction possible (State 2). The FFA can interact with the channel in a protonated form (State 3) or a deprotonated form (State 4). The FFA can only change the channel's voltage dependence in State 4. (B) Global least-square fitted solutions for Eq. 3 shown as continuous lines. ΔVMAX = −20.5 mV, pKa,FFA = 7.4, KD = 3.5 μM, and pKa,rec = 8.8. (C) The mutation line shows the predicted dose-response relationship from Eq. 3 for the triple mutation 419C-ET+/425K/451K at pH 7.4. Experimental data for the triple mutation are plotted as mean (Δ) ± SE. Small error bars are covered by symbols.
In the model, there are four unknown parameters: a pKa for the interaction site (pKa,rec), a pKa for the FFA (pKa,FFA), the lowest possible combined dissociation constant for the interaction between the FFA and the channel (KD), and the maximum possible G(V) shift of the FFA (ΔVMAX). To determine the parameter values an equation was developed from the model (Appendix):
 |
(3) |
[L] is the concentration of FFA. The best simultaneous fit to all data gives ΔVMAX = −20.5 mV, apparent pKa,FFA = 7.4, KD = 3.5 μM, and apparent pKa,rec = 8.8. The solutions for this equation for pH 6.5, 7.4, 9.0, and 10.0 are shown in Fig. 4 B. The surprisingly high apparent pKa for the FFA (close to physiological pH) suggests that even small changes in pH could affect the efficacy of the FFAs. The high pKa value is in line with previous reports that FFAs incorporated in a phospholipid bilayer or a monolayer has a pKa around 7.5 or even more, whereas it is several pH steps smaller when bound to albumin (27,28). Alternative experiments with a charge not titrated in the physiological range (e.g., sulfonate) were not possible because no sulfonated PUFA is available commercially.
Because FFAs may form micelles at the highest concentrations (see Discussion) we also explored the model when excluding all data >70 μM. The parameter values were not very much changed (ΔVMAX = −20.2 mV, apparent pKa,FFA = 6.8, KD = 1.4 μM, and apparent pKa,rec = 9.5) and most importantly, the outcome was not changed in the predictions for changes in local pH explored in the following section.
Channel-specific effects depend on changes in local pH
We have shown that DHA shifts the G(V) curve in negative direction along the voltage axis depending on the charge of the FFA, which in turn depends on the pH. The pH value that matters is the local pH close to the channel and theoretically different ion channels can have different local pH values depending on the local set of fixed surface charges. For instance, positive charges close to the FFA (which must be close to the voltage sensor to cause the effects) repel hydrogen ions and increase the local pH, which would deprotonate the FFA and increase the shift. The change in local pH (ΔpH) depends on the change in local (surface) potential (Δψ0) as
 |
(4) |
where F, R, and T have their normal thermodynamic meanings. This suggests that the PUFA- induced effect can be channel specific, depending on the channel-specific set of surface charges, implying that different channels can be specific targets for the lipoelectric compounds. Thus, to quantitatively explore the role of the surface charges and local pH we used a mutated Shaker K channel. In a previous study (20) we found that a triple mutation where residues at positions 419, 425, and 451 were made positive, changed the local surface potential sensed by the voltage sensors with +16 mV, corresponding to a local pH change of 0.3.
At 21 μM DHA the DHA-induced G(V) shift for the triple-positive mutant is double that of the wild-type. A summary of the results for the triple 419C-ET+/425K/451K-mutation is shown in Fig. 4 C. The data coincide well with the predicted effect (mutant line in Fig. 4 C); the prediction was made for pH 7.7, which should reflect the increase in local pH of 0.3 for the triple-positive mutant, and with the assumption that the affinity for the FFA is not affected by the mutation per se. A very similar prediction was found for the model excluding concentrations >70 μM (data not shown), which not only corroborates the model for the FFA effects but also suggests that different channels with different surface charge structures (29) are differently sensitive to FFAs.
DHA increases the screening capacity of a divalent metal ion
Another way to test if DHA is shifting G(V) by electrostatically affecting the channel's voltage sensor is to study the screening capacity of divalent cations. Mg2+ is suitable for screening experiments because they seem to affect Kv channels mainly by charge screening and not through pore block or nonelectrostatic effects (30). By increasing the extracellular concentration of Mg2+ the negative surface charges will be screened and the local potential experienced by the voltage sensor changed. This change is seen as a shift in the G(V) curve. A DHA-induced increase in the negative surface charges near the ion channel will attract more Mg2+ to the cell surface, exerting a larger screening effect seen as an increased G(V) shift. Fig. 5 A shows that 20 mM Mg2+ (in the form of MgCl2) added to the extracellular side shifted G(V) in positive direction along the voltage axis. When the membrane was pretreated with 210 μM DHA, the Mg2+-induced shift increased (Fig. 5 B). The increase is small (1.8 ± 0.3 mV, n = 10) but statistically significant (p = 0.0005). As a negative control we tested if DHA-me, which did not shift G(V), affected the Mg2+-induced shift. DHA-me did not increase the screening capacity of Mg2+. The triple-positive mutant showed increased screening capacity compared to wt Shaker (ΔΔVMg = 2.2 ± 0.4, n = 6). The expected magnitude of the increasing screening capacity of divalent cations can be calculated using the Grahame equation, which expresses how the surface charge density (σ) is related to the surface potential (ψ):
 |
(5) |
FIGURE 5.

DHA affects the screening effect of a divalent metal ion. (A) Increased extracellular Mg2+ concentration (20 mM) shifted G(V) in positive direction by screening the negative surface charges. (B) DHA increased the screening effect (ΔΔVMg is 1.8 ± 0.3 mV, n = 10). (C) ΔΔVMg plotted versus DHA (□) and DHA-me (○) shifts for wt Shaker and DHA for the triple-positive mutant (▪) (data for 210 μM). Error bars show SE. pH = 7.4. The continuous line shows the solution to the Grahame equation (Eq. 5).
where R, T, and F have their normal thermodynamic meanings, ɛr is the dielectric constant of the medium, ɛ0 the permittivity of free space, and ci the bulk concentration and zi the valence of the ith ionic species in the solution. If DHA increases the negative surface charge density it will change both the surface potential and the screening capacity. Fig. 5 C shows lipid-induced G(V) shifts plotted versus changes in Mg2+-induced shifts for 210 μM DHA and 210 μM DHA-me. The continuous line is the prediction of the Grahame equation for smeared surface charges. The data for DHA-me (circle) falls expectedly close to origin. The DHA data for both wt Shaker and the triple-positive mutant (open and filled squares respectively) for ΔΔVMg is significantly different from 0 mV but does not fully reach the prediction. This probably depends on the protonation of the carboxyl group of DHA. Increasing Mg2+ makes the surface potential more positive (approximately +15 mV), and consequently the local pH is increased (by ∼0.26; Eq. 4). This deprotonates the FFA to be more negative, which shifts G(V) in the negative direction, counteracting the attempts by Mg2+ to shift in positive direction. Taken together, this makes ΔΔVMg smaller than expected if FFA was not protonable.
Which activation steps are affected by FFAs?
Activation of voltage-gated ion channels proceeds in several steps (31–36). At least two distinct components have been identified. First, there are independent movements of the channels four positively charged voltage sensors, S4s, toward the extracellular side of the membrane. Second, this is followed by concerted steps including the opening step. The second component is relatively unexplored but is believed to involve a simultaneous rearrangement of all of the channels four subunits that will lead to channel opening (32,37). During activation there is a movement of gating charges through the membrane toward the extracellular side, which gives rise to a gating current. Gating currents can only be measured when the channel is nonconducting because gating currents are far smaller than typical ionic currents. Approximately 80% of the gating charges are carried by the first gating component and the remaining ∼20% are carried by the second component (36). Changes in the voltage dependence of the gating current therefore mainly reflect changes of the first gating component of activation.
To explore which activation step is affected by FFAs we measured gating currents from the nonconducting channel mutant W434F. Fig. 6 A shows gating currents at −20 mV in control and in 70 μM DHA at pH 9.0 (holding potential: −80 mV, off-gating step to −80 mV). DHA speeds up the on-gating current (representing channel activation) and slows down the off-gating current (representing channel deactivation) as expected from pure electrostatic effects. Fig. 6 B shows that 70 μM DHA shifts the Q(V) curve in negative direction along the voltage axis. However, the shift was only approximately one-third of the shift for G(V) under similar conditions (Fig. 6 C).
FIGURE 6.

Effect of DHA on the gating currents. (A) On and off-gating currents for control (black trace) and 70 μM DHA (gray trace) at pH 9.0. DHA speeds up the on-gating current (extended timescale in inset) and slows down the off-gating current. The holding potential was −80 mV, the on-gating step to −20 mV, and the off-gating step to −80 mV. (B) 70 μM DHA (□) at pH 9.0 shifted the control Q(V) curve (○) in negative direction (−6.3 ± 0.5 mV, n = 7). Dashed line shows control curve shifted −5.0 mV. (C) The shift of Q(V) is ∼1/3 of the G(V) shift.
If the FFAs primarily affect the first gating component the gating charge versus voltage, Q(V), curve should be shifted left along the voltage axis whereas the G(V) curve should be relatively unchanged because the ion channel opens when the second step is completed. We would therefore expect a larger effect on the Q(V) than on the G(V) curve. If FFAs primarily affect the second component, the G(V) curve should instead be more affected than the Q(V) curve. The larger effect of 70 μM DHA seen on the G(V) than on the Q(V) curve suggests that the opening step (the second gating component) is more affected than the early transitions by the FFA.
Two or more cis double bonds in the acyl chain are necessary to shift G(V)
The second critical factor in the lipoelectric hypothesis is the structure of the acyl chain. Ten additional fatty acids or fatty acid-like compounds with different acyl chain lengths and different numbers, position, and geometry of double bonds were tested to identify structural features important for the lipoelectric effects.
Fig. 7 shows the structures of the tested compounds together with their induced G(V) shifts. Five acids with DHA-like G(V) shifts were identified, namely eicosapentaenoic acid, arachidonic acid, linolenic acid, hexadecatrienoic acid, and linoleic acid. These are the acids with most structural similarity to DHA by having two or more methylene-interrupted double bonds at either the ω-3 or the ω-6 position. The experiments with arachidonic acid were carried out together with 1 μM indomethacin to avoid metabolism by cyclooxygenase (see Material and Methods). The importance of the acyl-chain length is difficult to interpret because all PUFAs gave similar G(V) shifts even though their chains ranged from 16 to 22 carbons. This indicates that the length of the PUFAs is less important than the charge and number of double bonds. The monounsaturated oleic acid and the shorter saturated acetic and butyric acid did not shift the G(V) curve. The saturated arachidic acid induced a small G(V) shift in the positive direction along the voltage axis. Therefore, two or more double bonds seem to be required to shift G(V) in negative direction. Interestingly, any two double bonds are not enough to change the channels voltage dependence; the double bonds must be in cis geometry. Substitution for trans double bonds almost abolished the shift of the G(V) curve (Fig. 7) showing that the cis geometry is required to clearly shift G(V). Fatty acids with trans double bonds will assume a less bent conformation of their acyl chain, similarly to that of a saturated fatty acid. A structure having cis double bonds may thus be necessary for placing the negative charge of the free carboxyl group near the ion channel and thereby facilitate electrostatic interactions.
Further experiments supporting the lipoelectric hypothesis
If the lipoelectric hypothesis presented here is generally applicable, esterification of any cis-PUFA should eliminate leftward G(V) shifts, and esterification of monounsaturated or saturated fatty acids would not affect G(V) shifts. Fig. 7 presents several such experiments supporting the lipoelectric hypothesis. Adding a methyl group to the polyunsaturated linolenic acid completely abolished the clear G(V) shift. Adding a methyl group to the monounsaturated oleic acid did not induce any G(V) shift, and adding a methyl group to the saturated arachidic acid did not change the G(V) shift but persisted the small but significant G(V) shift in positive direction found for the arachidic acid. All these experiments support the lipoelectric hypothesis and show that the PUFAs do not shift G(V) by possible non electrostatic mechanisms caused by conformational changes induced by the removal of the negative charge.
DISCUSSION
In this study we have shown that cis ω-3 and cis ω-6 fatty acids shift the voltage dependence of a K channel in the negative direction along the voltage axis whereas saturated and monounsaturated acids do not shift. The charge of the PUFA is necessary for the shift and the features of the acyl chain probably place the carboxyl group of the PUFA in a suitable position close to the channel's voltage sensor. Arguments for an electrostatic effect of the carboxyl group are that 1), removal of the charge (the methyl esters) abolished the shift; 2), the charged PUFA affected surface-charge screening; and 3), pH had a pronounced effect on the PUFA but not on the methyl esters. Furthermore, the lack of effects for both oleic acid (one double bond) and its methyl ester suggests that it is not the methylation per se that shifts G(V) in positive direction. Arguments for specific features in the acyl chain are that 1), at least two double bonds are needed; and 2), they must be of cis geometry. Gating-current measurements suggest that the PUFAs mainly affect the concerted opening step and to less degree the early transitions during channel activation.
Previous investigations of PUFAs on ion channels
Previous studies of PUFAs on ion channels have focused mainly on nonelectrostatic mechanisms. Both channel-specific (7,8,38) and channel-unspecific (3) nonelectrostatic interactions have been suggested for several voltage-gated ion channels. For instance, PUFA binding to the lipid bilayer changes the membrane fluidity, and altered elasticity can be a mechanism for ion channel regulation (22,39). Extensive work by Andersen et al.(40) shows that changes in membrane properties can regulate gramicidin and ion channel activity.
However, pure distortion of the lipid bilayer does not seem to be a likely mechanism for the effects reported in this study. They are more likely explained by the following electrostatic interactions: 1), The two types of lipophilic substances investigated in this study (GsMTx4 and PUFAs) had opposite effects–the G(V)s were shifted in different directions. In the gramicidin channel, where the bilayer effect is most important, the activity is affected in the same direction by the oppositely charged molecules (22,23). 2), The PUFA methyl esters do not show any effect on the channels voltage dependence even though their acyl chain is identical to the corresponding PUFAs. 3), The increased sensitivity of the triple-mutated channel to PUFAs and the changes in Mg2+-induced shifts are explained more easily by an electrostatic mechanism rather than a lipid-bilayer distortion. Overall, our study suggests that the charge of the fatty acid is crucial.
In other experiments, a role of the negative charge has also been observed (4–6,41), and mechanisms involving channel-specific electrostatic interactions have been discussed (4,5,42). We believe in a more general, unspecific interaction because of the similar effect of PUFAs on many different channels: leftward shifts in activation and/or inactivation have been reported for other K channels (5,38) and also for Na channels (3,8,43,44) and Ca channels (8,45). Also, the interaction shows a great tolerance to variations in acyl chain length and number of double bonds among PUFAs. To our knowledge, this lipoelectric hypothesis is the first model where PUFAs electrostatically affect voltage-gated ion channels by binding to a hydrophobic environment. At this point we can not distinguish between if the PUFAs incorporate into the lipid bilayer, the border between membrane and channel, or into hydrophobic pockets on the channel protein.
Properties of PUFAs incorporated in the lipid membrane
In this study, we propose that the PUFA incorporates into the outer leaflet of the lipid bilayer where it exerts its effect on the voltage sensor. The PUFAs probably also flip-flop to the inner leaflet but apparently, this does not counteract the electrostatic effect in the outer leaflet. The G(V) shifts occur within seconds and the effect does not change (reverse) with time. (No further effects were seen up to 30 min after application). The exact binding site to the channel (if any) is not known and has to await future mutational studies, but we assume that the PUFA bind relatively close to the voltage sensor even though the distance is complicated to calculate partly because we do not know the number of bound PUFAs per voltage sensor. However, we showed that the effect of PUFA is more pronounced if positively charged residues are introduced close to the voltage sensor, suggesting channel-specific effects. For instance, Kv2 and 3 type channels have a more positive surface potential and should be more sensitive to PUFAs than Kv1-type channels (29). Different sensitivity to PUFAs depending on the structure of the ion channel surface may also be the reason why the estimated c0.5 value for the Shaker K channel is higher than that reported for some other channels.
The flexibility of the acyl chain may be the critical property responsible for orienting the PUFAs in a way that allow them to affect the channels electrostatically. cis double bonds found in PUFAs have been reported to give the chains unexpected flexibility and DHA undergoes rapid transitions between different conformations where the transitions are fastest near the methyl end (46). A less flexible saturated or monounsaturated fatty acid may place the negative charge too far away from the ion channel to be able to exert an electrostatic effect. An increase in PUFA potency with the degree of unsaturation in K (47) and Na channels (44) has indeed been reported. This hypothesis also fits well with the work done by Feller and collaborators showing that PUFAs interact more intimate with the rhodopsin protein that saturated chains do (48,49).
Possible interference from micelle formation
At high fatty acid concentrations micelles will be formed. However, we believe that in most of our experiments the fatty acids are still free in the solution. The estimated critical micellar concentration (CMC) found in the literature is around 60–150 μM for different unsaturated fatty acids (50), but, depending on the experimental conditions, both lower (51) and higher concentrations (52) have been reported. The fact that 210 μM DHA had larger effects on the channels than 70 μM at pH 7.4 suggests that CMC > 70 μM. The evaluation of the four-state model is sensitive to a possible underestimation of the concentration FFA due to micelle formation. However, as mentioned in the Results section, the calculations and conclusions are only marginally affected when data from concentrations >70 μM are removed.
The CMC for a fatty acid depends on properties like the acyl chain length and the degree of saturation. Therefore it is possible that the amount of available FFA is lower for a saturated or monounsaturated fatty acid than for a PUFA at a given concentration. An alternative interpretation of the lack of effect from the monounsaturated oleic acid could then be that two or more cis double bonds are required not for the flexibility of the acyl chain but for the adequate availability of the fatty acid. However, the CMC for oleic acid and linoleic acid has been reported to differ only by a factor of 2 in one study (51), whereas another suggests that there is almost no difference in CMC for oleic acid, linoleic acid, arachidonic acid, as well as DHA (50). In contrast to this, the potency between oleic acid and the PUFAs with respect to the G(V) shifts differs by a factor of >10 (concentrations above 7 μM DHA shifts the G(V) curve, whereas 70 μM oleic acid has no effect). Furthermore, the CMC for linoleic and linolenic acid has been reported to differ by a factor of 4 (51) but in this study there is no difference in effect between them. The poor correlation between CMCs and the ability to affect the channel's voltage dependence suggests that the difference between cis-PUFAs and other fatty acids mainly depends on the flexibility of the acyl chain and not on variations in CMCs.
Physiological and pharmacological implications
Even though the physiological concentrations of PUFAs are low, we have previously estimated that the PUFA concentration in the cerebrospinal fluid increases up to 80 μM during treatment with the antiepileptic ketogenic diet and that an even lower DHA concentration (21 μM) have significant effects on the Shaker K channel (10). Furthermore, the clear pH dependence discovered in this investigation also suggests a possible potentiating mechanism. Finally, excitability can be extremely sensitive to small G(V) shifts (9,10). We thus suggest that the mechanism described in this investigation is a possible candidate in the treatment of epilepsy as well as other hyperexcitability diseases like cardiac arrhythmias. Antiarrhythmic effects of PUFAs (8) have been reported in both cardiac myocytes (53,54) and animal models (2,54). Interestingly, the structural requirements identified for PUFA-induced antiarrhythmic effects is also similar to what we have proposed here; an acyl chain with two or more double bonds in combination with a free carboxyl group (2). We thus suggest that the lipoelectric alterations in the voltage dependence of ion channels can possibly become a common future pharmacological application for PUFAs in the treatment of both epilepsy and arrhythmia.
Acknowledgments
We thank Peter Larsson, OHSU, for helpful comments on the manuscript. This study was supported by grants from the Swedish Research Council (Grant Nos. 05914 and 13043), Linköping University, the County Council of Östergötland (No. 8593), and the Swedish Heart-Lung Foundation.
APPENDIX: MODEL FOR THE INTERACTION BETWEEN THE FREE FATTY ACID AND THE ION CHANNEL
To explore the pH dependence of the DHA effects we created a model describing the expected G(V) shifts at different free fatty acid (FFA) concentrations and pH:
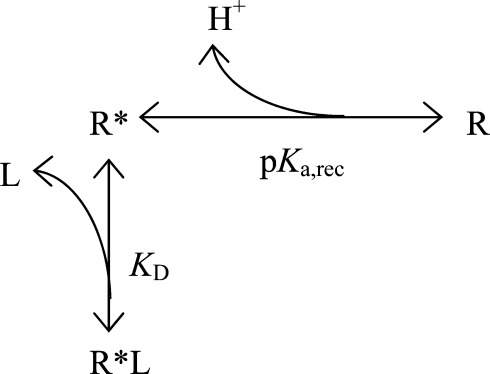 |
We consider the interaction site (receptor) to have two possible configurations, one that can bind the FFA (R*) and one that cannot bind (R). The transition between the two configurations is pH-dependent where the binding-resistant configuration R is present at lower pH. KD is the dissociation constant for the binding reaction and L is the ligand (=FFA).
The relations between the receptor states are:
 |
 |
and the fraction of bound receptors (f) is:
 |
The shift for a bound FFA is:
 |
where ΔVMAX is the maximal shift, and pKa,FFA is the pKa value for the FFA.
The expected shift of the G(V) curve for a specific FFA concentration and pH is the product of the shift for each FFA and the fraction of bound receptors:
 |
(A1) |
It should be noted that the R*L state is a summed representation of State 3 and State 4 in Fig. 4 A. The binding of a negatively charged FFA is stronger to an activated channel with S4 in its upper position (as shown in State 4) than to a resting channel (as shown in State 3). The KD value in both this Appendix and in Fig. 4 A represents a combined binding to State 3 and 4. An expanded binding scheme includes eight states–the four states in Fig. 4 A in both the activated and resting configurations, with distinct transitions between States 2 and 3 and between States 2 and 4. Such an expanded scheme does not add more information to the calculations in Fig. 4, B and C. Therefore, we use the simpler model developed in this Appendix.
Editor: Toshinori Hoshi.
References
- 1.Lefevre, F., and N. Aronson. 2000. Ketogenic diet for the treatment of refractory epilepsy in children: a systematic review of efficacy. Pediatrics. 105:E46. [DOI] [PubMed] [Google Scholar]
- 2.Leaf, A., Y. F. Xiao, J. X. Kang, and G. E. Billman. 2003. Prevention of sudden cardiac death by n-3 polyunsaturated fatty acids. Pharmacol. Ther. 98:355–377. [DOI] [PubMed] [Google Scholar]
- 3.Leifert, W. R., E. J. McMurchie, and D. A. Saint. 1999. Inhibition of cardiac sodium currents in adult rat myocytes by n-3 polyunsaturated fatty acids. J. Physiol. 520:671–679. [DOI] [PMC free article] [PubMed] [Google Scholar]
- 4.Kang, J. X., and A. Leaf. 1996. Evidence that free polyunsaturated fatty acids modify Na+ channels by directly binding to the channel proteins. Proc. Natl. Acad. Sci. USA. 93:3542–3546. [DOI] [PMC free article] [PubMed] [Google Scholar]
- 5.McKay, M. C., and F. W. Jennings. 2001. Linoleic acid both enhances activation and blocks Kv1.5 and Kv2.1 channels by two separate mechanisms. Am. J. Physiol. 281:1277–1284. [DOI] [PubMed] [Google Scholar]
- 6.Bendahhou, S., T. R. Cummins, and W. S. Agnew. 1997. Mechanism of modulation of the voltage-gated skeletal and cardiac muscle sodium channels by fatty acids. Am. J. Physiol. 272:C592–C600. [DOI] [PubMed] [Google Scholar]
- 7.Hallaq, H., T. W. Smith, and A. Leaf. 1992. Modulation of dihydropyridine-sensitive calcium channels in heart cells by fish oil fatty acids. Proc. Natl. Acad. Sci. USA. 89:1760–1764. [DOI] [PMC free article] [PubMed] [Google Scholar]
- 8.Xiao, Y. F., D. C. Sigg, and A. Leaf. 2005. The antiarrhythmic effect of n-3 polyunsaturated fatty acids: modulation of cardiac ion channels as a potential mechanism. J. Membr. Biol. 206:141–154. [DOI] [PubMed] [Google Scholar]
- 9.Erichsen, D., X.-p. Xu, and F. Elinder. 2002. Docosahexaenoic acid induced opening of voltage-gated K channels prevents repetitive firing in neurons. Brain Dev. 24:399. [Google Scholar]
- 10.Xu, X. P., D. Erichsen, S. I. Börjesson, M. Dahlin, P. Åmark, and F. Elinder. 2008. Polyunsaturated fatty acids and cerebrospinal fluid from children on the ketogenic diet open a voltage-gated K channel: a putative mechanism of antiseizure action. Epilepsy Res. 80:57–66. [DOI] [PubMed] [Google Scholar]
- 11.Bezanilla, F. 2000. The voltage sensor in voltage-dependent ion channels. Physiol. Rev. 80:555–592. [DOI] [PubMed] [Google Scholar]
- 12.Keynes, R. D., and F. Elinder. 1999. The screw-helical voltage gating of ion channels. Proc. Biol. Sci. 266:843–852. [DOI] [PMC free article] [PubMed] [Google Scholar]
- 13.Yellen, G. 1998. The moving parts of voltage-gated ion channels. Q. Rev. Biophys. 31:239–295. [DOI] [PubMed] [Google Scholar]
- 14.Swartz, K. J. 2004. Towards a structural view of gating in potassium channels. Nat. Rev. Neurosci. 5:905–916. [DOI] [PubMed] [Google Scholar]
- 15.Long, S. B., E. B. Campbell, and R. Mackinnon. 2005. Voltage sensor of Kv1.2: structural basis of electromechanical coupling. Science. 309:903–908. [DOI] [PubMed] [Google Scholar]
- 16.Elinder, F., J. Nilsson, and P. Arhem. 2007. On the opening of voltage-gated ion channels. Physiol. Behav. 92:1–7. [DOI] [PubMed] [Google Scholar]
- 17.Elinder, F., P. Århem, and H. P. Larsson. 2001. Localization of the extracellular end of the voltage sensor S4 in a potassium channel. Biophys. J. 80:1802–1809. [DOI] [PMC free article] [PubMed] [Google Scholar]
- 18.Jiang, Y., V. Ruta, J. Chen, A. Lee, and R. MacKinnon. 2003. The principle of gating charge movement in a voltage-dependent K+ channel. Nature. 423:42–48. [DOI] [PubMed] [Google Scholar]
- 19.Perozo, E., R. MacKinnon, F. Bezanilla, and E. Stefani. 1993. Gating currents from a nonconducting mutant reveal open-closed conformations in Shaker K+ channels. Neuron. 11:353–358. [DOI] [PubMed] [Google Scholar]
- 20.Broomand, A., F. Osterberg, T. Wardi, and F. Elinder. 2007. Electrostatic domino effect in the Shaker K channel turret. Biophys. J. 93:2307–2314. [DOI] [PMC free article] [PubMed] [Google Scholar]
- 21.Larsson, H. P., and F. Elinder. 2000. A conserved glutamate is important for slow inactivation in K+ channels. Neuron. 27:573–583. [DOI] [PubMed] [Google Scholar]
- 22.Bruno, M. J., R. E. Koeppe 2nd, and O. S. Andersen. 2007. Docosahexaenoic acid alters bilayer elastic properties. Proc. Natl. Acad. Sci. USA. 104:9638–9643. [DOI] [PMC free article] [PubMed] [Google Scholar]
- 23.Suchyna, T. M., S. E. Tape, R. E. Koeppe 2nd, O. S. Andersen, F. Sachs, and P. A. Gottlieb. 2004. Bilayer-dependent inhibition of mechanosensitive channels by neuroactive peptide enantiomers. Nature. 430:235–240. [DOI] [PubMed] [Google Scholar]
- 24.Nishizawa, M., and K. Nishizawa. 2007. Molecular dynamics simulations of a stretch-activated channel inhibitor GsMTx4 with lipid membranes: two binding modes and effects of lipid structure. Biophys. J. 92:4233–4243. [DOI] [PMC free article] [PubMed] [Google Scholar]
- 25.Milescu, M., J. Vobecky, S. H. Roh, S. H. Kim, H. J. Jung, J. I. Kim, and K. J. Swartz. 2007. Tarantula toxins interact with voltage sensors within lipid membranes. J. Gen. Physiol. 130:497–511. [DOI] [PMC free article] [PubMed] [Google Scholar]
- 26.Wang, J. M., S. H. Roh, S. Kim, C. W. Lee, J. I. Kim, and K. J. Swartz. 2004. Molecular surface of tarantula toxins interacting with voltage sensors in K(v) channels. J. Gen. Physiol. 123:455–467. [DOI] [PMC free article] [PubMed] [Google Scholar]
- 27.Kanicky, J. R., and D. O. Shah. 2002. Effect of degree, type, and position of unsaturation on the pKa of long-chain fatty acids. J. Colloid Interface Sci. 256:201–207. [DOI] [PubMed] [Google Scholar]
- 28.Small, D. M., D. J. Cabral, D. P. Cistola, J. S. Parks, and J. A. Hamilton. 1984. The ionization behavior of fatty acids and bile acids in micelles and membranes. Hepatology. 4:77S–79S. [DOI] [PubMed] [Google Scholar]
- 29.Elinder, F., M. Madeja, and P. Århem. 1996. Surface Charges of K channels. Effects of strontium on five cloned channels expressed in Xenopus oocytes. J. Gen. Physiol. 108:325–332. [DOI] [PMC free article] [PubMed] [Google Scholar]
- 30.Elinder, F., and P. Arhem. 2003. Metal ion effects on ion channel gating. Q. Rev. Biophys. 36:373–427. [DOI] [PubMed] [Google Scholar]
- 31.Armstrong, C. M., and W. F. Gilly. 1979. Fast and slow steps in the activation of sodium channels. J. Gen. Physiol. 74:691–711. [DOI] [PMC free article] [PubMed] [Google Scholar]
- 32.Bezanilla, F., E. Perozo, and E. Stefani. 1994. Gating of Shaker K+ channels: II. The components of gating currents and a model of channel activation. Biophys. J. 66:1011–1021. [DOI] [PMC free article] [PubMed] [Google Scholar]
- 33.Schoppa, N. E., and F. J. Sigworth. 1998. Activation of Shaker potassium channels. III. An activation gating model for wild-type and V2 mutant channels. J. Gen. Physiol. 111:313–342. [DOI] [PMC free article] [PubMed] [Google Scholar]
- 34.Zagotta, W. N., T. Hoshi, and R. W. Aldrich. 1994. Shaker potassium channel gating. III: evaluation of kinetic models for activation. J. Gen. Physiol. 103:321–362. [DOI] [PMC free article] [PubMed] [Google Scholar]
- 35.Keynes, R. D., and F. Elinder. 1998. Modelling the activation, opening, inactivation and reopening of the voltage-gated sodium channel. Proc. Biol. Sci. 265:263–270. [DOI] [PMC free article] [PubMed] [Google Scholar]
- 36.Schoppa, N. E., K. McCormack, M. A. Tanouye, and F. J. Sigworth. 1992. The size of gating charge in wild-type and mutant Shaker potassium channels. Science. 255:1712–1715. [DOI] [PubMed] [Google Scholar]
- 37.Pathak, M. M., V. Yarov-Yarovoy, G. Agarwal, B. Roux, P. Barth, S. Kohout, F. Tombola, and E. Y. Isacoff. 2007. Closing in on the resting state of the Shaker K+ channel. Neuron. 56:124–140. [DOI] [PubMed] [Google Scholar]
- 38.Honore, E., J. Barhanin, B. Attali, F. Lesage, and M. Lazdunski. 1994. External blockade of the major cardiac delayed-rectifier K+ channel (Kv1.5) by polyunsaturated fatty acids. Proc. Natl. Acad. Sci. USA. 91:1937–1941. [DOI] [PMC free article] [PubMed] [Google Scholar]
- 39.Lundbaek, J. A., P. Birn, A. J. Hansen, R. Sogaard, C. Nielsen, J. Girshman, M. J. Bruno, S. E. Tape, J. Egebjerg, D. V. Greathouse, G. L. Mattice, R. E. Koeppe 2nd, and O. S. Andersen. 2004. Regulation of sodium channel function by bilayer elasticity: the importance of hydrophobic coupling. Effects of Micelle-forming amphiphiles and cholesterol. J. Gen. Physiol. 123:599–621. [DOI] [PMC free article] [PubMed] [Google Scholar]
- 40.Andersen, O. S., and R. E. Koeppe 2nd. 2007. Bilayer thickness and membrane protein function: an energetic perspective. Annu. Rev. Biophys. Biomol. Struct. 36:107–130. [DOI] [PubMed] [Google Scholar]
- 41.Villarroel, A., and T. L. Schwarz. 1996. Inhibition of the Kv4 (Shal) family of transient K+ currents by arachidonic acid. J. Neurosci. 16:2522–2532. [DOI] [PMC free article] [PubMed] [Google Scholar]
- 42.Poling, J. S., S. Vicini, M. A. Rogawski, and N. Salem, Jr. 1996. Docosahexaenoic acid block of neuronal voltage-gated K+ channels: subunit selective antagonism by zinc. Neuropharmacology. 35:969–982. [DOI] [PubMed] [Google Scholar]
- 43.Xiao, Y. F., J. X. Kang, J. P. Morgan, and A. Leaf. 1995. Blocking effects of polyunsaturated fatty acids on Na+ channels of neonatal rat ventricular myocytes. Proc. Natl. Acad. Sci. USA. 92:11000–11004. [DOI] [PMC free article] [PubMed] [Google Scholar]
- 44.Hong, M. P., H. I. Kim, Y. K. Shin, C. S. Lee, M. Park, and J. H. Song. 2004. Effects of free fatty acids on sodium currents in rat dorsal root ganglion neurons. Brain Res. 1008:81–91. [DOI] [PubMed] [Google Scholar]
- 45.Danthi, S. J., J. A. Enyeart, and J. J. Enyeart. 2005. Modulation of native T-type calcium channels by omega-3 fatty acids. Biochem. Biophys. Res. Commun. 327:485–493. [DOI] [PubMed] [Google Scholar]
- 46.Feller, S. E., K. Gawrisch, and A. D. MacKerell, Jr. 2002. Polyunsaturated fatty acids in lipid bilayers: intrinsic and environmental contributions to their unique physical properties. J. Am. Chem. Soc. 124:318–326. [DOI] [PubMed] [Google Scholar]
- 47.Zheng, H. F., X. L. Li, Z. Y. Jin, J. B. Sun, Z. L. Li, and W. X. Xu. 2005. Effects of unsaturated fatty acids on calcium-activated potassium current in gastric myocytes of guinea pigs. World J. Gastroenterol. 11:672–675. [DOI] [PMC free article] [PubMed] [Google Scholar]
- 48.Feller, S. E., and K. Gawrisch. 2005. Properties of docosahexaenoic-acid-containing lipids and their influence on the function of rhodopsin. Curr. Opin. Struct. Biol. 15:416–422. [DOI] [PubMed] [Google Scholar]
- 49.Grossfield, A., S. E. Feller, and M. C. Pitman. 2006. Contribution of omega-3 fatty acids to the thermodynamics of membrane protein solvation. J. Phys. Chem. B. 110:8907–8909. [DOI] [PubMed] [Google Scholar]
- 50.Serth, J., A. Lautwein, M. Frech, A. Wittinghofer, and A. Pingoud. 1991. The inhibition of the GTPase activating protein-Ha-ras interaction by acidic lipids is due to physical association of the C-terminal domain of the GTPase activating protein with micellar structures. EMBO J. 10:1325–1330. [DOI] [PMC free article] [PubMed] [Google Scholar]
- 51.Richieri, G. V., R. T. Ogata, and A. M. Kleinfeld. 1992. A fluorescently labeled intestinal fatty acid binding protein. Interactions with fatty acids and its use in monitoring free fatty acids. J. Biol. Chem. 267:23495–23501. [PubMed] [Google Scholar]
- 52.Mukerjee, P., and K. J. Mysels. 1971. National Standards Reference Data Service. National Bureau of Standards, Washington, D.C.
- 53.Kang, J. X., and A. Leaf. 1995. Prevention and termination of beta-adrenergic agonist-induced arrhythmias by free polyunsaturated fatty acids in neonatal rat cardiac myocytes. Biochem. Biophys. Res. Commun. 208:629–636. [DOI] [PubMed] [Google Scholar]
- 54.Leaf, A., Y. F. Xiao, J. X. Kang, and G. E. Billman. 2005. Membrane effects of the n-3 fish oil fatty acids, which prevent fatal ventricular arrhythmias. J. Membr. Biol. 206:129–139. [DOI] [PubMed] [Google Scholar]