

Abstract
Routine quantitative analysis of biomolecule surface density by fluorescence microscopy has been limited by the difficulty of preparing appropriate calibration standards that relate measured fluorescence intensity to actual surface concentration. Supported lipid bilayers are planar fluid films of uniform density and composition which can incorporate a variety of lipidated fluorophores and work well as fluorescence standards. Here, we outline a straightforward strategy to calibrate digital micrographs of fluorescent surfaces such as planar cellular junctions for comparison to supported bilayer standards. It can be implemented with standard microscopy equipment. To illustrate the advantages of this approach, we quantify cell- and bilayer-side protein density patterns in a hybrid immunological synapse between a T-cell and a supported bilayer.
INTRODUCTION
Modern fluorescence microscopy provides spatially detailed information on the location and density of fluorescent biomolecules on substrates and cells, but full quantitative analysis of images is rarely performed. There are a variety of reasons why the inherently quantitative capabilities of this technique remain unused. One of these is the lack of appropriate calibration standards that facilitate the easy mapping of fluorescence intensity to absolute surface density, without which only relative comparisons can be made. While examples of quantitative density measurements by conventional fluorescence microscopy exist in the literature (see, for example, (1–5)), the level of analysis they present is not typical.
In the following, we illustrate how supported bilayers can fill this need for easily implemented calibration standards and are applicable for a variety of experimental situations. This implementation of quantitative fluorescence microscopy involves imaging a sample such as a labeled protein on a cell, a fusion protein tethered to a bilayer, or any other fluorescent species. The sample intensity is then compared to a series of supported bilayer standards containing a spectrally similar fluorophore using identical acquisition parameters. The supported bilayers (6,7)—two dimensional fluids that uniformly cover large glass surfaces at defined probe densities—provide the relationship between observed intensity and fluorophore density per unit area. While the spectral characteristics of fluorophores vary in different chemical environments such as on proteins or in bilayers, appropriate quantitative calibration of the observed sample intensities to the bilayer standards is straightforward. This calibration is essential because, as is well known and demonstrated below, even the same fluorophore on different molecular moieties can have large differences in emission intensity. However, the absolute surface density of the sample fluorophore can still be inferred using properly calibrated images.
Supported bilayers offer several advantages over published methods to create large, uniform, fluorescent standards for this type of analysis (1,8). They can be compositionally homogeneous across large distances (routinely up to several cm2), are easily created by several techniques (6,7,9), and can contain of a variety of probes across a broad range of densities (up to 104/μm2 or higher). Notably, supported bilayers self-assemble to a single membrane thickness, thus they are an easy way to reproducibly make surfaces of chosen probe densities while avoiding the need for further surface characterization, as with spin-coated standards (8). While the limited repertoire of fluorescent lipid probes and the spectral differences between lipid- and protein-bound fluorophores may initially seem to be obstacles, this need not be the case, since sample data may be calibrated such that one must merely choose a lipid-bound fluorophore roughly similar to that on the sample. The planar geometry of supported membranes makes them well suited to microscopy, and the presented method is theoretically valid down to diffraction-limited length scales. The technique is best suited to the analysis of two-dimensional sample geometries similar to planar-supported bilayers, which include various reconstituted systems as well as cellular interfaces with surfaces.
As an example of the latter category, we apply this methodology to immunological synapses, which are junctions between helper T-cells and antigen-presenting cells (10–13). Immunological synapses show dramatic spatial localization of cell surface receptor proteins over a timescale of minutes and on a length-scale of microns, and can be recapitulated by replacing the antigen-presenting cell with a supported bilayer displaying the appropriate cognate protein ligands to those on the T-cell (14). An example of a typical murine T-cell synapse illustrating two of the relevant synapse-associated proteins, T-cell receptor (TCR) and intercellular adhesion molecule-1 (ICAM), is shown in Fig. 1, a and b.
FIGURE 1.

Immune synapses with a supported bilayer. (a) Schematic view of a hybrid immunological synapse between a T-cell and supported bilayer from the side and top. TCR (red) and LFA (gray) on the T-cell interact with agonist peptide-major histocompatibility complex (gray, on bilayer) and ICAM (green) on the bilayer, respectively. (b) TCR and ICAM intensity of the same cell forming a synapse with a supported bilayer. The left three image intensities are scaled three arbitrary ways to show the full intensity range of the images, the presence or absence of protein across a threshold, or to highlight internal details of the protein distributions. TCR is visualized by Alexa568 anti-TCR Fab fragments and ICAM through the expressed eYFP domain. (Inset) Bright-field image of the same cell. TCR is on the cell side of the synapse; ICAM on the supported bilayer. Bars = 5 μm. The right panel shows quantitative protein density of TCR and ICAM mapped in linear pseudocolor that spans the full range of intensity within each image (performed in MATLAB). (c) TCR and ICAM density across the horizontal diameter of the synapse. (d) ICAM density clockwise from the top along the dashed circle.
The different intensity-scaling settings shown illustrate the limitations of graphically representing what is intrinsically quantitative data. The same images are scaled three arbitrary ways: linearly between the minimal and maximal intensities, in a binary fashion to highlight the presence or absence of protein across a threshold, or nonlinearly to highlight specific internal features at the cost of detail at the center (TCR) or in the background (ICAM). All three subjectively obscure some characteristics of the data to show others.
Mapping fluorescence intensity directly to protein surface density on a pixel-by-pixel basis is a more informative and objective way of presenting the same data. Rather than discarding information, the pseudocolor plots (Fig. 1 b, right panel) highlight the spatial variations of protein density in real units of protein/μm2. It would not normally be possible to construct figures such as these, since while properly scaled pseudocolor images can show any relative spatial subtleties of TCR or ICAM, the direct comparison of the densities shown (and plotted in Fig. 1 c) requires parallel quantification of both proteins. This work describes the method used to generate properly quantified images and plots such as these, thereby facilitating direct, quantitative comparison across different fluorescent analytes and images. The required tools include a fluorescence microscope fitted with appropriate dichroics and optical filters, a camera with a linear intensity response (common with modern charge-coupled device-based cameras), and lipids and glass substrates for the standards.
MATERIALS AND METHODS
Lipid vesicles and supported bilayers
Phospholipids (1,2-dioleoyl-sn-glycero-3-phosphocholine, DOPC; 1,2-distearoyl-sn-glycero-3-[phospho-L-serine], DOPS; and 1,2-dioleoyl-sn-glycero-3-ethylphosphocholine, DOEPC) were purchased from Avanti Polar Lipids (Alabaster, AL) and fluorescent lipids (Texas Red-DHPE; BODIPY-DHPE) were from Invitrogen (Carlsbad, CA). Measured quantities of lipids in chloroform were dried in a round-bottom flask on a rotary evaporator. After additional drying under a gentle N2 stream for at least 1 h, samples were hydrated with deionized water to 1 mg/ml lipid concentration and allowed to suspend overnight at 4°C. To ensure complete liftoff of the lipid film, flasks were frozen in a dry ice/isopropanol bath and thawed in warm water for three cycles. Samples were extruded eight times through 100-nm pore membrane filters (Whatman, Florham Park, NJ) at 50°C in a high pressure extruder (Northern Lipids, Burnaby, British Columbia, Canada). Average diameters of the resulting suspensions were typically within 5% of 100 nm as measured by dynamic light scattering (BIC 90plus, Brookhaven Instruments, Holtsville, NY). The concentration of vesicles and their fluorescent components was assumed to be set by the amount of lipids added to the flask and the volume of water used for hydration.
Supported bilayers for calibration standards were formed in glass-bottom 96 well plates (NalgeNunc, Rochester, NY) that had been soaked with 6 M NaOH for 2 h followed by extensive rinsing with deionized water. Vesicle suspensions at 0.5 mg/ml in 2× sample buffer (50 mM TRIS, 200 mM NaCl, pH 7.4) were added to an equal volume of water in the well, allowed to incubate for 10 min, and washed extensively with 1× sample buffer to remove adsorbed vesicles. Bilayers were never exposed to air, and were laterally fluid by fluorescence recovery after photobleaching, which verified supported bilayer integrity (15,16). Supported bilayers were of equal fluorescence intensity as those created on piranha solution-treated coverslips according to published methods (17), which shows that adsorbed vesicles were adequately removed.
Proteins for scaling factor calculation
Anti-biotin was purchased from Sigma (St. Louis, MO) and labeled with Oregon Green, FITC, AlexaFluor568 or AlexaFluor594 succinimidyl esters from Invitrogen. Monomeric DsRed was purchased from Clontech (Mountain View, CA) and BODIPY-anti-IgG from Invitrogen. The eYFP and eYFP-ICAM were cultured in Escherichia coli and HEK-293T cells, respectively. Protein solutions were diluted into sample buffer or HBS/HSA (for anti-TCR and eYFP-ICAM) and fluorophore concentration measured with a Cary 100 absorbance spectrophotometer (Varian, Palo Alto, CA) using published extinction coefficients.
Fluorimetry and microscopy
Fluorimetry measurements were performed on a Cary Eclipse (Varian) equipped with a thermostated sample holder at 25°C. Excitation/emission spectra were obtained by exciting with a 1.5 nm slit width and step size across the range of wavelengths encompassing the excitation filter on the microscope. Emission data (2-nm slit and step) at each excitation wavelength also encompassed the spectral range of the emission filter. The fluorimeter corrects for wavelength-dependent variations in illumination intensity.
Microscope images were acquired on a Nikon (Melville, NY) TE300 equipped with a Coolsnap HQ camera (Photometrics, Tucson, AZ) controlled by Metamorph (Molecular Devices, Downington, PA). FITC (HQ FITC, #41001 for green-emitting fluorophores) and Texas-Red (HQ TR, #41004 for red-emitting fluorophores) filter sets from Chroma (Rockingham, NY) were used with a Plan Fluor 20× ELWD 0.45 NA air objective or Plan Fluor 100× oil immersion objective from Nikon at 1.3 NA for T-cell related images.
Measuring the scaling factor
For microscope measurements of F, discussed below, 300 μl aliquots of vesicles and protein (of known and measured concentration, respectively) were placed in 96-well plates. With the field diaphragm minimized and the objective at the lateral center of the well, the microscope was focused deep into the solution where intensity was maximal and even substantial vertical adjustments in focus did not change the intensity by more than a few percent. Because the image intensity is uneven due to fluorescence outside the objective focal plane, only a small region at the center of the field was used for measurements. The standard deviation of intensity within this region was <1.5%, which spanned hundreds of pixels. Measured intensity was constant with time and extremely linear with respect to vesicle (and thus fluorophore) concentration, demonstrating negligible scattering over our particle concentration range (Fig. S1 in Supplementary Material, Data S1). Background signal was measured from solutions of nonfluorescent vesicles or buffer. The net fluorescence intensities were normalized by fluorophore molarity. The value of F was determined by the ratio of the normalized net vesicle intensity divided by the normalized net protein intensity.
Fluorimetry data was derived from the same solutions used for microscopy measurements. Spectra of each solution comprised an m × n matrix (m = (λexmax – λexmin)/step, n = (λemmax – λemmin)/step, where λex and λem are excitation and emission wavelengths, and step is the interval between data points). The raw spectra were background-subtracted with spectra of buffer or nonfluorescent vesicles and scaled by Φ(λex, λem), discussed below, all given as m × n matrices (see Fig. S2 in Data S1 for calculation of Φ(λex, λem)). The value of F was determined by the ratio of Isolu(sample)/Isolu(vesicle) as approximated as the sum of the entries of the molarity-normalized m × n matrix. Calculations were performed in Excel (Microsoft, Redmond, WA).
T-cell experiments
T-cell synapses were prepared essentially as described elsewhere (18), except for the usage of polyhistidine-tagged proteins, which were stably bound to Ni2+-loaded DOGS-NTA lipids (Avanti) included in the bilayer at 2 mol %. TCR was visualized by staining with Alexa568 labeled anti-TCR Fab fragments during synapse formation followed by extensive washing. Consistent acquisition parameters were used within each color channel for both samples and standards. Background noise was subtracted from all image intensities, and the net signal converted to prot/μm2, using standard curves with lipid fluorophore densities spanning the range of sample fluorophore densities.
RESULTS
Creating bilayer standards
We use supported lipid bilayers containing predefined amounts of fluorescent lipids to establish the relationship between observed intensity and fluorophore surface density. The fluorescent probe density is set by the stoichiometry of the lipid mixture used to make the vesicle precursors to supported bilayers. While there are a variety of methods to create supported bilayers (7,19–21), the most straightforward is the spontaneous rupture of vesicles from a buffer suspension onto a clean, glass surface. The entire substrate is covered by a single bilayer of uniform lateral composition, the quality of which is easily assayed by observing fluorescence recovery after photobleaching of a small region (see Materials and Methods). Besides exhibiting high lateral mobility of membrane components, good supported bilayers are also virtually featureless down to high magnification, the most common problems being micrometer-scale holes or residual adsorbed vesicles, which appear as dark or bright spots under high magnification, respectively, and may often be remedied by changing the ionic strength or buffer pH. (For more information about supported bilayer formation conditions, see (9)). Using a DOPC lipid footprint in supported bilayers of 0.72 nm2, it is straightforward to calculate the number of fluorophores per unit area (22). A series of bilayer standards composed of DOPC and varying amounts of fluorescent BODIPY-DHPE is shown in Fig. 2 where the intensity linearly increases up to ∼20,000 BODIPY-DHPE/μm2 (0.7 mol %). The increasing nonlinearity at higher densities is attributed to fluorophore self-quenching due to exciton trap formation. The data set is well described by the model for BODIPY lipid self-quenching in monolayers given by Dahim et al. (23), which assumes that if two fluorophores approach each other within a critical distance, they form a trap site for energy transfer, which in turn lowers the observed fluorescence (see Fig. 2).
FIGURE 2.

Bilayer calibration standards. (a) Fluorescence images and schematics of the calibration bilayers with increasing amounts of BODIPY-DHPE. Intensity of bilayers increases with BODIPY-DHPE density. Bars = 100 μm. (b) Numerical intensity of bilayers from panel a. Each image in panel a corresponds to a single data point. Each bilayer is moved to sample several different areas, demonstrating the lateral homogeneity of the bilayers. The recorded intensity is taken from the same region of each image. The solid line represents a least-squares regression fit of the first four BODIPY concentrations (R2 = 0.999). The dotted line represents a fit to the form where intensity I = Q · Γ exp[–π Γ], where Γ is the density of fluorophores, Rm is a critical distance below which fluorophore pairs form exciton traps, and Q is a proportionality constant (23). Because Rm is less than the thickness of the membrane, each leaflet of the bilayer is treated as an independent monolayer. (Best fit values Rm = 2.95 nm, Q = 0.052.)
All the intensities used in this work lie within the linear region of a plot of fluorescence versus fluorophore density, but calibrated sample intensities (discussed below) beyond the linear portion of the standards may be directly applied to the linear fit, as long as the sample fluorophores themselves are not subject to self-quenching.
Scaling factors and optical efficiency of the microscope
The bilayer standards in Fig. 2 are only directly applicable to similar supported bilayers containing BODIPY-DHPE, since even the same fluorophore on a different chemical moiety (for instance, a protein instead of a lipid) will have different absorption and emission characteristics. These can translate into large changes in observed fluorophore brightness as light propagates through the microscope optical train. Thus, sample images must usually be calibrated to render them comparable to the standards by taking into account the spectral differences of the two fluorophores and how those spectra are affected by the microscope optics. In other words, one can calibrate the intensity of the sample fluorophore to the bilayer standard fluorophore so that
 |
(1) |
where Ical and Isample are the calibrated and observed sample intensities respectively, and F is a unitless scaling factor that represents the strength of the sample fluorophore versus the lipid-linked standard fluorophore. The factor F accounts for the optical properties of the instrument and the differing spectral properties of the sample and standard fluorophores. The value of Ical is applied to a curve such as Fig. 2 b to find the surface density of sample fluorophores, and hence the sample itself.
Two different ways of measuring F for a pair of fluorophores give very similar results. In the first method, the microscope is defocused into a solution of known lipid vesicle- or sample-fluorophore molarity and one compares the intensities so that
 |
(2) |
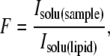
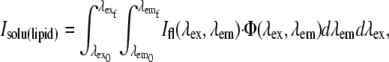
where Isolu(sample) and Isolu(lipid) are the concentration-normalized intensities of the sample and lipid vesicle standard solutions, respectively. This approach measures F directly on the microscope to be used. The second method uses excitation/emission spectra measured in a standard fluorimeter (Fig. 3 a). However, raw excitation/emission spectra do not include the effects of the microscope optical train on Isolu(lipid) or Isolu(sample). These effects can be accounted for by an optical efficiency function, Φ(λex, λem), which affects Isolu(vesicle) and Isolu(sample) differently.
FIGURE 3.

Effect of Φ(λex, λem) on the spectrum of Texas Red vesicles. (a) Normalized excitation/emission spectrum of TR-DHPE containing vesicles (500 nM bulk concentration of TR-DHPE) measured on a fluorimeter. (b) Optical efficiency function, Φ(λex, λem), calculated for the microscope optical train equipped with a Texas Red filter set. The two major peaks along the excitation axis are from the Hg arc lamp (see Fig. S2 in Data S1 for Φ(λex, λem) calculation). (c) Excitation/emission spectrum in panel a scaled by Φ(λex, λem) in panel b. This volume represents the actual intensity measured by the microscope, Isolu(lipid). F is given by the ratio of this volume to a similarly scaled protein spectrum, both normalized for molarity.
We can calculate Φ(λex, λem) by individually considering the spectra of each optical component of the microscope (see Fig. S2 in Data S1 for an example). The tensor product of the vectors representing the microscope excitation and emission efficiencies gives Φ(λex, λem) and is shown in Fig. 3 b. In this case, the optical train of the microscope begins at the mercury arc lamp, passes through an excitation filter, and is reflected to the sample by a dichroic mirror. Emitted light passes back through the dichroic and an emission filter, and is recorded by a charge-coupled device camera. Any other components are considered to have negligible effects.
The intensity of a solution measured by the microscope, such as Isolu(lipid), is represented by the full emission spectrum measured in a fluorimeter, Ifl(λex, λem) (Fig. 3 a), scaled by Φ(λex, λem) (Fig. 3 b), which can be stated mathematically as
 |
(3) |
and is shown graphically in Fig. 3 c. The numerical value of Isolu(lipid) is substituted into Eq. 2 in place of the directly measured value, and values of Isolu(sample) are calculated similarly. The scaling operation in Eq. 3 is also known as a Hadamard, or entrywise matrix product, and the integration is easily evaluated by summing the matrix entries graphed in Fig. 3 c. For the well-matched fluorophores chosen for the immunological synapse, Φ(λex, λem) does not drastically change the calibration between fluorophores compared to considering the raw emission alone, but this may not always be the case. It is notable that as long as Φ(λex, λem) can be predicted, this same analysis can be applied to any system where F cannot be directly measured on the instrument, such as flow cytometers.
Equation 1 can drastically change raw versus calibrated sample intensities, and the same fluorophore can behave very differently on various chemical moieties. For instance, calibrated and raw intensities differ by about a factor of 10 with each of the Texas Red-labeled proteins (Fig. 4). Conversely, calibrations of AlexaFluor488 streptavidin and anti-biotin intensities are very different, illustrating that the scaling factor must be measured for each sample-standard pair. The measurements directly on the microscope and from fluorimetry data generally show good agreement, which confirms that the calibration can be performed for instruments where one has sufficient knowledge of the optical train to calculate Φ(λex, λem). Scaling factors for a number of fluorophores on our microscope system are listed in Table S1 in Data S1, and can be measured for any protein pair.
FIGURE 4.

Scaling factors by microscopy and fluorimetry. Scaling factors, F, measured with protein and vesicle solutions on the microscope or in a fluorimeter as described in Materials and Methods. The values above the dashed line calibrate the indicated fluorescent protein to TR-DHPE bilayers and those below to BODIPY-DHPE bilayers. Error bars represent the standard deviation from at least three pairs of protein and vesicle samples.
Supported bilayers are located near a substrate with substantial surface charge (∼2000 e−/μm2) (24), which may affect the fluorescence of the lipid standards. The strength of the electric field at the membrane due to the nearby charged surface is reduced by the high ionic strength conditions of most experiments involving proteins, and the majority of our measurements are conducted in 25 mM Tris, 100 mM NaCl, pH 7.5. (Using the same buffer for standards and sample is not a requirement, however, as the data for Fig. 1 are protein intensities in a HBS/HSA buffer calibrated to lipid intensities in Tris.)
The results in Fig. 5 illustrate that supported bilayer intensity and the calibration procedure for these fluorophores is not sensitive to nearby charges. Vesicle samples can be made to include nominally negative or positive lipids (DOPS or DOEPC, respectively), which affect the membrane electrostatic potential. While up to 10 mol % of these lipids is present, the fraction of lipids actually carrying a charge is dependent on the pKa of the relevant titratable group, which is in turn strongly affected by the presence of other nearby surface charges (25). The independence of calibration and membrane charge implies that the solution measurements should be directly translatable to measurements near the charged surfaces normally used for forming supported bilayers. Also, the emission of BODIPY and Texas Red vesicles is not sensitive to the buffer ionic strength within our experimental range (data not shown). Consideration must also be given to whether the chemical environment surrounding the sample fluorophores will vary substantially within the experiment. The general procedure is valid as long as this does not occur.
FIGURE 5.

F is independent of electrostatic environment. Scaling factor measured by fluorimetry between BODIPY anti-IgG and BODIPY-DHPE vesicles with varying mol % of positive (DOEPC) or negative (DOPS) lipids.
When comparing anisotropically oriented fluorophores to each other, it may be necessary to measure the extent of transition dipole polarization. This polarization can occur with some lipid-linked fluorophores in bilayers (see (26,27) for examples) and potentially with protein samples as well. This may introduce a systematic error to the method, in some cases, but is analyzable in analogy to the cited references if needed, though such corrections are not considered here.
Measuring TCR and ICAM density in immunological synapses
As an application of this methodology, we image immunological synapses and bilayer standards with the exact same illumination and acquisition parameters for each filter set, calibrate the sample data, and compare it to standards that span the appropriate fluorophore intensity range (102−103 μm2 here). In place of the antigen-presenting cell, we integrate His10-eYFP-intercellular adhesion molecule 1 (ICAM) and His6-major histocompatibility complex loaded with antigenic peptide into a supported bilayer using a nickel-histidine linkage to DOGS-NTA-Ni lipids. The former protein interacts with leukocyte function-associated antigen 1 (LFA) and the latter with T-cell receptor (TCR), both on the lymphocyte. Recent work shows that this His/Ni affinity-based linkage promotes stable protein binding over hours, and is suitable for immunological synapse formation (28).
We show simultaneous quantification of both lymphocyte TCR density and bilayer ICAM density of a live immunological synapse with a supported bilayer in Fig. 1 b. The former is visualized with Alexa568 anti-TCR Fab fragments, and the latter by the fused YFP moiety. We can directly compare the distribution of both proteins on the same scale at the same time. Using F = 0.9 ± 0.1 to calibrate Alexa568 labeled anti-TCR IgG Fab fragments to Texas-Red DHPE, the average density of TCR at the center of the mature immunological synapse is found to be 700 ± 300 μm2. The total number of TCR per synapse is ∼40,000, in agreement with previous estimates (29). For F = 0.81 ± 0.08 to calibrate eYFP-ICAM for BODIPY-DHPE bilayers, we find that T-cells concentrate ICAM in the ring region to a density of 500 ± 100 μm2 versus a bulk concentration of 250 ± 20 μm2 outside the cell and 340 ± 80 μm2 within the center of the ring. The ICAM has a peaked concentration profile along a line bisecting the ring (Fig. 1 c), and the above ratios comparing ICAM concentrations use the average density along the peak of the ring, which has remarkably uniform average protein density (Fig. 1 d). Since this experiment uses epifluorescence illumination, the above TCR densities may include some internalized protein complexes, but this same basic analysis may also be applicable to certain z-selective techniques. Also, it is simple to analyze and minimize error introduced by differential photobleaching of the sample and standard fluorophores. This should normally add only single percentage points of error for typical exposure settings (see Appendix). The above numerical values are the averages of 16 cells with standard deviation.
This quantitative fluorescence method has the notable advantage of not relying on radiolabeled antibodies, which have been bound to vesicles before (11,30) or after (31) supported bilayer formation for measurements of immunological synapse protein density. In the former case, proteins that were accessible in vesicles may become inaccessible against the glass, and in the latter the investigator still must contend with regulatory hurdles associated with radioactivity. Furthermore, neither addresses in situ protein density on individual cell surfaces.
DISCUSSION
Given the large number and variety of fluorescence microscopy-based experiments being conducted across the biological and physical disciplines, the ability to accurately quantify fluorescence images adds an important degree of analysis. A requirement for the routine implementation of quantitative fluorescence microscopy is an easy way to create appropriate fluorescent standards, and while some existing methods make efforts to ensure that fluorophores are in the correct chemical environment by coating them onto the surface of polymeric microbeads, for instance, one cannot use these to easily create large surfaces of uniform density. Likewise, they do not offer a ready way to correct for lateral spatial variations in microscope intensity, which supported bilayers readily address in analogy to published methods (8). Together with the bilayer standards, the calibration strategy presented above is general with respect to sample and instrumentation, since the only requirements are that sample and standard have at least some spectral overlap, quenching and bleaching are minimal and understood, and F can be measured either directly or by calculating an optical efficiency function, Φ(λex, λem) combined with fluorimetry data.
SUPPLEMENTARY MATERIAL
To view all of the supplemental files associated with this article, visit www.biophysj.org.
Supplementary Material
Acknowledgments
This work was supported by Chemical Sciences, Geosciences and Biosciences Division, Office of Basic Energy Sciences of the U.S. Department of Energy under Contract No. DE-AC03-76SF00098.
APPENDIX
Error due to differential bleaching of fluorophores
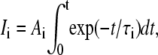
For two fluorophores with photobleaching half-lives τ1 and τ2, the intensity of each as recorded by the microscope will be
 |
(4) |
where Ai is a constant and t is the exposure duration.
If τ1 = τ2, the ratio of measured intensities will always be A1/A2 no matter the exposure time. Otherwise the ratio will change with time according to
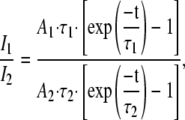 |
(5) |
and the fractional deviation from the initial ratio, δ, will be
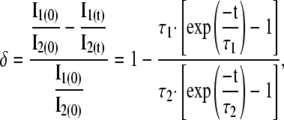 |
(6) |
which introduces an error when sample images are calibrated using F. However, even if the fluorophore half-lives differ by a factor of 2 (τ1 = 2τ2), δ is only 2.3% for an exposure t = 0.1τ2, which is still a longer exposure time than used here.
Editor: Michael Edidin.
References
- 1.Chiu, C.-S., K. Jensen, I. Sokolova, D. Wang, M. Li, P. Deshpande, N. Davidson, I. Mody, M. W. Quick, S. R. Quake, and H. A. Lester. 2002. Number, density, and surface/cytoplasmic distribution of GABA transporters at presynaptic structures of knock-in mice carrying GABA transporter subtype 1-green fluorescent protein fusions. J. Neurosci. 22:10251–10266. [DOI] [PMC free article] [PubMed] [Google Scholar]
- 2.Yang, T. L., O. K. Baryshnikova, H. B. Mao, M. A. Holden, and P. S. Cremer. 2003. Investigations of bivalent antibody binding on fluid-supported phospholipid membranes: The effect of hapten density. J. Am. Chem. Soc. 125:4779–4784. [DOI] [PubMed] [Google Scholar]
- 3.Sugiyama, Y., I. Kawabata, K. Sobue, and S. Okabe. 2005. Determination of absolute protein numbers in single synapses by a GFP-based calibration technique. Nat. Methods. 2:677–684. [DOI] [PubMed] [Google Scholar]
- 4.Dustin, M. L., D. E. Golan, D. M. Zhu, J. M. Miller, W. Meier, E. A. Davies, and P. A. van der Merwe. 1997. Low affinity interaction of human or rat T cell adhesion molecule CD2 with its ligand aligns adhering membranes to achieve high physiological affinity. J. Biol. Chem. 272:30889–30898. [DOI] [PubMed] [Google Scholar]
- 5.Dustin, M. L., T. Starr, D. Coombs, G. R. Majeau, W. Meier, P. S. Hochman, A. Douglass, R. Vale, B. Goldstein, and A. Whitty. 2007. Quantification and modeling of tripartite CD2-, CD58FC chimera (Alefacept)-, and CD16-mediated cell adhesion. J. Biol. Chem. 282:34748–34757. [DOI] [PubMed] [Google Scholar]
- 6.Sackmann, E. 1996. Supported membranes: scientific and practical applications. Science. 271:43–48. [DOI] [PubMed] [Google Scholar]
- 7.McConnell, H. M., T. H. Watts, R. M. Weis, and A. A. Brian. 1986. Supported planar membranes in studies of cell-cell recognition in the immune-system. Biochim. Biophys. Acta. 864:95–106. [DOI] [PubMed] [Google Scholar]
- 8.Zwier, J. M., G. J. V. Rooij, J. W. Hofstraat, and G. J. Brakenhoff. 2004. Image calibration in fluorescence microscopy. J. Microsc. 216:15–24. [DOI] [PubMed] [Google Scholar]
- 9.Cremer, P. S., and S. G. Boxer. 1999. Formation and spreading of lipid bilayers on planar glass supports. J. Phys. Chem. B. 103:2554–2559. [Google Scholar]
- 10.Monks, C. R. F., B. A. Freiberg, H. Kupfer, N. Sciaky, and A. Kupfer. 1998. Three-dimensional segregation of supramolecular activation clusters in T cells. Nature. 395:82–86. [DOI] [PubMed] [Google Scholar]
- 11.Grakoui, A., S. K. Bromley, C. Sumen, M. M. Davis, A. S. Shaw, P. M. Allen, and M. L. Dustin. 1999. The immunological synapse: a molecular machine controlling T cell activation. Science. 285:221–227. [DOI] [PubMed] [Google Scholar]
- 12.Mossman, K. D., G. Campi, J. T. Groves, and M. L. Dustin. 2005. Altered TCR signaling from geometrically repatterned immunological synapses. Science. 310:1191–1193. [DOI] [PubMed] [Google Scholar]
- 13.Mossman, K., and J. Groves. 2007. Micropatterned supported membranes as tools for quantitative studies of the immunological synapse. Chem. Soc. Rev. 36:46–54. [DOI] [PubMed] [Google Scholar]
- 14.Groves, J. T., and M. L. Dustin. 2003. Supported planar bilayers in studies on immune cell adhesion and communication. J. Immunol. Methods. 278:19–32. [DOI] [PubMed] [Google Scholar]
- 15.Axelrod, D., D. E. Koppel, J. Schlessinger, E. Elson, and W. W. Webb. 1976. Mobility measurement by analysis of fluorescence photobleaching recovery kinetics. Biophys. J. 16:1055–1069. [DOI] [PMC free article] [PubMed] [Google Scholar]
- 16.Jackson, B. L., and J. T. Groves. 2007. Hybrid protein-lipid patterns from aluminum templates. Langmuir. 23:2052–2057. [DOI] [PubMed] [Google Scholar]
- 17.Wong, A. P., and J. T. Groves. 2002. Molecular topography imaging by intermembrane fluorescence resonance energy transfer. Proc. Natl. Acad. Sci. USA. 99:14147–14152. [DOI] [PMC free article] [PubMed] [Google Scholar]
- 18.DeMond, A. L., K. D. Mossman, T. Starr, M. L. Dustin, and J. T. Groves. 2008. T cell receptor microcluster transport through molecular mazes reveals mechanism of translocation. Biophys. J. 94:3286–3292. [DOI] [PMC free article] [PubMed] [Google Scholar]
- 19.Sackmann, E., and M. Tanaka. 2000. Supported membranes on soft polymer cushions: fabrication, characterization and applications. Trends Biotechnol. 18:58–64. [DOI] [PubMed] [Google Scholar]
- 20.Tamm, L. K., and H. M. McConnell. 1985. Supported phospholipid-bilayers. Biophys. J. 47:105–113. [DOI] [PMC free article] [PubMed] [Google Scholar]
- 21.Kalb, E., S. Frey, and L. K. Tamm. 1992. Formation of supported planar bilayers by fusion of vesicles to supported phospholipid monolayers. Biochim. Biophys. Acta. 1103:307–316. [DOI] [PubMed] [Google Scholar]
- 22.Vacklin, H. P., F. Tiberg, and R. K. Thomas. 2005. Formation of supported phospholipid bilayers via co-adsorption with β-D-dodecyl maltoside. Biochim. Biophys. Acta (BBA). Biomembranes. 1668:17–24. [DOI] [PubMed] [Google Scholar]
- 23.Dahim, M., N. K. Mizuno, X.-M. Li, W. E. Momsen, M. M. Momsen, and H. L. Brockman. 2002. Physical and photophysical characterization of a BODIPY phosphatidylcholine as a membrane probe. Biophys. J. 83:1511–1524. [DOI] [PMC free article] [PubMed] [Google Scholar]
- 24.Behrens, S. H., and D. G. Grier. 2001. The charge of glass and silica surfaces. J. Chem. Phys. 115:6716–6721. [Google Scholar]
- 25.Tsui, F. C., D. M. Ojcius, and W. L. Hubbell. 1986. The intrinsic pKa values for phosphatidylserine and phosphatidylethanolamine in phosphatidylcholine host bilayers. Biophys. J. 49:459–468. [DOI] [PMC free article] [PubMed] [Google Scholar]
- 26.Axelrod, D. 1979. Carbocyanine dye orientation in red-cell membrane studied by microscopic fluorescence polarization. Biophys. J. 26:557–573. [DOI] [PMC free article] [PubMed] [Google Scholar]
- 27.Groves, J. T., R. Parthasarathy, and M. B. Forstner. 2008. Imaging of membrane dynamics. Annu. Rev. Biomed. Eng. In press. [DOI] [PubMed]
- 28.Nye, J. A., and J. T. Groves. 2008. Kinetic control of histidine-tagged protein surface density on supported lipid bilayers. Langmuir. 24:4145–4149. [DOI] [PubMed] [Google Scholar]
- 29.Varma, R., G. Campi, T. Yokosuka, T. Saito, and M. Dustin. 2006. T cell receptor-proximal signals are sustained in peripheral microclusters and terminated in the central supramolecular activation cluster. Immunity. 25:117–127. [DOI] [PMC free article] [PubMed] [Google Scholar]
- 30.Sims, T. N., T. J. Soos, H. S. Xenias, B. Dubin-Thaler, J. M. Hofman, J. C. Waite, T. O. Cameron, V. K. Thomas, R. Varma, C. H. Wiggins, M. P. Sheetz, D. R. Littman, and M. L. Dustin. 2007. Opposing effects of PKCθ and WASp on symmetry breaking and relocation of the immunological synapse. Cell. 129:773–785. [DOI] [PubMed] [Google Scholar]
- 31.Chan, P., M. Lawrence, M. Dustin, L. Ferguson, D. Golan, and T. Springer. 1991. Influence of receptor lateral mobility on adhesion strengthening between membranes containing LFA-3 and CD2. J. Cell Biol. 115:245–255. [DOI] [PMC free article] [PubMed] [Google Scholar]
Associated Data
This section collects any data citations, data availability statements, or supplementary materials included in this article.