

Abstract
A kinetic model for insulin secretion in pancreatic β-cells is adapted from a model for fast exocytosis in chromaffin cells. The fusion of primed granules with the plasma membrane is assumed to occur only in the “microdomain” near voltage-sensitive L-type Ca2+-channels, where [Ca2+] can reach micromolar levels. In contrast, resupply and priming of granules are assumed to depend on the cytosolic [Ca2+]. Adding a two-compartment model to handle the temporal distribution of Ca2+ between the microdomain and the cytosol, we obtain a unified model that can generate both the fast granule fusion and the slow insulin secretion found experimentally in response to a step of membrane potential. The model can simulate the potentiation induced in islets by preincubation with glucose and the reduction in second-phase insulin secretion induced by blocking R-type Ca2+-channels (CaV2.3). The model indicates that increased second-phase insulin secretion induced by the amplifying signal is controlled by the “resupply” step of the exocytosis cascade. In contrast, enhancement of priming is a good candidate for amplification of first-phase secretion by glucose, cyclic adenosine 3′:5′-cyclic monophosphate, and protein kinase C. Finally, insulin secretion is enhanced when the amplifying signal oscillates in phase with the triggering Ca2+-signal.
INTRODUCTION
When stimulated with a step increase of glucose, a single pancreatic islet of Langerhans secretes insulin in a biphasic pattern: a transient up-and-down burst of rate lasting for a few minutes (the first phase) followed by a sustained slow rate lasting for a few hours (the second phase). Since β-cells in a stimulated islet are tightly coupled (1), the biphasic insulin secretion kinetics is likely not due to cell heterogeneity in membrane potential and calcium (2). Although there may still be heterogeneity in insulin secretion rates, we assume here that the biphasic kinetics is an intrinsic property of the β-cell. That is, we expect that a single β-cell would secrete insulin with the same biphasic kinetics as an islet, although current insulin measuring assays are not sensitive enough to confirm this experimentally. The biphasic secretion pattern is also seen in vivo, and it has been suggested that diabetes is correlated with the loss of the first phase (3,4). Thus, understanding how a stimulated β-cell secretes insulin at the molecular level is not only of academic interest but also potentially useful for understanding the disease process and guiding target selection for diabetes drug development.
Like neurons and many other endocrine cells, pancreatic β-cells secrete by exocytosis—in this case of insulin-containing granules, a process that is generally believed to include a cascade of complex steps, such as granule docking, priming, Ca2+-triggered granule fusion, and insulin release (5–9). Although many of the molecules (such as SNARE, Rab, and Munc) of the exocytosis cascade (EC) have now been identified (9–15), the detailed kinetic mechanism of the EC is still not well understood. The step in the EC where the kinetic mechanism has been best studied quantitatively is the Ca2+-triggered granule fusion step, the rate of which can be measured using the capacitance measurement method (16,17).
The progress from whole-islet to single vesicle measurements, reviewed in Michael et al. (18), raises the question of whether these experiments measure the same things. Indeed, capacitance measurements have reported rates that are much faster than those from classic biochemical assays from islets (11). A possible resolution of this discrepancy is the finding that capacitance measurements in situ (i.e., from intact islets) are much slower than those from isolated β-cells (17). Even restricting consideration to isolated cells, the rate of insulin release, assayed by total internal reflection fluorescence observations of vesicle disappearance, is much slower than the change in capacitance (8). Finally, capacitance measurements show biphasic kinetics in measurements taken within 1 s or 1 min, which have been identified with the much slower classic phase 1 and phase 2 in islets. By integrating processes over a range of time and space scales, the model will shed some light on all of the above issues.
By fitting with fusion rates measured at different concentrations of Ca2+ (using the caged-Ca2+ release assay), a five-state kinetic model for granule fusion has been obtained recently for chromaffin cells that contains “resupply”, “priming”, three Ca2+ binding steps, and an irreversible fusion reaction (19,20). In this work, we show that, based on this five-state fusion model, a multistate kinetic model for the EC can be developed and used to build a model for pancreatic β-cells that generates both the fast fusion rate (<1 s) and the slow insulin secretion rate (minutes) simultaneously. In this model, influx of Ca2+ occurs through both the L-type and the R-type channels, and the Ca2+-triggered fusion of granules with the plasma membrane is assumed to occur exclusively in the “microdomain” of an L-type channel only. With the use of a simple “two-compartment” model to handle the temporal distribution of Ca2+ between the microdomain and the cytosol compartments, we obtain a theoretical cell model that describes at the molecular level how insulin is released from electrically stimulated β-cells. The model can be extended to glucose-stimulated insulin secretion by adding a “triggering pathway” formalism that describes the K(ATP) channel-mediated generation of electrical activities and Ca2+ dynamics after glucose metabolism.
The model developed in this work is useful for studying insulin secretion in altered β-cells. Recently, it has been found that the second phase in insulin secretion rates is reduced in islets whose R-type Ca2+-channels are either removed genetically (by gene knockout) or blocked by inhibitors (21). As will be shown below, this finding can be simulated qualitatively by our model. The model can also be used to explain the “potentiation” in insulin secretion observed in islets preincubated with glucose.
Finally, the model is useful in studying two problems related to the “amplifying signals” that have attracted considerable attention recently. The rate of insulin secretion from β-cells in an islet stimulated with a step depolarization is increased in both the first and second phase when glucose metabolism is present in the system (22–27). This leads to the suggestion that glucose metabolism generates not only the “triggering” signal (Ca2+-influx) but also some “amplifying” signal or signals that increase the efficacy of Ca2+-triggered insulin secretion (28,29).
Despite considerable study, the identity of the amplifying signal remains undetermined. We use the model to approach this question in a different way: Which step or steps in the EC could be modulated by the amplifying signal to increase the rate of insulin secretion in the first and second phases, respectively? In other words, the amplifying signal derived from glucose metabolism can modulate the rate constant of one or more steps of the EC to increase the exocytotic flux. The model suggests that the step with the most appropriate properties to be a target for the amplifying effect during second-phase secretion is the “resupply” of granules from the “reserve” pool. This has been proposed in other models (30,31), but we show further that other steps do not work. We show in contrast that the step with the most appropriate properties to mediate amplification of first-phase secretion is the priming of already docked vesicles.
A second issue raised by the model, which has not been considered before, is the possible implications of oscillations in both the membrane potential and the “amplifying” signals. It is experimentally observed that pancreatic β-cells exhibit slow oscillations (periods in minutes) in both the membrane potential and the intracellular [Ca2+] when stimulated with high glucose. It has been suggested that these slow Ca2+-oscillations are driven by slow glucose metabolic oscillations (32–34). Since the amplifying signal is thought to derive from glucose metabolism, it is possible that these amplifying signals may also oscillate with the same frequency as the bursting electrical activity. It is thus interesting to know whether the mean insulin secretion rate will be affected by the phase shift between the two oscillations. As will be shown below, insulin secretion is enhanced when these two signals are in phase and reduced when they are out of phase, if the amplifying signal interacts with a step or steps that are also Ca2+-dependent.
Portions of this work have been presented previously in poster form (35).
MODEL AND MATHEMATICAL METHOD
The purpose of this section is to develop the mathematical formalism for a β-cell model that can be used to calculate both the rate of granule fusion and the rate of insulin secretion when the cell is stimulated with an arbitrary electrical potential. First, we highlight some basic assumptions and general properties of the model.
The model contains two dynamical systems: i), the set of exocytotic reactions (the EC) between insulin-containing granules and the cell membrane, including the crucial Ca2+-triggered fusion reaction, that lead to insulin secretion; and ii), the set of voltage-sensitive Ca2+-channels and Ca2+-transporters that handle the dynamics of Ca2+ inside the cell when the cell is applied with a depolarizing membrane potential.
Insulin-containing granules in the cell model are divided into a large reserve pool and a smaller “exocytosable” pool of “docked” granules, which can be further divided into several pools with different fusion competencies. Granules supplied from the reserve pool to the EC have to undergo some “maturation” or “priming” steps before they can execute the Ca2+-triggered fusion reaction.
The model contains both L-type and R-type voltage-sensitive Ca2+-channels to mediate Ca2+-influx when the cell is depolarized and four types of Ca2+-transporters to handle the clearance of Ca2+ from the cytosol.
Fusion of primed granules is assumed to take place exclusively in the “microdomain” at the inner mouth of an L-type channel (not the R-type), where the concentration of Ca2+ is much higher than that in the cytosol when the cell is stimulated. This assumption is based on the finding that insulin-containing granules can form stable complexes with L-type channels (36,37) and on the realization that localized Ca2+-influx plays an important role in insulin secretion (38). The R-type channels, on the other hand, contribute to exocytosis by adding to the global calcium signal but are not colocalized with vesicles (21).
The resupply step is assumed to depend on both ATP and bulk cytosolic Ca2+. The ATP dependency derives from the finding that insulin secretion from single islets drops to a low level after a long depolarization in the absence of glucose (39). The Ca2+ dependency is derived from the finding that insulin secretion in the second phase decreases when the cytosolic [Ca2+] is reduced by blocking the R-type Ca2+-channels.
Priming is also assumed to depend on bulk cytosolic Ca2+ and, in some simulations, on glucose metabolism.
The Ca2+ dynamical system is not influenced by the EC.
Since fusion involves Ca2+-ions in the microdomain of the L-type channel whereas resupply and priming involve Ca2+ in the cytosol, the temporal distribution of Ca2+ between the two compartments plays an important role in insulin secretion. In this model, this distribution is handled by a two-compartment kinetic model.
Microdomains and the two-compartment formalism for [Ca2+] dynamics
As shown schematically in Fig. 1 A, a “functional” microdomain is defined as a half-sphere surrounding the inner mouth of an L-type channel. The microdomain is referred to as “functional” because it is the place where a primed granule can form a stable complex with the plasma membrane and execute the Ca2+-triggered fusion step. The microdomain at an R-type channel, in contrast, is not functional because granules do not form stable complexes with the channel and therefore very few fusion events will occur there. Although there is not a membrane separating the microdomain and the cytosol, modeling studies have shown that a sharp temporal [Ca2+] gradient can be maintained near the channel (40). We therefore use the simple two-compartment model illustrated in Fig. 1 B to describe the temporal and spatial distribution of Ca2+ in a stimulated β-cell. When the cell is depolarized, Ca2+-ions passing through the L-type channels first go into the microdomain (flux JL in Fig. 1) and then diffuse to the cytosol, whereas those passing through the R-type channels go directly to the cytosol (flux JR in Fig. 1). Flux between the two phenomenological compartments is assumed to be proportional to the concentration difference.
FIGURE 1.

Two-compartment model for intracellular calcium ion dynamics. (A) Ca2+-channels and the “microdomain” of a β-cell model. The influx of Ca2+ is handled by two types of voltage-gated Ca2+-channels: the L-type and the R-type. A microdomain is defined as the half-sphere surrounding the inner mouth of an L-type Ca2+-channel with a diameter of ∼0.3 μm to provide a phenomenological compartment with elevated Ca2+; the region of elevated Ca2+ in a real cell would in fact be much smaller, perhaps 10 nm. When the cell membrane is depolarized, Ca2+ passing through the L-type channel first goes into the microdomain and then diffuses to the cytosol, whereas only the contribution of Ca2+ passing through the R-type channel to cytosolic Ca2+-concentration is accounted for. (B) The two-compartment kinetic model describing the dynamic distribution of Ca2+ between the microdomain and the cytosol compartments.  and
and  denote the concentration of Ca2+ in the microdomain and the cytosol compartment, respectively, B is the rate of exchange between the microdomain and the cytosol, and
  denotes the rate of Ca2+ clearance from the cell, which is handled by four kinds of Ca2+-transporters (see text).
Let us consider a cell that is supplied with a time-dependent potential  at time 0. Let
  and
and  denote the Ca2+-concentrations in the cytosol and the microdomain compartments, respectively, at time t. Then, they obey the chemical kinetic equations:
 |
(1) |
 |
(2) |
where  and
and  are, respectively, the molar Ca2+-influx through open L-type and open R-type Ca2+-channels at time t;
  and
and  are constants representing the ratio of the free to the bound Ca2+ in the microdomain and the cytosol compartments, respectively; B is the transport rate constant of Ca2+ between the two compartments (a parameter that is fit);
  is the ratio of the compartmental volume of the microdomain to that of the cytosol; and
  is the molar clearance rate of Ca2+ out of the cytosol compartment at
  In Eqs. 1 and 2, we neglect the change in [Ca2+] caused by the binding of Ca2+ to granules. That is, the dynamics of Ca2+ is assumed to be independent of the kinetics of granule fusion and exocytosis. This assumption is reasonable, because the number of granules is much smaller than the number of Ca2+-ions in the cell.
Values of  and
and  at any given membrane potential
  can be calculated from the current through open Ca2+-channels:
 |
(3a) |
 |
(3b) |
where  and
and  are the volume of the microdomain compartment and the cell, respectively, and
  is a constant factor that converts the current into the mole flux of Ca2+-ions. Our microdomain compartment is a phenomenological construct that provides a region functionally specialized to have a Ca2+-concentration elevated by two orders of magnitude over that of the cytosol. In an actual cell, the region of elevated Ca2+ would be more like the tall spike indicated by three-dimensional diffusion simulations (40), and a vesicle would have to be within a few tens of nanometer of a channel to experience concentrations on the order of our Cmd.
The electrical properties of the L-type and R-type channels are assumed to be identical. However, the number of R-type channels is assumed to be only one-fourth that of the L-type, resulting in the following expressions (41):
 |
(4a) |
 |
(4b) |
 |
(5) |
where  is the conductance of the L-type Ca2+-channel,
  is the equilibrium potential for the Ca2+-ions across the membrane, and
  and
and  are constants.
We use a previously developed model (42) to handle the clearance of Ca2+ from the cytosol compartment. In this model, the rate of clearance is assumed to be handled by four types of transporters: the sarcoendoplasmic reticulum ATPase (SERCA), the plasma membrane ATPase (PMCA), the Na-Ca exchanger (NCX), and the leak channel. Neglecting the effects of pH and ATP, the clearance rate is then expressed as
 |
(6) |
where
 |
(7a) |
 |
(7b) |
 |
(7c) |
 |
(7d) |
The values of the parameters,  etc. in Eqs. 7 are taken from Chen et al. (42) and are used without change here.
Table 1 lists the values of the parameters of the two-compartment model. The values in the table are obtained mostly from the literature, except  and B, which are obtained by fitting the model to the following two experimentally observed conditions: 1) at the resting potential (V = −70 mV),
  50 nM; and 2) at V = −20 mV (the usual bursting plateau),
  and
and  As shown in Fig. 2, microdomain calcium changes more rapidly than bulk cytosolic calcium, but on the timescale of minutes the former is to a good approximation just a scaled version of the latter. (The timescale difference would be exaggerated if the ER compartment were included; see Bertram and Sherman (41)). Note also that the value of the exchange rate between the microdomain and the bulk cytosol, B, affects mostly the value of
  not
not 
TABLE 1.
Parameters of the two-compartment model of [Ca2+]
| Parameter | Value | Source |
|---|---|---|
 |
250 pS | Fitted |
| B |  |
Fitted |
 |
−20 mV | (41) |
 |
25 mV | (41) |
 |
5 mV | (41); modified to attain Cmd range |
 |
1.15 pl | Calculated from cell radius (6.5 μm) |
 |
4.2 fl | Fitted (microdomain radius = 0.15 μm, 600 domains per cell) |
 |
0.00365 | Calculated: 
|
 |
0.01 | (42); 1/(calcium binding ratio) |
 |
0.01 | Assumed same as 
|
 |
 |
Calculated: 1/(2 Faraday) |
 |
 |
(42) |
 |
 |
(42) |
 |
 |
(42) |
 |
 |
(42) |
 |
 |
(42) |
 |
 |
(42) |
FIGURE 2.

Effect of B on [Ca2+] distribution. The time course of [Ca2+] in the microdomain (Cmd) and cytosolic (Ci) compartments after a train of alternating square pulses between  and
and  with a period of 16 s, 8 on and 8 off for B = 200 (solid curves) and 250
  (dotted curves).
The exocytosis cascade and the kinetic model
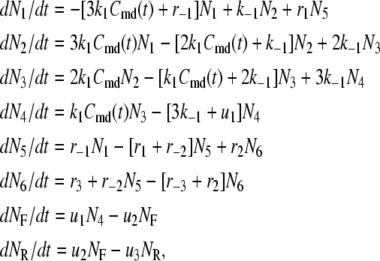
The EC that describes the interaction between the insulin-containing granules and the plasma membrane inside a β-cell leading to insulin secretion is divided schematically into seven steps, as shown in Fig. 3 A. We assume that a granule has to dock to the membrane from a reserve pool, be primed, and move to the microdomain at an L-type Ca2+-channel before it can bind with Ca2+ and fuse with the cell membrane. Recent evidence points to the existence of an additional pool of granules, called the highly calcium-sensitive pool (HCSP) with high affinity for Ca2+ that can presumably fuse outside a channel microdomain, but we leave this as an extension for future versions of the model (43). After fusion, the pore between the granule and the extracellular space has to expand before insulin can be released. Both the resupply and priming steps are also assumed to involve Ca2+.
FIGURE 3.

(A) Schematic drawing of the EC proposed for pancreatic β-cells. The thick long line represents the plasma membrane of the cell, and the two shaded blocks on the membrane represent an L-type Ca2+-channel where a microdomain is formed. The state of the granule-membrane complex is schematically represented by the shape of the drawing between the granule and the membrane: state 6 consists of vesicles “docked” but not yet primed for fusion; state 5 is the primed vesicles outside the microdomain; state 1 is the primed vesicles bound to the microdomain; state 4 is the prefusion state; F represents the fused state; and R represents the insulin releasable state. The Ca2+-triggering step involves the Ca2+ in the microdomain, whereas both the resupply and the priming steps involve the Ca2+ in the cytosol. (B) Kinetic scheme proposed for the EC in (A).  is the concentration of Ca2+ in the microdomain. (C) Expressions showing the dependency of
  and
and  on the concentration of Ca2+ in the cytosol compartment (
 ).
).
The Ca dependency of the priming step comes from the fusion kinetic studies on chromaffin cells by Voets and colleagues (19,20), whereas that for the resupply step comes from the finding that reduction of cytosolic Ca2+-concentration reduces the second phase of the insulin secretion rate (see below). The resupply and priming steps are further assumed to be modulatable by the amplifying signal or signals generated from glucose metabolism or other cellular reactions. Thus, the rate of granule fusion and insulin secretion in a β-cell is determined not only by the Ca2+ surrounding L-type Ca2+-channels but also by the bulk cytosolic Ca2+-concentration and one or more amplifying signals from glucose metabolism. At the resting state,  is very small and all the docked granules exist essentially only in the first three pools (1, 5, and 6) in the cascade (see Table 3). The sum of the granules in these three pools is related to the total amount of insulin released in the first phase measured in a single islet. In contrast, the sum of the granules in pools 1 and 5 alone determines the total amount of fusion in the first phase measured in briefer single-cell capacitance experiments.
TABLE 3.
Granule populations in different states in Fig. 3 B at the resting state
| State | Number of granules | State | Number of granules |
|---|---|---|---|
| 1 | 14.71 | 2 | 0.612 |
| 3 | 0.008 | 4 | 0 |
| 5 | 24.54 | 6 | 218.02 |
| F | 0.003 | R | 0.51 |
The simplest kinetic scheme for this EC is given in Fig. 3 B, where each step in the cascade is represented by a single chemical reaction except the Ca2+-triggering step, which is described by three Ca2+ binding reactions as proposed for chromafin cells (19,20). Note that the “microdomain binding” step here corresponds to the “priming” step in the kinetic model of Voets and the “priming” step here corresponds to their “resupply” step. The kinetics of the cascade is regulated by the concentration of Ca2+ in the cytosol through the forward rate constant of the resupply and the priming step, as indicated in the equations in Fig. 3 C.
The three pretriggering steps are assumed to be reversible, whereas the three posttriggering steps are assumed to be irreversible. Refinements such as vesicles that bypass the docking step and go directly to fusion (44–46), the aforementioned HCSP (43), and kiss-and-run secretion (11) are deferred to future iterations of the model. Note that some reports indicate that the contribution of kiss-and-run is small (47). Narrowing the focus results in a single feed-forward pathway that is easier to analyze and clarifies how much can be explained with the simplest model.
Due to the existence of these irreversible steps in the kinetic scheme, the model is not an equilibrium system. That is, the rates of fusion and insulin secretion of the system, defined respectively as  and
and  with
with  representing the number of granules in pool i, are always nonzero, even at the resting steady state, as long as
  is not 0.
The time-dependent distribution of the pool population in Fig. 3 B after the cell is depolarized can be described by the differential equations:
 |
(8) |
where  represents the number of granules in pool i in Fig. 3 B, and
  is the concentration of Ca2+ in the microdomain compartment as described in Eq. 1. The resting values of the pool population as well as the Ca2+-concentration in the two compartments can be obtained by solving the algebraic equations obtained by setting the left-hand side of Eqs. 1, 2, and 8 to 0; those equations are linear because Vm is fixed at rest. With these initial values, the time-course of the pool population can be calculated from Eqs. 1, 2, and 8 when an arbitrary time-dependent depolarization (such as a single pulse or a train of pulses) is applied at time 0. The rate of granule fusion and the rate of insulin secretion (in units of granules) at time t can then be evaluated from these
  as
as
 |
(9a) |
 |
(9b) |
Similarly the accumulated total number of granules fused and the total amount of insulin secreted (in units of granules) can be evaluated as
 |
(10a) |
 |
(10b) |
To express experimentally measured rates of fusion and rates of insulin secretion in units of concentration per unit time, each granule is assumed to have a capacitance of 3.5 fF and to contain ∼1.6 amol or 9 fg of insulin, as determined by amperommetry (11). This agrees well with the estimate of 88 ng per whole mouse islet (48), assuming 1000 cells per islet and 10,000 granules per cell. We then report the output of islet simulations in units of pg/islet/min by scaling the single-cell secretion rate JIS in granules/min/cell by 9 pg/granule × 1000 cells/islet. We also assume that the cumulative insulin released is sampled every 2 min as in many islet experiments; so we plot finally the average insulin secretion rate (ISR) as  (see Eqs. 9b and 10b).
Both the resupply and the priming steps are assumed to depend on  using the simple equilibrium binding formulae (19)
 |
(11a) |
 |
(11b) |
where  is a constant and
  is the concentration of Ca2+ in the bulk cytosol. We use the same value of
  ) obtained in Voets (19) in our calculations. A new feature added to the Voets model here is that the value of
  is also modified by an amplifying signal generated from glucose metabolism.
There are 11 rate constants in the EC, which were determined by fitting the cell model to experimental exocytosis and secretion data, as discussed in the next section.
Determination of parameters of the kinetic model
The 11 rate constants shown in Fig. 3, B and C, were determined by fitting the cell model to the experimental data obtained by capacitance measurements in single clonal INS-1 β-cells (8) and by immunoassay in mouse islets (39). Specifically, they are obtained by fitting the model to the following six sets of experiments: 1), the total number of granules fused ( in Eq. 10a) in a single β-cell as a function of time after a step depolarization from Vm = −70 mV to Vm = 0 is applied as shown in Fig. 4 A of Barg et al. (8); see our Fig. 5 A; 2), the total number of granules reaching the “insulin releasable” state (
 in Eq. 10b) as a function of time after the cell is stimulated by a single square-pulse depolarization of 500 ms duration as shown in Fig. 4 C of Barg et al. (8); and 3), the four kinetic data sets of insulin secretion measured by Henquin et al. (39) on single islets in the presence of a step or a train of five alternating square-pulses between Vm = −70 mV (the resting potential) and Vm = −20 mV (the potential induced by 30 mM KCl in the presence of 250 μM diazoxide) in the presence and absence of 3 mM glucose, as shown in Fig. 4, B and D, respectively, of Henquin et al. (39).
FIGURE 4.

Fitting the model with the experimental data of Henquin et al. (39). For the two panels on the left, the insulin secretion rate (ISR) is plotted as a function of time after a train of five alternating square membrane potentials between −70 mV and −20 mV with a period of 12 min is applied at time 0, whereas a step depolarization is applied at time 0 for the right two panels. G0 means no glucose is present in the bathing solution, and G3 means the concentration of glucose is 3 mM as in the experiments. In the model calculations, the value of  in Table 2 is set to 0 for the G0 case, whereas
  is multiplied by a factor of 1.2 for the G3 case. The lines with filled circles are the experimental curves of Henquin et al., with basal secretion removed, and those with open squares are calculated with the model.
FIGURE 5.

Fitting the model with the experimental data of Fig. 4 C (8). (A) The total capacitance of a single cell after the cell is depolarized from −70 mV to −20 mV at time 0 is shown as a function of time. The experimental data are shown as filled squares and the calculated data as the solid line. Capacitance is calculated with Eq. 10a, with each fused granule assumed to increase the membrane capacitance by 3.5 fF. (B) The total number of granules reaching the releasable state R (Fig. 3 B) is obtained using Eq. 10b as a function of time after the cell is depolarized at time 0 with a step to −20 mV of 0.5-s duration followed by return to rest (−70 mV). The data are normalized with that measured at the 7-s time point after the onset of the depolarization.
We impose two constraints that the model has to obey. At the resting state (Vm = −70 mV), granules are mainly in pools 1, 5, and 6. The sum of these three pools at rest should equal approximately the total number of granules releasable with depolarization in the absence of glucose, that is, without resupply from the reserve pool. By integrating the curves in Fig. 4 B of Henquin et al. (39), we obtain
 |
(12) |
On the other hand, the number of granules fused by depolarization of single cells saturates within a second and is assumed to be equal to the sum of granules in pools 1 and 5 at rest. Thus, from the data shown in Fig. 4 C of Barg et al. (8), it is estimated that
 |
(13) |
In the model-fitting program, an upper and a lower limit is assigned to each of these three pools so that the conditions in Eqs. 12 and 13 are roughly followed.
The model fitting was carried out by finding the minimum of the sum of the weighted root mean-square deviation (RMSD) of the six data sets:
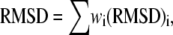 |
(14) |
where  and
and  denote the weight and the RMSD, respectively, of the ith data set. Since kinetic measurements of fusion and exocytosis of granules in single cells have a higher time resolution than kinetic measurements of insulin secretion from single islets, we weight them differently, using
  for the four data sets of Henquin et al. (39) and
  for the two data sets of Barg et al. (8).
We use an exhaustive search approach to find the best model: we 1), choose a range of values for each of the 11 parameters of the model; 2), simulate the kinetic measurements of Barg and Henquin with the model using the formulas developed in the previous section and evaluate the  in Eq. 14; 3), vary the value of each parameter sequentially until the 11-dimensional parameter space is exhausted; and 4), pick the set of parameters for the model with the smallest
  The best set of parameters thus obtained for the model is listed in 2. Figs. 4 and 5 show the fits of the model to the data using the best parameter set obtained.
The kinetic parameters for the fusion step ( and
and  ) are very similar to those obtained by Voets for chromaffin cells and are much larger (faster) than the resupply (
 ) and the two insulin-release processes (
 and
and  ). With the parameters in Tables 1 and 2, the pool population at rest (low glucose; Vm = −70 mV) can be calculated. The results in Table 3 show that the conditions in Eqs. 12 and 13 are roughly obeyed.
TABLE 2.
Kinetic parameters of the EC model at the resting state determined by fitting to data
| Parameter | Value | Parameter | Value |
|---|---|---|---|
 |
 |
 |
 |
 |
 |
 |
 |
 |
 |
 |
 |
 |
 |
 |
 |
 |
 |
 |
 |
 |
 |
 |
 |
See the section Determination of parameters of the kinetic model.
The fit to the islet experiments is shown in Fig. 4. The difference between the 0 glucose and 3 mM glucose simulations is due solely to the size of the resupply rate, r3. In the next section we show that the existence of state 6 in Fig. 3 B with a small  is necessary for the model to generate the biphasic pattern in insulin secretion rate. In contrast,
  and
and  do not contribute to the generation of the biphasic pattern but influence the overall timescale of the secretion rate.
The fit to the single-cell experiments is shown in Fig. 5. Note that there is a biphasic pattern on the much faster timescale (1 s) of Fig. 5 A. The “first phase” on this fast timescale is due to release of pool 1, the vesicles bound to calcium channel microdomains; and the slowly rising “second phase” that begins after 0.1 s is due to refilling of pool 1 by priming and depends on rate constant r1. The slow kinetics shown in Fig. 5 B, on the other hand, are due to the slow step represented by rate u3, which may reflect the slow emptying of the granules after they fuse (11,47).
Applications of the model
First-phase secretion
A total of ∼100 granules are released during the first phase in the simulations of Fig. 4, in good agreement with estimates by Bratanova-Tochkova et al. (49) for secretion per β-cell in mouse islets. A little less than half are contributed by the resting content of pools 1 and 5, with the balance newly primed vesicles from pool 6. In another set of experiments (27), a smaller value of 58 granules was obtained for the first-phase release. This value can be better approximated by reducing the priming rate  by half. This would in fact improve the fit to the first peak in the train of depolarizing stimuli used in Fig. 4 but at the expense of a poorer fit to the subsequent peaks.
In the model, the termination of the first phase is due to depletion of the primed pool of vesicles, similar to previous models (30,31). However, the calcium signal is also notably biphasic (Fig. 4; 27). If we step membrane potential down partially in our model after 2 or 4 min to produce a reduction in Ci and Cmd, we find a further reduction in secretion (a lower nadir) at the end of the first phase. Thus, it is likely that the reduction of calcium seen experimentally contributes to the end of the first phase. However, the model suggests that depletion of readily releasable vesicles is the more prominent effect.
Second-phase secretion
The islet data used to fit the model in Fig. 4 were taken from mouse islets that exhibited a flat or declining second phase of insulin secretion. Rat islets, in contrast, typically exhibit a rising second phase that can even exceed the peak of the first phase (29). Mouse islets can also show a rising second phase of secretion under certain conditions. Two ways of eliciting this behavior have been reported. One is to preexpose the islets to a substimulatory concentration of glucose, say 8.5 mM, before stepping to a high concentration of glucose, such as 16.7 mM (Figs. 2 and 3; 27). The other is to stimulate secretion by depolarization with KCl and diazoxide in the presence of high glucose (Fig. 5 E; 50). The model is not yet capable of simulating all of these protocols, but Fig. 6 shows that it can produce a rising second phase if the maximal resupply rate  is increased two- or threefold. The rising second phase is due to an increase in the docked pool (pool 6) as shown in the middle panel of Fig. 7, which corresponds to the dot-dashed curve in Fig. 6. Specifically, the size of the docked pool becomes the rate-limiting factor during second phase, with all the faster downstream processes in quasiequilibrium with it. This shows that an increase in the rate of resupply of vesicles from the internal reserve pool to the plasma pool(s) is sufficient to produce the rising second phase. This effect was first proposed more than 35 years ago by Grodsky and termed “provision” (31) and has been reaffirmed in an updated model (30).
FIGURE 6.

Simulated effects of amplification on first- and second-phase secretion. Insulin secretion rate (ISR) is shown for the model run with the standard parameters and initial conditions in Tables 1–3 but with Vm stepped to −20 mV (solid line) at time 0 to represent glucose-induced depolarization. A rising second phase is observed if  is increased by a factor of 2 (dashed line) or 3 (dot-dashed line) to represent the hypothetical amplifying effect of glucose on the rate of resupply of vesicles from the reserve pool to the docked pool. If glucose is assumed to amplify priming and resupply equally by a factor of 2 (dotted line), both first- and second-phase secretion are increased, but second-phase secretion is flat, not rising.
FIGURE 7.

Simulation of potentiation. Stimulatory glucose is applied at time 0, maintained for 60 min, removed for 10 min, and then restored. Stimulation is modeled as an increase in Vm to −20 mV combined with a threefold increase in  The response to the second step of glucose is potentiated due to a buildup in the docked pool that persists during the low-glucose gap and consequent refilling of the primed pool as exocytosis of vesicles ceases.
A flat second phase does not, however, imply that amplification is absent. The dotted curve in Fig. 6 shows the result when the resupply rate and the priming rate  are each increased twofold. Both first- and second-phase secretion are enhanced but the second phase is flat, which compares well with Fig. 3, A and C, in Henquin et al. (27) for the case when the islets are preexposed to 3 mM glucose then stepped to 11.1 and 16.7 mM glucose, respectively. In general, a rising second phase is produced in the model when resupply is amplified by a greater factor than priming. When the two are amplified by the same factor, however, the size of the docked pool does not rise, and hence neither does the secretion rate, because the docked vesicles proceed to the primed state as fast as they arrive.
Note that in the model the primed pool is depressed throughout the second phase as incoming vesicles are rapidly drawn into the calcium-binding steps and exocytosed (Fig. 7). Thus, during the second phase, the late fast steps are in quasiequilibrium with the docked pool and the latter directly controls the rate of secretion. This contrasts with the situation during first phase, in which secretion is controlled by the primed pool, as discussed in the next paragraph.
Effects of preincubation with glucose: the potentiation effect
It has long been known that preexposure of islets to a stimulatory concentration of glucose can increase the first phase in the insulin secretion rate in perfused rat pancreas (29,31,51,52) and in man (53–55). In the experiments, high glucose was applied for tens of minutes, and then glucose was reduced to basal levels for minutes to tens of minutes before high glucose was finally restored. This resulted in a second “first phase” of secretion that was larger than when the islet had not recently seen high glucose.
We simulate this with the model (Fig. 7) by assuming that the amplifying signal from glucose metabolism increases the value of  resulting in an increased resupply rate and growth of the docked compartment (pool 6). During the low-glucose gap, the docked pool remains largely filled and refills the primed compartment (pool 5) because release is minimal and reverse flux from the docked pool is very small. Thus, when the islet is subsequently restimulated, a higher secretion rate in the new first phase is obtained.
The model of Bertuzzi et al. (30) is similar to ours in this respect, and the docked pool similarly exhibits the above ratchet-like behavior. Note that in our model it is the rise in the primed pool during the gap, not the continued rise in the docked pool, which is immediately responsible for the potentiated first phase. Similar behavior is observed in Fig. 4, in both the data and the model; even when glucose is only 3 mM, each pulse of KCl results in a small peak of release that rises above the steady level attained with a maintained stimulus. Note also that resupply need not continue during the gap, and it does not in our model, but it may do so if the response of the resupply rate to changes in glucose is slow, as it is in the Grodsky model (31). This would have to be balanced against the relatively rapid decline in cytosolic calcium, which we have assumed also supports the resupply rate (Eq. 11b), in contrast to Grodsky and Bertuzzi et al. This leads to the prediction that longer gaps would result in greater potentiation until the gap became long enough (tens of minutes) for the docked pool to decay substantially.
The potentiation seen in Fig. 7 follows a second phase in which secretion rises slowly due to accumulation of docked vesicles. This is not coincidental. If a flat second phase is produced in the model by equal amplification of priming and resupply, as in the dotted curve of Fig. 6, there is no potentiation and in fact no new first phase at all when glucose is readded (not shown). This is because the rates of both priming and resupply are reduced during the gap when glucose is removed; so the accumulation of primed vesicles is limited. If the glucose gap is prolonged sufficiently, a new first phase can occur when glucose is added back; but for any gap length it is smaller than for the case in which priming is not a target of amplification. Conversely, any perturbation that unmasks a rising second phase is predicted to unmask potentiation as well. The two phenomena are different manifestations of the same underlying process, namely the balance between priming and resupply. A tight positive correlation between the slope of the second-phase insulin release rate and the ratio of peak postgap first phase to peak unpotentiated first phase has been noted previously in experiments from perfused rat pancreas (Fig. 2 of Nesher and Cerasi (52)).
Ramped versus stepped glucose
Classic experiments have also shown that ramping the glucose concentration, rather then suddenly stepping it up, ablates the first phase of secretion (31,56). This is of interest because islets likely see ramped glucose concentration postprandially due to delays in digestion and gastric emptying. Fig. 8 shows a simulation of this effect carried out by ramping membrane potential, V, and the resupply rate,  Consequently, the slow decline of the primed pool (pool 5) and the slow rise of the docked pool (pool 6) overlap. The loss of first phase is mainly due to the delayed depletion of the primed pool, which is in turn due to the ramping of the microdomain Ca2+-concentration during the ramp. If the resupply rate is ramped but V is stepped, there is still a phase 1; the ramp of resupply results only in a delay in the second phase. In the reverse case, V ramped and resupply stepped, there is no first phase, as in Fig. 8. These predictions could be tested by ramping V with KCl and diazoxide while holding glucose fixed and vice versa.
FIGURE 8.

Ablation of first phase by ramped glucose. When glucose is ramped up, represented by a linear increase in Vm from −70 to −20 mV and in the factor multiplying  from 1 to 3, the first phase is nearly completely abolished. Compare the ramped increase (solid line) to the stepped increase (dashed line), which is equivalent to the dot-dashed line in Fig. 6. All other parameters and initial conditions are as in Tables 1–3.
Effects of the R-type Ca2+-channel
It has been reported that the second phase of insulin secretion rate is decreased, but not eliminated, when the R-type Ca2+-channels (CaV2.3) in β-cells are removed or blocked by channel inhibitors (21). As shown by the dashed line in Fig. 9, this result can be simulated with our model by setting Ca2+-flux through the R-type channels ( in Fig. 1 and Eq. 2) to 0. This effect is lost if the resupply step does not depend on cytosolic [Ca2+]. The model also allows us to compare this effect to that of knocking out the L-type channel (setting JL in Fig. 1 and Eqs. 1 and 2), that is, of reducing microdomain Ca2+ and cytosolic Ca2+ versus reducing cytosolic Ca2+ alone (57). The dotted line shows that elimination of the L-type channel leaves a relative deficit in phase 1 secretion compared to phase 2, even if the R-type channel is upregulated, as found in Schulla et al. (57).
FIGURE 9.

Simulation of R-channel knockouts. Depolarization stimulated insulin secretion rate (solid curve) is first calculated for the standard cell model; the amplifying effect of increased glucose is modeled by increasing the value of  by a factor of 3 at time 0. The knockout is simulated by setting gR in Eq. 4b to 0 (dashed curve). Removal of the R-type channels decreases the second-phase insulin secretion rate. If the L-type channels are removed by setting gL in Eq. 4a to 0 and R-type channels are upregulated by increasing gR fourfold, the second phase is relatively more restored than the first phase (dotted curve).
Sites of action of the amplifying signal
We have shown above (Fig. 7) that increasing the resupply rate  is sufficient to account for the rise in secretion during the second phase. Now we use the model to explore whether other sites may also contribute. Specifically, we ask which step or steps in the EC can generate the experimental result shown in Fig. 4 of Straub and Sharp (13). In that experiment, islets were depolarized with KCl and diazoxide in 2.8 mM glucose to elicit first-phase secretion, followed by addition of 16.7 mM glucose 10 min later, when first phase was essentially complete. We simulated that protocol by applying a step depolarization (from −70 mV to −20 mV) to the model at time 0, increasing in turn the forward rate constant of each step in the cascade 10 min later and calculating the rate of insulin secretion as a function of time for the next hour.
The simulated results for each step in the cascade, except the Ca2+-triggering step, are shown in Fig. 10. Significant and sustained changes in insulin secretion occur after the rate constant is increased only for the resupply ( ) and priming (
 ) steps. Whereas the increase in the resupply rate generates the rising second-phase characteristic of rat insulin secretion, the increase in the priming rate generates a transient increase in the secretion rate, more reminiscent of first-phase secretion. We conclude that the generation of the second-phase aspect of the amplifying signal (no matter what it is) is controlled by the resupply of granules from the reserve pool to the exocytosable pool. The first-phase aspect of the amplifying signal, on the other hand, is suggested to target the priming step.
FIGURE 10.

Amplifying the signal sensitivity test of the EC steps. The thick solid line in each of the six figures is the usual biphasic insulin secretion rate calculated for the model at rest by applying a step depolarization from −70 to −20 mV at time 0. The thin solid line with filled circles in each figure is obtained after the rate constant indicated in the figure is increased 10 min after the onset of the depolarization. A threefold increase of  can generate the second-phase pattern observed in the experiment of Fig. 4 (13), and a threefold increase of
  can generate a large transient reminiscent of first-phase secretion. None of the other parameters can produce a significant, long-lasting increase in secretion despite a 10-fold increase.
Phasic enhancement between triggering and amplifying signals
Both metabolism and Ca2+ oscillate in the β-cell, so it is of interest to consider the phase relationship between these two signals. Specifically, we investigate the case in which the membrane potential of the cell is oscillating with periodic square pulses of period  and the amplifying signal is oscillating as a sine function of the same frequency, so that the rate constant of the step that interacts with the amplifying signal has to be multiplied by the factor
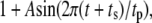 |
(15) |
where A is the strength of the amplifying signal and  is the time shift between the two oscillations. The two oscillations are completely in-phase when
  and completely out-of-phase when
  We are interested in two questions: 1) Does the rate of insulin secretion in β-cells depend on the angular phase shift
  between the oscillating membrane potential and the oscillating rate constant of the step that interacts with the amplifying signal? 2) Does each step in the EC generate the same effect or not?
To answer these two questions, the rate of insulin secretion of the model was calculated as a function of  by multiplying each of the rate constants, one rate constant at a time, by the oscillating factor in Eq. 15. for a range of
  values. The calculated results for
  are shown in Fig. 11, where the averaged insulin secretion rate is plotted as a function of the angular phase shift. Among the six forward rate constants of the EC, only the resupply (
 ) and the priming steps (
 ) generate phasic effects, with the former having the larger effect. Exactly the same curves are obtained when the value of
  is increased from 60 s to 300 s (not shown). Thus, the phasic effect seems not to depend on the frequency of the oscillation.
FIGURE 11.

Effect of the phase shift between bursting membrane potential and oscillating rate constant. The period of the bursting potential and the period of the oscillating rate constant are assumed to be identical. For each oscillating rate constant ( ), the “averaged” insulin secretion rate is calculated for the model at steady state as a function of the angular shift,
  where
where  and
and  are, respectively, the time shift and the period of the two oscillations, for the case
  Oscillations have a significant impact only when applied to the priming (
 ) and resupply (
 ) steps. The averaged ISR at steady state is obtained by discarding the first 20,000 min of simulations and averaging over the last five periods. Identical curves are also obtained for
  ranging from 60 to 600 s; i.e., the phasic effect is found to be insensitive to the frequency of the oscillation.
Single-cell versus islet kinetics
Up to this point the simulations have been based on parameters fitted to single-cell (INS-1) capacitance kinetics and biochemically assayed islet insulin release. However, capacitance measurements carried out in situ in islets indicate fusion rates that are much slower than in single cells (17). It turns out that this seemingly large discrepancy can easily be accommodated in the model. The fusion rate on the fast timescale of single-cell experiments (1 s) can be reduced from the 780 fF/s obtained with the standard parameters in Table 3 to 50 fF/s by reducing the rate of microdomain binding, r1, from 0.6 s−1 to 0.02 s−1 (Fig. 12 A). The 15-fold reduction in fusion rate is due to a 15-fold reduction in the initial size of pool 1 to 1 vesicle; pools 6 and 5 increase because flux to pool 1 is reduced but the increase is greater than twofold, to 312 and 49 vesicles, respectively. In general, the resting size of pool 1 is the main determinant of the peak fusion rate in the first second of stimulation.
FIGURE 12.

Accounting for reduced fusion in situ. Solid curves are run with the same parameters and initial conditions as the dot-dashed curve of Fig. 6, dashed with r1 reduced to 0.02 and initial values recalculated accordingly. This 30-fold reduction in r1 reduces the peak fusion rate 15-fold (A). The net capacitance increase has almost caught up by the end of the first minute (B), and response of insulin secretion rate to a 1-h step of glucose is minimally affected.
These changes in the microdomain binding rate and initial pool sizes have less effect on the 1-min timescale (Fig. 12 B) and minimal effect on the 1-h timescale of the islet experiments (Fig. 12 C) because those kinetics are determined mainly by the rate of priming and resupply, respectively. This result is a fundamental feature of the model, not a numerical peculiarity; one can scale r1 over a wide range and achieve essentially any fast scale fusion rate without much effect on the slow dynamics. In contrast, scaling the priming rate, r2, can also give any desired fast fusion rate but at the same time affects the first- and second-phase islet kinetics. Another way to reduce peak fusion rate in the first second is to reduce the affinity of fusion for calcium by increasing the back rate  or reducing the forward rate
  The effect is modest, however, because these maneuvers increase the resting size of pool 1 and the more prominent effect is a slower rise to peak. In summary, the model suggests that the difference between islets and single cells is more likely in the rate of forming the vesicle-channel complex than the properties of the complex or the rate of priming.
DISCUSSION
We have developed in this work a pancreatic β-cell model that can be used to calculate quantitatively the rate of insulin secretion as well as the rate of granule fusion when the cell is stimulated with an arbitrary depolarizing membrane potential. The model cell is composed of two dynamical systems: 1) a multistep EC that describes the reactions between insulin-containing granules and the cell membrane, including the crucial Ca2+-triggered granule fusion, required for insulin release; and 2) a simple two-compartment model to handle the temporal and spatial distribution of Ca2+ inside the cell after membrane depolarization. This is the first insulin secretion model that takes into account the range of β-cell granule time and space scales from subsecond/microdomain to 1-h/whole cell; previous quantitative models for insulin secretion on the long timescale have treated the EC as a black box (30,31,58,59). The inclusion of channel and granule biophysics allows the model to explain the results of fast (seconds) exocytosis experiments in single cells in addition to the longer timescale (tens of minutes) experiments in islets, testing steps, ramps, and potentiation, that have been the focus of previous models.
The model thus allows us to begin to integrate the results of these two classes of experiments into a unified framework. The explicit treatment of calcium also allows the model to address the effect of loss of the R-type Ca2+-channel. There are still, however, some important phenomena that the model does not account for, such as the response to staircase increases in glucose, which was a key motivation for Grodsky's threshold distribution hypothesis (31). A biophysical understanding of the latter remains an open question for future investigation.
We have chosen the membrane potential as the stimulation parameter in formulating our model because it is the simplest and cleanest parameter to handle theoretically and also sidesteps issues of how to model glucose metabolism and its transduction to a Ca2+-signal. Also, many insulin exocytosis experiments have in fact used the membrane potential as the stimulus. The explicit treatment of ion channels in our model should facilitate combining the exocytosis model with models for glucose metabolism and Ca2+-oscillations (34). The effects of Ca2+ and other ion channels and internal Ca2+ stores on both the bursting patterns and the insulin secretion rates could then be studied.
A limitation of the model is that we have used a deterministic approach to solve the two-compartment problem. That is, in our formalism all of the ∼600 microdomains in the β-cell are treated as identical and equivalent with the same [Ca2+] and the same number of granules at any given time. Due to the stochastic nature of the opening and closing of Ca2+-channels, the temporal Ca2+-concentration is expected to vary among microdomains. We have also not taken into account the discreteness of vesicles, resulting in fractional vesicles in the simulations (see, for example, Table 3). How the stochastic fluctuations in [Ca2+] and vesicle number affect the insulin secretion rate is an interesting problem for future study. A final limitation is that we have used square pulses of membrane potential instead of bursts of action potentials to drive the model. The parameters that govern the islet dynamics on the minutes timescale likely are too slow in their own kinetics to respond to the rapid fluctuations of V and only feel the average potential. Effects, such as slow inactivation of Ca2+-channels and the relative contributions of biphasic Ca2+-concentration and vesicle dynamics to islet first phase, merit further investigation. Combining the exocytosis model presented here with a model for electrical activity and Ca2+-oscillations is another natural extension to pursue.
The model takes into account explicitly the central role of the L-type Ca2+-channels in insulin secretion (36–38). Microdomains were incorporated into the model of Bertuzzi et al. (30) but without channel kinetics or Ca2+ dynamics. We have assumed that the Ca2+-triggered granule fusion step occurs only in the microdomain of an L-type channel, not in that of an R-type channel. That is, not all microdomains in a β-cell are correlated with insulin secretion. On the other hand, blocking the R-type channels is found to decrease the second phase in insulin secretion. In this work, we have shown that a reduction in bulk cytosolic [Ca2+] caused by eliminating the R-type channel is sufficient to account for the reduction in the second phase provided that the resupply of docked vesicles to the docked pool is Ca2+ dependent (Fig. 9). Moreover, when the L-type channel is eliminated, compensation by the R-type channel preferentially restores the second phase (Fig. 9 and 57). Thus, although there is overlap in the contributions of the L-type and R-type channels to secretion, the L-type is more associated with phase 1 and the R-type more with phase 2. This is even more apparent in the fast timescale (<1 s) single-cell experiments, where loss of the R-type channel has almost no effect but loss of the L-type channel cannot be compensated by upregulation of the R-type (21,57). This reflects a fundamental asymmetry in Ca2+ diffusion: Ca2+ can spread out from the microdomains to the cytosol, but cytosolic Ca2+ cannot be focally concentrated into microdomains.
A major focus of this work was to study the mechanisms underlying the amplifying signal or signals derived from glucose metabolism by investigating the kinetics of first- and second-phase secretion. Although our results do not directly address the identity of the signal, we have shown that an increase in the resupply rate is both necessary and sufficient for an increased second phase of insulin secretion (Fig. 10). An increase in the priming rate is a good candidate for mediating the component of amplification that enhances the first phase because it is the only step that can produce a rise in secretion with appropriate kinetics—fast enough to begin within the first phase and persistent enough to be maintained throughout the first phase. The amplifying signal(s) could also enhance the other fast steps (see further discussion below), but this is neither necessary nor sufficient. These insights may assist in focusing future efforts to identify the molecular nature of the amplifying signal.
The model fit indicates that a rate of resupply of ∼3 s−1 per β-cell is needed to reproduce the slow rise over tens of minutes of second-phase secretion in islets. If one assumes that the reserve pool consists of 10,000 vesicles, this is equivalent to a first-order time constant of about an hour. However, if the pool immediately supplying the docked pool consists of the 1000–2000 “almost docked” vesicles (vesicles within 0.2 μm of the membrane but not docked), as suggested by Rorsman and Renstrom (11), or “morphologically docked” but not “readily releasable”, as suggested by Bratanova-Tochkova et al. (49), then the effective time constant is 5–10 min, in reasonable agreement with measurements of “newcomer” vesicles by Ohara-Imaizumi and Nagamatsu (44) and Ohara-Imaizumi et al. (45). We have modeled newcomers as vesicles that join the docked pool and proceed through the usual stages of priming, microdomain attachment, and fusion. It is also possible that they represent a distinct pathway for secretion of highly calcium-sensitive vesicles (43).
The model suggests that a key difference between rats, which exhibit a rising second phase, and mice, which generally exhibit a flat second phase in response to a simple step in glucose, lies in the balance of the effects of amplification on the resupply and priming rates. However, mice apparently do have glucose-dependent resupply because secretion is maintained in 3 mM glucose but decays in 0 glucose (Fig. 4). The difference may be that priming is also enhanced equal-fold; in such a case the model predicts that first- and second-phase secretion would both be increased, but secretion during second phase would remain flat (compare solid and dotted lines in Fig. 6).
The balance between amplification of priming and resupply appears to be plastic. There have been two recent reports that mice display a rising second phase in vivo (27,60). In Henquin et al. (27) it was found moreover that isolated mouse islets in vitro could show a rising second phase if the step to stimulatory glucose (16.7 mM or higher) was preceded by a 40-min exposure to substimulatory glucose (optimally ∼8.5 mM). The rising second phase was accompanied by a reduced first phase. A rising second-phase secretion is also seen in mice exposed to high glucose in the presence of the K(ATP) channel opener diazoxide and normal external KCl and then depolarized by raising KCl (e.g., Fig. 6 in Gembal et al. (22) and Fig. 5 E in Szollosi et al. (50)). In the latter protocol, first-phase secretion was not reduced, but second-phase secretion was superamplified. The common element in the two protocols is an enhancement of second-phase secretion relative to first-phase secretion. The model suggests that this could result from an enhancement of resupply relative to priming, or even a loss of priming, but the mechanisms that could mediate this are not apparent.
The control of the resupply rate thus appears to be more complex than what we have modeled, as it depends on the history of exposure to glucose, not just the instantaneous level. It cannot, however, be as simple as resupply getting a head start during the prestimulatory period; for then the control islets that were not prestimulated would catch up, which they show no signs of doing after 2 h of stimulation.
We have also considered the effects of oscillations on exocytosis. The response to the calcium and voltage pulses in Fig. 4 shows that one functional consequence is higher peak secretion (though with lower average secretion). The detailed breakdown of the potentiation experiment (Fig. 7) shows that this is because the primed pool rebuilds during the rest period. Thus, tonic depletion of the primed pool is avoided. Note that the model indicates that this can occur even if priming and resupply are both amplified by glucose metabolism, provided the off period is sufficiently long (see section on potentiation in Results).
In addition to calcium, metabolism oscillates (34), so we have also investigated the phase relationships between the two and found that the mean insulin secretion rate increases if the two signals are in phase and decreases if they are out of phase. The phasic enhancement is effective only if the amplifying signal interacts with a step that is [Ca2+]i dependent. This is not surprising but has not previously been considered and may prove useful for discriminating between candidate mechanisms for metabolic and calcium oscillations on the basis of the phase relationships between the two oscillatory subsystems.
Based on a careful counting of vesicles in several compartments in rat β-cells, Straub and Sharp (13) proposed yet another model for biphasic insulin secretion, in which the rate-limiting step is transfer from a readily releasable pool (RRP) to an immediately releasable pool, which would correspond most closely to our rate constant r1, for binding vesicles to the Ca2+-channel microdomain. That pool, however, is described as having 50–100 vesicles, which would correspond better to our primed pool. We found, in contrast to either hypothesis, that the only rate constant with the right properties to mediate a rising second-phase secretion is r3, for resupply from the reserve pool to the docked pool.
The argument of Straub and Sharp was based largely on the observation that the number of vesicles in the docked pool at rest is approximately equal to the number released in the first and second phases combined, which they interpreted to mean that no vesicle resupply is required. Our model simulations, however, show that without enhanced resupply due to glucose metabolism, the rate of secretion decreases nearly to 0 after the first phase (Fig. 4, upper panels). This is because the flux of vesicles from the docked pool to the primed pool is the product of the docked pool size and the priming rate, r2. Thus, a rising rate of secretion in second phase implies that either the rate of priming grows in time or, more likely, that the docked pool grows due to an increased rate of resupply, r3.
The site of action of the amplifying factor was assigned to the transfer from the “docked pool” to the RRP (Fig. 6 in Rorsman and Renstrom (11)). This corresponds to our priming step, rate r2, and is associated with an ATP-dependent kinetic component similar to, but somewhat more rapid than, that in Fig. 12 B. (Note that we have subdivided their RRP into primed vesicles (pool 5) and microdomain-bound vesicles (pool 1) to account for the rapid exocytotic burst seen in brief depolarizations in single-cell experiments.) As suggested above, this may well be the site that accounts for amplification during classical islet phase 1 (first 10 min), but the model suggests that this is a kinetically distinct step from the one that mediates islet phase 2 (10–60 min). It may be affected by the same amplification factor or a different one; the model is silent on this.
The hierarchy of timescales is illustrated in Fig. 12, which shows behavior during the first second, the first minute, and the first hour. On each timescale there are biphasic kinetics, but they each correspond to a different rate-limiting step, first microdomain binding (rate r1), then priming (rate r2), and finally resupply to the docked pool from the reserve (rate r3). These have each been proposed, as mentioned above, as the rate-limiting step in secretion; but the model shows that the rate-limiting step evolves over time as the β-cell sequentially dumps pools that are more distal from the calcium channels, larger and slower. This is why, for example, we were able to scale down the fast fusion rate by more than an order of magnitude (Fig. 12 A) with little effect on the slow biphasic kinetics (Fig. 12 C). After the first few minutes the rate of release is entirely controlled by the size of the docked pool, with the more proximal pools following in equilibrium. This also means that, although the model is based on a fit to many parameters, only a few have an impact on the slow kinetics, so that our conclusion that resupply is rate limiting for second-phase secretion in islets is well constrained.
Of course, the faster steps proximal to the release site must also be elevated above basal rates or vesicles would accumulate at the plasma membrane rather than be exocytosed. Under the physiological stimulus of glucose, the triggering Ca2+-signal and the amplifying signal or signals are all activated in parallel. The latter are slower but blend in seamlessly with the fast release steps that require only Ca2+-elevation when the β-cells see slowly rising glucose, as they would when delivery is oral. It is only the artificial stimulus of a glucose step that has unmasked the existence of separate components. The view that emerges of the exocytotic cascade from these considerations is similar to a just-in-time factory assembly line, in which all the rates are increased in a coordinated fashion to increase throughput smoothly on demand.
Acknowledgments
We thank Morten Gram Pedersen and Richard Bertram for a careful reading of the manuscript and Pranay Goel and Brad Peercy for helpful discussions.
This work was supported by the intramural research program of the National Institute of Diabetes and Digestive and Kidney Diseases, National Institutes of Health.
Editor: Robert Hsiu-Ping Chow.
References
- 1.Eddlestone, G. T., A. Goncalves, J. A. Bangham, and E. Rojas. 1984. Electrical coupling between cells in islets of Langerhans from mouse. J. Membr. Biol. 77:1–14. [DOI] [PubMed] [Google Scholar]
- 2.Jonkers, F. C., and J. C. Henquin. 2001. Measurements of cytoplasmic Ca2+ in islet cell clusters show that glucose rapidly recruits β-cells and gradually increases the individual cell response. Diabetes. 50:540–550. [DOI] [PubMed] [Google Scholar]
- 3.Brenner, M. B., J. Gromada, A. M. Efanov, K. Bokvist, and H. J. Mest. 2003. Restoration of first-phase insulin secretion by the imidazoline compound LY374284 in pancreatic islets of diabetic db/db mice. Ann. N. Y. Acad. Sci. 1009:332–340. [DOI] [PubMed] [Google Scholar]
- 4.Gerich, J. E. 2002. Is reduced first-phase insulin release the earliest detectable abnormality in individuals destined to develop type 2 diabetes? Diabetes. 51(Suppl. 1):S117–S121. [DOI] [PubMed] [Google Scholar]
- 5.Chow, R. H., L. von Ruden, and E. Neher. 1992. Delay in vesicle fusion revealed by electrochemical monitoring of single secretory events in adrenal chromaffin cells. Nature. 356:60–63. [DOI] [PubMed] [Google Scholar]
- 6.Gillis, K. D., and R. H. Chow. 1997. Kinetics of exocytosis in adrenal chromaffin cells. Semin. Cell Dev. Biol. 8:133–140. [DOI] [PubMed] [Google Scholar]
- 7.Oheim, M., D. Loerke, W. Stuhmer, and R. H. Chow. 1998. The last few milliseconds in the life of a secretory granule. Docking, dynamics and fusion visualized by total internal reflection fluorescence microscopy (TIRFM). Eur. Biophys. J. 27:83–98. [DOI] [PubMed] [Google Scholar]
- 8.Barg, S., C. S. Olofsson, J. Schriever-Abeln, A. Wendt, S. Gebre-Medhin, E. Renstrom, and P. Rorsman. 2002. Delay between fusion pore opening and peptide release from large dense-core vesicles in neuroendocrine cells. Neuron. 33:287–299. [DOI] [PubMed] [Google Scholar]
- 9.Barg, S. 2003. Mechanisms of exocytosis in insulin-secreting B-cells and glucagon-secreting A-cells. Pharmacol. Toxicol. 92:3–13. [DOI] [PubMed] [Google Scholar]
- 10.Gerber, S. H., and T. C. Sudhof. 2002. Molecular determinants of regulated exocytosis. Diabetes. 51(Suppl. 1):S3–S11. [DOI] [PubMed] [Google Scholar]
- 11.Rorsman, P., and E. Renstrom. 2003. Insulin granule dynamics in pancreatic β cells. Diabetologia. 46:1029–1045. [DOI] [PubMed] [Google Scholar]
- 12.Neher, E. 1998. Vesicle pools and Ca2+ microdomains: new tools for understanding their roles in neurotransmitter release. Neuron. 20:389–399. [DOI] [PubMed] [Google Scholar]
- 13.Straub, S. G., and G. W. Sharp. 2004. Hypothesis: one rate-limiting step controls the magnitude of both phases of glucose-stimulated insulin secretion. Am. J. Physiol. Cell Physiol. 287:C565–C571. [DOI] [PubMed] [Google Scholar]
- 14.Jahn, R. 2004. Principles of exocytosis and membrane fusion. Ann. N. Y. Acad. Sci. 1014:170–178. [DOI] [PubMed] [Google Scholar]
- 15.Jahn, R., T. Lang, and T. C. Sudhof. 2003. Membrane fusion. Cell. 112:519–533. [DOI] [PubMed] [Google Scholar]
- 16.Kanno, T., X. Ma, S. Barg, L. Eliasson, J. Galvanovskis, S. Gopel, M. Larsson, E. Renstrom, and P. Rorsman. 2004. Large dense-core vesicle exocytosis in pancreatic β-cells monitored by capacitance measurements. Methods. 33:302–311. [DOI] [PubMed] [Google Scholar]
- 17.Gopel, S., Q. Zhang, L. Eliasson, X. S. Ma, J. Galvanovskis, T. Kanno, A. Salehi, and P. Rorsman. 2004. Capacitance measurements of exocytosis in mouse pancreatic α-, β- and δ-cells within intact islets of Langerhans. J. Physiol. 556:711–726. [DOI] [PMC free article] [PubMed] [Google Scholar]
- 18.Michael, D. J., H. Cai, W. Xiong, J. Ouyang, and R. H. Chow. 2006. Mechanisms of peptide hormone secretion. Trends Endocrinol. Metab. 17:408–415. [DOI] [PubMed] [Google Scholar]
- 19.Voets, T. 2000. Dissection of three Ca2+-dependent steps leading to secretion in chromaffin cells from mouse adrenal slices. Neuron. 28:537–545. [DOI] [PubMed] [Google Scholar]
- 20.Voets, T., E. Neher, and T. Moser. 1999. Mechanisms underlying phasic and sustained secretion in chromaffin cells from mouse adrenal slices. Neuron. 23:607–615. [DOI] [PubMed] [Google Scholar]
- 21.Jing, X., D. Q. Li, C. S. Olofsson, A. Salehi, V. V. Surve, J. Caballero, R. Ivarsson, I. Lundquist, A. Pereverzev, T. Schneider, P. Rorsman, and E. Renstrom. 2005. CaV2.3 calcium channels control second-phase insulin release. J. Clin. Invest. 115:146–154. [DOI] [PMC free article] [PubMed] [Google Scholar]
- 22.Gembal, M., P. Gilon, and J. C. Henquin. 1992. Evidence that glucose can control insulin release independently from its action on ATP-sensitive K+ channels in mouse B cells. J. Clin. Invest. 89:1288–1295. [DOI] [PMC free article] [PubMed] [Google Scholar]
- 23.Aizawa, T., Y. Sato, F. Ishihara, N. Taguchi, M. Komatsu, N. Suzuki, K. Hashizume, and T. Yamada. 1994. ATP-sensitive K+ channel-independent glucose action in rat pancreatic β-cell. Am. J. Physiol. 266:C622–C627. [DOI] [PubMed] [Google Scholar]
- 24.Aizawa, T., Y. Sato, M. Komatsu, and K. Hashizume. 1992. ATP-sensitive K+ channel-independent, insulinotropic action of glucose in the B-cells. Endocr. Regul. 26:159–162. [PubMed] [Google Scholar]
- 25.Sato, Y., T. Aizawa, M. Komatsu, N. Okada, and T. Yamada. 1992. Dual functional role of membrane depolarization/Ca2+ influx in rat pancreatic B-cell. Diabetes. 41:438–443. [DOI] [PubMed] [Google Scholar]
- 26.Sato, Y., M. Anello, and J. C. Henquin. 1999. Glucose regulation of insulin secretion independent of the opening or closure of adenosine triphosphate-sensitive K+ channels in β cells. Endocrinology. 140:2252–2257. [DOI] [PubMed] [Google Scholar]
- 27.Henquin, J. C., M. Nenquin, P. Stiernet, and B. Ahren. 2006. In vivo and in vitro glucose-induced biphasic insulin secretion in the mouse: pattern and role of cytoplasmic Ca2+ and amplification signals in β-cells. Diabetes. 55:441–451. [DOI] [PubMed] [Google Scholar]
- 28.Henquin, J. C. 2000. Triggering and amplifying pathways of regulation of insulin secretion by glucose. Diabetes. 49:1751–1760. [DOI] [PubMed] [Google Scholar]
- 29.Straub, S. G., and G. W. Sharp. 2002. Glucose-stimulated signaling pathways in biphasic insulin secretion. Diabetes Metab. Res. Rev. 18:451–463. [DOI] [PubMed] [Google Scholar]
- 30.Bertuzzi, A., S. Salinari, and G. Mingrone. 2007. Insulin granule trafficking in β-cells: mathematical model of glucose-induced insulin secretion. Am. J. Physiol. Endocrinol. Metab. 293:E396–E409. [DOI] [PubMed] [Google Scholar]
- 31.Grodsky, G. M. 1972. A threshold distribution hypothesis for packet storage of insulin and its mathematical modeling. J. Clin. Invest. 51:2047–2059. [DOI] [PMC free article] [PubMed] [Google Scholar]
- 32.Bertram, R., L. Satin, M. Zhang, P. Smolen, and A. Sherman. 2004. Calcium and glycolysis mediate multiple bursting modes in pancreatic islets. Biophys. J. 87:3074–3087. [DOI] [PMC free article] [PubMed] [Google Scholar]
- 33.Pedersen, M. G., R. Bertram, and A. Sherman. 2005. Intra- and inter-islet synchronization of metabolically driven insulin secretion. Biophys. J. 89:107–119. [DOI] [PMC free article] [PubMed] [Google Scholar]
- 34.Bertram, R., A. Sherman, and L. S. Satin. 2007. Metabolic and electrical oscillations: partners in controlling pulsatile insulin secretion. Am. J. Physiol. Endocrinol. Metab. 293:E890–E900. [DOI] [PubMed] [Google Scholar]
- 35.Chen, Y., A. Sherman, and S. Wang. 2005. Quantitative kinetic modeling of Ca++-triggered granule fusion and exocytosis in pancreatic β cells: studies on the effect of the amplifying signal on the kinetics of insulin secretion. Diabetes. 54:A414. [Google Scholar]
- 36.Wiser, O., M. Trus, A. Hernandez, E. Renstrom, S. Barg, P. Rorsman, and D. Atlas. 1999. The voltage sensitive Lc-type Ca2+ channel is functionally coupled to the exocytotic machinery. Proc. Natl. Acad. Sci. USA. 96:248–253. [DOI] [PMC free article] [PubMed] [Google Scholar]
- 37.Barg, S., L. Eliasson, E. Renstrom, and P. Rorsman. 2002. A subset of 50 secretory granules in close contact with L-type Ca2+ channels accounts for first-phase insulin secretion in mouse β-cells. Diabetes. 51(Suppl. 1):S74–S82. [DOI] [PubMed] [Google Scholar]
- 38.Satin, L. S. 2000. Localized calcium influx in pancreatic β-cells: its significance for Ca2+-dependent insulin secretion from the islets of Langerhans. Endocrine. 13:251–262. [DOI] [PubMed] [Google Scholar]
- 39.Henquin, J. C., N. Ishiyama, M. Nenquin, M. A. Ravier, and J. C. Jonas. 2002. Signals and pools underlying biphasic insulin secretion. Diabetes. 51(Suppl. 1):S60–S67. [DOI] [PubMed] [Google Scholar]
- 40.Simon, S. M., and R. R. Llinas. 1985. Compartmentalization of the submembrane calcium activity during calcium influx and its significance in transmitter release. Biophys. J. 48:485–498. [DOI] [PMC free article] [PubMed] [Google Scholar]
- 41.Bertram, R., and A. Sherman. 2004. A calcium-based phantom bursting model for pancreatic islets. Bull. Math. Biol. 66:1313–1344. [DOI] [PubMed] [Google Scholar]
- 42.Chen, L., D. S. Koh, and B. Hille. 2003. Dynamics of calcium clearance in mouse pancreatic β-cells. Diabetes. 52:1723–1731. [DOI] [PubMed] [Google Scholar]
- 43.Yang, Y., and K. D. Gillis. 2004. A highly Ca2+-sensitive pool of granules is regulated by glucose and protein kinases in insulin-secreting INS-1 cells. J. Gen. Physiol. 124:641–651. [DOI] [PMC free article] [PubMed] [Google Scholar]
- 44.Ohara-Imaizumi, M., and S. Nagamatsu. 2006. Insulin exocytotic mechanism by imaging technique. J. Biochem. (Tokyo). 140:1–5. [DOI] [PubMed] [Google Scholar]
- 45.Ohara-Imaizumi, M., C. Nishiwaki, T. Kikuta, S. Nagai, Y. Nakamichi, and S. Nagamatsu. 2004. TIRF imaging of docking and fusion of single insulin granule motion in primary rat pancreatic β-cells: different behaviour of granule motion between normal and Goto-Kakizaki diabetic rat β-cells. Biochem. J. 381:13–18. [DOI] [PMC free article] [PubMed] [Google Scholar]
- 46.Duncan, R. R., J. Greaves, U. K. Wiegand, I. Matskevich, G. Bodammer, D. K. Apps, M. J. Shipston, and R. H. Chow. 2003. Functional and spatial segregation of secretory vesicle pools according to vesicle age. Nature. 422:176–180. [DOI] [PubMed] [Google Scholar]
- 47.Michael, D. J., R. A. Ritzel, L. Haataja, and R. H. Chow. 2006. Pancreatic β-cells secrete insulin in fast- and slow-release forms. Diabetes. 55:600–607. [DOI] [PubMed] [Google Scholar]
- 48.Ravier, M. A., and J. C. Henquin. 2002. Time and amplitude regulation of pulsatile insulin secretion by triggering and amplifying pathways in mouse islets. FEBS Lett. 530:215–219. [DOI] [PubMed] [Google Scholar]
- 49.Bratanova-Tochkova, T. K., H. Cheng, S. Daniel, S. Gunawardana, Y. J. Liu, J. Mulvaney-Musa, T. Schermerhorn, S. G. Straub, H. Yajima, and G. W. Sharp. 2002. Triggering and augmentation mechanisms, granule pools, and biphasic insulin secretion. Diabetes. 51(Suppl. 1):S83–S90. [DOI] [PubMed] [Google Scholar]
- 50.Szollosi, A., M. Nenquin, and J. C. Henquin. 2007. Overnight culture unmasks glucose-induced insulin secretion in mouse islets lacking ATP-sensitive K+ channels by improving the triggering Ca2+ signal. J. Biol. Chem. 282:14768–14776. [DOI] [PubMed] [Google Scholar]
- 51.Grill, V., U. Adamson, and E. Cerasi. 1978. Immediate and time-dependent effects of glucose on insulin release from rat pancreatic tissue. Evidence for different mechanisms of action. J. Clin. Invest. 61:1034–1043. [DOI] [PMC free article] [PubMed] [Google Scholar]
- 52.Nesher, R., and E. Cerasi. 1987. Biphasic insulin release as the expression of combined inhibitory and potentiating effects of glucose. Endocrinology. 121:1017–1024. [DOI] [PubMed] [Google Scholar]
- 53.Cerasi, E. 1975. Potentiation of insulin release by glucose in man. Acta Endocrinol. (Copenh.). 79:511–534. [DOI] [PubMed] [Google Scholar]
- 54.Cerasi, E. 1975. Potentiation of insulin release by glucose in man. II. Role of the insulin response, and enhancement of stimuli other than glucose. Acta Endocrinol. (Copenh.). 79:502–510. [PubMed] [Google Scholar]
- 55.Cerasi, E. 1975. Potentiation of insulin release by glucose in man. I. Quantitative analysis of the enhancement of glucose-induced insulin secretion by pretreatment with glucose in normal subjects. Acta Endocrinol. (Copenh.). 79:483–501. [PubMed] [Google Scholar]
- 56.Chen, M., and D. Porte, Jr. 1976. The effect of rate and dose of glucose infusion on the acute insulin response in man. J. Clin. Endocrinol. Metab. 42:1168–1175. [DOI] [PubMed] [Google Scholar]
- 57.Schulla, V., E. Renstrom, R. Feil, S. Feil, I. Franklin, A. Gjinovci, X. J. Jing, D. Laux, I. Lundquist, M. A. Magnuson, S. Obermuller, C. S. Olofsson, A. Salehi, A. Wendt, N. Klugbauer, C. B. Wollheim, P. Rorsman, and F. Hofmann. 2003. Impaired insulin secretion and glucose tolerance in β cell-selective Ca(v)1.2 Ca2+ channel null mice. EMBO J. 22:3844–3854. [DOI] [PMC free article] [PubMed] [Google Scholar]
- 58.Grodsky, G., H. Landahl, D. Curry, and L. Bennett. 1970. A two-compartmental model for insulin secretion. Adv. Metab. Disord. 1(Suppl. 1):45–50. [PubMed] [Google Scholar]
- 59.Cerasi, E., G. Fick, and M. Rudemo. 1974. A mathematical model for the glucose induced insulin release in man. Eur. J. Clin. Invest. 4:267–278. [DOI] [PubMed] [Google Scholar]
- 60.Nunemaker, C. S., D. H. Wasserman, O. P. McGuinness, I. R. Sweet, J. C. Teague, and L. S. Satin. 2006. Insulin secretion in the conscious mouse is biphasic and pulsatile. Am. J. Physiol. Endocrinol. Metab. 290:E523–E529. [DOI] [PubMed] [Google Scholar]