

Abstract
Functional genomics has emerged over the past ten years as a novel technology to study genetic alterations. Gene expression arrays are one genomic technique employed to discover changes in the DNA expression that occur in neoplastic transformation. Microarrays have been applied to investigating lung cancer. Specific applications include discovering novel genetic changes that occur in lung tumors. Microarrays can also be applied to improve diagnosis, staging, and discover prognostic markers. The eventual goal of this technology is to discover new markers for therapy and to customize therapy based on an individual tumor genetic composition. In this review, we present the current state of gene expression array technology in its application to lung cancer.
Keywords: Lung cancer, genomics, gene expression arrays, gene expression profiling, diagnosis, staging, prognosis, treatment, therapy, management
Introduction
Cancer is the second leading cause of death in the United States, second only to cardiovascular diseases. In 2007, one in four deaths was due to cancer. Approximately 1.4 million people were diagnosed with cancer, and over a half million people died from cancer last year [1]. The top five most common cancer-related deaths were due to lung, breast, prostate, colorectal and pancreatic cancer. Together, these five diseases accounted for over one-half of all cancer deaths in the United States in 2007 [1]. Lung cancer alone killed over 160,000 people, more than the other four diseases put together. The prognosis from lung cancer remains dismal at 15% five year survival across all stages.
Despite the epidemic amongst smokers, we still know very little about the disease and therapies remain dismal. We continue to have limited understanding of the pathophysiology of this disease and a lack of a diagnostic serum marker. Gene expression profiling promises to provide a more functional molecular understanding of this disease. This information will assist in both staging, understanding pathophysiology, prognostication and therapeutic decision trees. In this article, we review how gene expression arrays analyzing lung cancer is being used to advance our knowledge in all aspects of this disease.
Gene expression profiling
Genomics is the study of genomes and the complete collection of genes they contain [2]. Completed in 2003, the Human Genome Project (HGP) was a 13-year project coordinated by the U.S. Department of Energy and the National Institutes of Health to identify all the 40,000–50,000 genes in human DNA, and to determine the sequences of the 3 billion chemical base pairs that make up human DNA [3, 4]. The sequencing of the genome has given us the molecular blueprints for the genetic profile of human tissue.
Multiple techniques have evolved over the past 15 years to allow for rapid measurement of gene expression. These technologies allow for simultaneous high-throughput measurement of thousands of genes from several hundred samples. Different parts of the gene-protein relationship can be measured such as messenger RNA levels, protein expression and cellular metabolic activity. Some of the available genomic technologies include gene expression arrays, serial analysis of gene expression (SAGE), single-nucleotide polymorphism (SNP) analysis, and high-throughput capillary sequencing.
Genomic technology has several potential applications to lung cancer research including a better understanding of the pathogenesis of lung cancer (molecular changes, pathways), facilitating early detection of cancer, improving pathological staging, defining prognosis, individualizing therapy and finding new targets of therapy. The ultimate goal is to discover genetic transformations that have occurred in a cancer cell that can be manipulated to kill the neoplastic cell. For example, this can be done by finding genetic changes such as tumor suppressor genes or oncogenes that are susceptible to biological agents. Other uses of genomic technology is to use the genetic profile of a neoplastic cell to decide what therapy the cell will be most susceptible to. Genomic technology allows us to learn more about the pathophysiology of cancer cells. Genetic analysis also permits the identification of genes differentially expressed for diagnosis and developing novel disease classification methods. These subclasses would more accurately reflect tumor biology than routine staging.
Gene expression arrays is a technique that can be used to compare normal and cancerous tissues [5]. Gene expression profiling was first described in 1995 for the high-throughput analysis of complentary DNA (cDNA) by Schena and colleagues [6]. In the simplest terms, a cDNA microarray is a modified Northern blot. On a cDNA array, messenger RNA clones are spotted on arrays in a matrix where one analyzes the relative expression level of a gene by determining the amount of messenger RNA (mRNA) that is present. Unlike a conventional Northern blot where one can analyze one, two, or even 10 to 20 mRNAs, a cDNA microarray allows the simultaneous analysis of the expression levels of hundreds, thousands, or even tens of thousands of genes in a single experiment. There are several steps to performing an experiment with gene expression microarrays: RNA isolation, cDNA generation, probe labeling, microarray hybridization and imaging. Analysis of microarray data can be quite complex. Gene arrays generate thousands of data points that require sophisticated analysis techniques. An entire field of bioinformatics has emerged to analyze array data and to present results in a meaningful fashion such as pathways.
Despite what seems to be a relatively simple experimental design, there are significant error and limitations in these protocols (Table 1). At each step there is the ability to inherit variability into the detection of the tissues genetic profile [7, 8]. In isolating the tumor, the tissues must be carefully selected and fresh tumor needs to be isolated before the mRNA degrades. Contaminating cells (leukocytes, fibroblasts) and surrounding normal tissue can dramatically alter the genetic profile of the sample that is processed. Within different portions of the same tissue, there can be 20% inherent biological variability, therefore, poorly collected samples will amplify the genetic diversity of the results. This error can be further amplified in future steps such as mechanical variability (ie. array production) and experimental variability (ie. methods of RNA extraction and hybridization). Novel techniques such as laser capture microdissection and RNA preserving solutions have been developed to overcome some of these problems [9].
Table 1.
Limitations to gene expression microarray technology
| LIMITATIONS | POTENTIAL SOLUTIONS |
|---|---|
| Tissue quality | Laser capture microdissection
Immunohistochemistry |
| mRNA <> protein | Proteomics |
| Variability | Increase sample size
Confirmational studies |
| Validity & reproducibility | Confirmational studies |
| Applicability | Clinical Trials |
Gene Signatures That Describe Molecular Alterations and Cellular Pathways
Overexpression of oncogenes, loss of tumor suppressor genes and amplification of chromosome copy number have all been associated with carcinogenesis. Historically, immunohistochemistry and blotting techniques have been used to examine gene expression in tumors. A large number of genes, pathways, and chromosomal regions have already been associated with lung cancer [10]. Hundreds of studies have demonstrated increases in chromosomal copy numbers of 1p, 1q, 3q, 5p, 6p, 8q, 12, 17q, 19p, 19q, 20p, 20q, and X chromosome regions, implying that direct-acting oncogenes relevant to the tumorigenic process reside in these chromosomal regions [11, 12]. Further analysis has led us to discover oncogenes on these chromosomes such as c-Myc, mutated K-ras, EGFR, cyclin D1, and BcL2. Similarly, decreases in chromosome copy number, which are indicative of the involvement of tumor suppressor genes, also have been described in multiple regions, including 2q, 3p, 4p, 5p, 8p, 9p, 10p, 11p, 11q, 13q, and 17p [12]. Abnormal expression or impaired function of tumor suppressor genes have been discovered in these locations such as p53, p16, Rb, FHIT, RASSFF1A, SEMA3B, PTEN, hOGG1, and BAP1 [11].
This single gene discovery approach, although accurate, is slow and limited to studying one or two genes at a time. Furthermore, despite hundreds of studies which have identified single gene changes, none of these individual markers have had any clinical utility. Clearly, complex biological behaviors of tumors cannot be entirely explained by single gene alterations. Array technology permits us to study multiple genetic alterations and patterns of gene expression changes in lung cancers. Gene expression arrays can be used to screen cancerous tissues to simultaneously localize hundreds of molecular alterations [13]. Furthermore, bioinformatics potentially has the ability to describe the genetic alterations in lung cancer more globally in pathways such as metastasis [14], apoptosis [15] and cell cycle [16].
Distant metastasis is the predominant cause of death in early-stage NSCLC. Diederichs and colleagues applied a microarray approach to identify gene expression changes in pathways involved with metastasis [14]. They examined genetic differences between early-stage NSCLC patients whose cancer ultimately did or did not metastasize during the course of their disease. Transcriptional profiling of 82 microarrays from two patient groups revealed differential expression of several gene families including known predictors of metastasis (e.g., matrix metalloproteinases). In addition, they found S100P, S100A2, trypsinogen C (TRY6), and trypsinogen IVb (PRSS3) to be overexpressed in tumors that metastasized during the course of the disease. In a third group of 42 patients, they confirmed the induction of S100 proteins and trypsinogens in metastasizing tumors. Overexpression of S100A2, S100P, or PRSS3 in NSCLC cell cultures led to increased transendothelial migration, corroborating the role of S100A2, S100P, and PRSS3 in the metastatic process. This array data provided evidence that expression of S100 proteins and trypsinogens is associated with metastasis.
Global genetic alterations in pathways such as apoptosis have also been examined with genomic technology [15]. Singhal and colleagues extracted messenger RNA from 15 patients with poorly differentiated node-negative lung adenocarcinomas and compared their transcripts to 5 patients with normal lung parenchyma. Histology confirmed >70% tumor in the tissues being studied. Using Affymetrix U133 chips, they examined 44,363 genes. Using the Gene Ontology Consortium vocabularly, they identified 308 genes involved in apoptosis [15]. Twenty-four of these genes (7.8%) had at least a two-fold change in gene expression (p<0.001) in neoplastic tissue relative to control tissue (Table 2). Their data demonstrated upregulation of the genes of many apoptotic proteins (ie. Akt) and downregulation of many anti-apoptotic genes (ie. Fas, PTEN, caspase 9). In addition, they identified changes in 10 genes that have not been previously reported to be important in lung cancer (ie. RIP, caspase 1, PDK-1). Using available bioinformatics technology, an apoptotic pathway was developed to gain a better understanding of the various interdependence of these genetic alterations (Figure: Apoptotic Pathway).
Table 2.
Differentially expressed apoptotic genes in NSCLC {Singhal, 2003 #191}.
| A. GENES OVER-EXPRESSED IN PATIENTS WITH LUNG ADENOCARCINOMAS | |||
|---|---|---|---|
| Gene Symbol | Gene Name | Upregulated | p-value |
| BIRC5 | Survivin | 3.9 | 0.00154 |
| AKT1 | Akt | 3.5 | 0.00873 |
| MAP3K14 | NIK (mitogen-activated protein kinase kinase kinase 14) | 2.6 | 0.00382 |
| BCL2L1 | BcL-xL | 2.1 | 0.01604 |
| MDM2 | MDM2 | 1.9 | 0.00212 |
| CASP3 | Caspase 3 | 1.6 | 0.02170 |
| B. GENES DOWN-REGULATED IN PATIENTS WITH LUNG ADENOCARCINOMAS | |||
| Gene Symbol | Gene Name | Down-regulated | p-value |
| PRF1 | Perforin | 3.5 | 0.00001 |
| CTLA1 | Granzyme B | 3.4 | 0.00856 |
| AXUD1 | Axud1 | 2.8 | 0.00011 |
| S100A9 | p14 (ARF, S100 calcium binding protein A9, calgranulin B) | 2.2 | 0.00326 |
| DAPK2 | DAPK 2 (death-associated protein kinase 2) | 2.1 | 0.00010 |
| BAK1 | BAK1 | 2.1 | 0.00376 |
| PTEN | PTEN (phosphatase and tensin homolog) | 1.9 | 0.00346 |
| TNFRSF6 | FAS (tumor necrosis factor receptor superfamily, member 6) | 1.8 | 0.00023 |
| MAP3K7 | TAK 1 (mitogen-activated protein kinase kinase kinase 7) | 1.8 | 0.00034 |
| TNFRSF1A | TNF-alpha receptor | 1.7 | 0.00225 |
| CASP10 | Caspase 10 | 1.7 | 0.00235 |
| NFKBIA | IkappaB | 1.7 | 0.00750 |
| CDKN2D | p19 (cyclin-dependent kinase inhibitor 2D, inhibits CDK4) | 1.6 | 0.00336 |
| C. APOPTOSIS GENES WITH ALTERED GENE EXPRESSION NOT PREVIOUSLY REPORTED IN NSCLC | |||
| Gene Symbol | Gene Name | Upregulated | p-value |
| PDPK1 | PDK1 (3-phosphoinositide dependent protein kinase-1) | 2.2 | 0.00461 |
| Gene Symbol | Gene Name | Down-regulated | p-value |
| RIPK1 | RIP (Receptor interacting protein) | 2.7 | 0.00038 |
| MAP3K6 | MAPKKK6 (mitogen-activated protein kinase kinase kinase 6) | 2.2 | 0.00061 |
| CASP1 | Caspase 1 | 2.1 | 0.00053 |
| CASP5 | Caspase 5 | 2.0 | 0.00031 |
| CYCS | Cytochrome c | 1.9 | 0.00004 |
| CASP2 | Caspase 2 | 1.8 | 0.00004 |
| CRADD | RAIDD | 1.8 | 0.00070 |
| CASP9 | Caspase 9 | 1.7 | 0.00045 |
| APAF1 | Apaf-1 (apoptotic protease activating factor) | 1.6 | 0.00035 |
Figure.
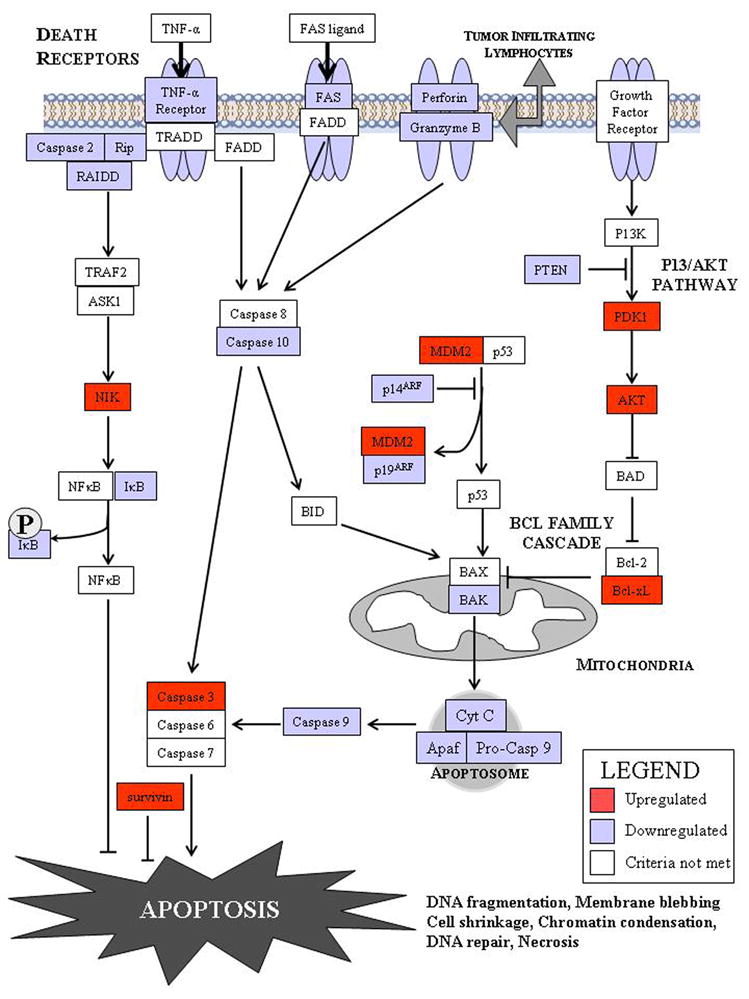
Description of the genetic alterations in apoptotic signaling by using gene expression profiling [15].
Somatic alterations in cellular DNA in lung cancers were recently presented in a large-scale study characterizing the cancer genome in lung adenocarcinoma [17]. By analysis of a large collection of tumours (n = 371) using dense single nucleotide polymorphism arrays, a team of investigators identified a total of 57 significantly recurrent events. They discovered that 26 of 39 autosomal chromosome arms showed consistent large-scale copy-number gain or loss, of which only a handful had been linked to a specific gene. They also identify 31 recurrent focal events, including 24 amplifications and 7 homozygous deletions. Only six of these focal events were associated with known mutations in lung carcinomas. The most common event, amplification of chromosome 14q13.3, was found in approximately 12% of samples. On the basis of genomic and functional analyses, they identified NKX2-1 (which lies in the minimal 14q13.3 amplification interval and encoded a lineage-specific transcription factor) as a novel candidate protooncogene involved in a significant fraction of lung adenocarcinomas [17].
Other examples of genetic alterations in NSCLC that have been discovered or screen in a large number of tumors in a very short time using high-throughput gene expression array technology include thyroid transcription factor-1 [18], BMI-1 [19], PEX1 [20], MKK7 [20], HDAC 3 [20], insulin-like growth factor-binding protein 3 (IGFBP3) [21] and folate receptor [22].
These observations are promising, however, it is important to note some of the limitations of genomic technology (Table 1). One major drawback is arrays measure only messenger RNA levels which may or may not correlate with changes in protein levels. The relationship between mRNA and protein levels is complex and microarray results do not always correlate with protein expression levels [23, 24]. Arrays cannot measure post-translational changes, such as protein phosphorylation, which play an important role in cellular physiology [8]. One solution to this problem is the use of proteomics or high-throughput protein analysis. This technology also has several obstacles that need to be overcome before it is ready for quick application. For example, Huber and colleagues analyzed differences in the gene and protein expression pattern of the human breast carcinoma cell line T47D and its derivative T47D-r. Affymetrix DNA chip hybridizations on the commercially available HuGeneFL and Hu95A arrays were carried out in parallel to the proteomics analysis where the total cellular protein content of T47D or T47D-r was separated on two-dimensional gels. Thirty-eight proteins were found to be reproducibly up- or down-regulated more than 2-fold in T47D-r versus T47D in the proteomics analysis. Comparison with differential mRNA analysis revealed that 19 of these were up- or down-regulated in parallel with the corresponding mRNA molecules. For 11 proteins, the corresponding mRNA was not found to be differentially expressed, and for eight proteins an inverse regulation was found at the mRNA level.
Another limitation of microarray data is that although it gives us a global assessment of genetic alterations, it does lose resolution and accuracy that comes when analyzing genes individually. This highlights the importance of verifying gene expression array results before it can be accepted. In order for array data to have utility, microarray data needs to be independently verified by more accurate methods. Messenger RNA levels are measured by quantitative PCR, northern analysis, or RNAse protection assays. Although the frequency of false positive and false negative expression data with most microarray technologies can be low, confirmation of gene expression data may be performed using a different technique. Quantitative reverse transcription-PCR (RT-PCR) is accepted as the “gold standard.” Most investigators select a panel of candidate genes from their experiments for quantitative RT-PCR that represent the full range of expression seen. The majority of investigators also examine levels of protein expression with Western blots for the same selected candidates. Although this is not strictly required for validation of the gene expression data, it provides useful information with regard to the biology of any interesting candidate genes identified in the experiment and has evolved, for most investigators, into standard practice.
Investigators have been creative about using genomic data to obtain useful information despite these challenges. For example, Sweet-Cordero and colleagues describe a method for comparing mouse models of cancer with human tumors using gene-expression profiling [25]. They applied this method to the analysis of a model of Kras2-mediated lung cancer and found a good relationship to human lung adenocarcinoma, thereby validating the model. However, they found that whereas a gene-expression signature of KRAS2 activation was not identifiable when analyzing human tumors with known KRAS2 mutation status alone, integrating mouse and human data uncovered a gene-expression signature of KRAS2 mutation in human lung cancer. They confirmed the importance of this signature by gene-expression analysis of short hairpin RNA-mediated inhibition of oncogenic Kras2. These experiments identified both a pattern of gene expression indicative of KRAS2 mutation and potential effectors of oncogenic KRAS2 activity in human cancer.
One nicely validated study from M.D. Anderson used a functional genomic approach that integrated simultaneous genomic and transcript microarray, proteomics, and tissue microarray analyses to directly identify putative oncogenes in lung adenocarcinoma [26]. Li and colleagues identified 183 genes with increases in both genomic copy number and transcript in six lung adenocarcinoma cell lines. Next, they used two-dimensional polyacrylamide gel electrophoresis and mass spectrometry to identify 42 proteins that were overexpressed in the cancer cells relative to normal cells. Comparing the 183 genes with the 42 proteins, they identified four genes - PRDX1, EEF1A2, CALR, and KCIP-1 - in which elevated protein expression correlated with both increased DNA copy number and increased transcript levels (all r > 0.84, two-sided P < 0.05). These findings were validated by Southern, Northern, and Western blotting. Specific inhibition of EEF1A2 and KCIP-1 expression with siRNA in the four cell lines tested suppressed proliferation and induced apoptosis. Parallel fluorescence in situ hybridization and immunohistochemical analyses of EEF1A2 and KCIP-1 in tissue microarrays from patients with lung adenocarcinoma showed that gene amplification was associated with high protein expression for both genes and that protein overexpression was related to tumor grade, disease stage, Ki-67 expression, and a shorter survival of patients.
Diagnostic biomarkers discovered by gene expression profiling
One arena which genomic technology has had some success is identifying gene expression patterns that differentiate and classify various types of cancers in the lung. When presented with unidentified tissue, our best method of diagnosis is histology and immunohistochemistry. Combined with clinical suspicion, a diagnosis is made. However, this approach has several limitations. One of the great strides of gene expression profiling is trying to solve diagnostic dilemmas.
One of the challenges facing clinicians include the differentiation of malignant pleural effusions due to a metastatic lung adenocarcinoma from malignant pleural mesothelioma. Fluid cytology is diagnostic in less than 50% of the time, often requiring additional tissue from an open surgical biopsy for immunohistochemistry and cytogenetic analysis [27–29]. Gordon and colleagues utilized gene expression array technology to accurately diagnose the origin of malignant pleural effusions [30]. They analyzed 12,600 mRNA transcripts in 181 fresh tissue samples (150 lung adenocarcinomas and 31 malignant mesotheliomas). They identified eight genes that were significantly elevated eight fold in either mesothelioma or adenocarcinoma tumors: five of these genes were expressed at relatively higher levels in mesothelioma tumors (calretinin, VAC-β, MRC OX-2, PTGIS, and KIAA0977) and three were expressed at relatively higher levels in adenocarcinoma tumors (TACSTD1, claudin-7, and TITF-1). Real-time quantitative PCR was used to verify these gene expression levels. Using these gene expression levels, they calculated 15 expression ratios per sample by dividing the expression value of each of the five genes expressed at relatively higher levels in malignant mesothelioma by the expression value of each of the three genes expressed at relatively higher levels in adenocarcinoma. They tested their ratios to predict the source of 149 tissue samples. Using three expression ratios, Gordon and colleagues found that the differential diagnoses of mesothelioma and adenocarcinoma was 99% accurate.
Another challenge facing clinicians is the determination of the origin of a tumor discovered in the lung parenchyma. Yamagata and colleagues developed a genetic signature that could be used to differentiate primary lung cancer from tumors metastatic to the lung. [31] They analyzed 5200 genes in 24 primary lung tumors and 5 metastatic tumors to the lung. Using hierarchical cluster analysis and Weighted Gene Analysis, they examined genes with a minimum three fold difference in expression. Histological examination was used to verify their findings. To increase confidence in the findings, cDNA clone for all differentially expressed genes were sequenced. They identified 62 genes with significantly different expression levels between primary and metastatic tumors to the lung. This information was then used in a test set of 13 tumor samples of which the origin of 12 were identified accurately.
Metastases of non-pulmonary (ie. breast, ovary, colon) adenocarcinomas can be difficult to differentiate from primarly lung adenocarcinomas [32]. Giordano and colleagues studied the gene expression profiles of 154 primary adenocarcinomas of the lung, colon, and ovary [33]. Using oligonucleotide arrays with 7129 transcripts, comprehensive gene expression profiles of 57 lung, 51 colon, and 46 ovary adenocarcinomas were generated. These statistical analyses resulted in the classification of 152 of 154 of the adenocarcinomas in an organ-specific manner and identified genes expressed in a putative tissue-specific manner for each tumor type. Furthermore, two tumors were identified, one in the colon group and another in the ovarian group, that did not conform to their respective organ-specific cohorts. Investigation of these outlier tumors by immunohistochemical profiling revealed the ovarian tumor was consistent with a metastatic adenocarcinoma of colonic origin and the colonic tumor was a pleomorphic mesenchymal tumor, rather than an epithelial tumor. Their results demonstrate the ability of gene expression profiles to classify adenocarcinomas and suggest that determination of organ-specific gene expression profiles will eventually play a role in a molecular diagnosis of unknown adenocarcinomas discovered in the lung.
Another challenging problem facing clinicians is identification of a primary lung squamous cell carcinoma or metastatic head and neck cancer in patients previously treated for head and neck carcinomas. Because these patients are often heavy tobacco users, they are also at risk for developing a second primary cancer, with squamous cell carcinoma of the lung (LSCC) being the most common. The distinction between a lung metastasis and a primary LSCC is currently based on certain clinical and histological criteria, although the accuracy of this approach remains in question. Genomic methods to identify differentially expressed genes could prove useful and practical in distinguishing primary LSCC from pulmonary metastases. Vachani and colleagues used gene expression patterns derived from 28 patients with HNSCC or LSCC [34]. They identified a panel of 10 genes (CXCL13, COL6A2, SFTPB, KRT14, TSPYL5, TMP3, KLK10, MMP1, GAS1, MYH2) that accurately distinguished these two tumor types. This 10-gene classifier was validated on previously published data for 122 subjects derived from 4 independent Affymetrix datasets. An average accuracy of 96% was demonstrated. Gene expression values were validated by RT-PCR derived on 12 independent samples (7 HNSCC and 5 LSCC). They also applied the 10 gene classifier to gene expression data for 12 lung lesions from patients with prior HNSCC to determine whether their sites of origin could be correctly identified. These results suggest that these 10 genes will be highly accurate in determining the origin of squamous cell carcinomas in the lungs of patients with previous head and neck malignancies.
Gene signatures that improve improve pathological staging and molecular classification
Another application of gene array data is to improve classification of lung cancers. Lung cancer is classified into histological types such as small cell, squamous cell, adeno- or large cell carcinoma. Within these broad categories are some subdivisions, ie. bronchioloalveolar carcinoma for adenocarcinoma. The World Health Organization classification of lung carcinomas represents our current differentiation of lung cancers. The therapy for different tumors and even subclasses of the same histological type can be quite different (ie. adenocarcinoma proper versus bronchioloalveolar features). Furthermore, the grade of the tumor can reflect the degree of mitosis and growth characteristics of a neoplasm. Histopathological staging, however, can be challenging. In one study, three lung pathologists independently examining specimens agreed on the histology of lung adenocarcinomas less than 50% of the time [35]. This decision by pathologists to categorize tumors is critical in deciding what therapies need to be applied. More sophisticated molecular staging of lung cancer promises to more accurately classify tumors by their genetic profile. Gene expression data has already demonstrated the potential to more precisely classifying tumors based on genetic patterns.
There have been several large studies analyzing lung adenocarcinomas for better subclassification based on their genetic imprint [22, 36–38]. Bhattacharjee et al. analyzed mRNA expression levels corresponding to 12,600 transcript sequences in 186 lung tumor samples, including 139 adenocarcinomas resected from the lung [37]. Using sophisticated cluster analysis bioinformatic techniques, they defined four distinct subclasses of lung adenocarcinoma (C1 to C4). In their grouping, C4 had characteristics consistent with bronchioloalveolar carcinoma. Other clusters included C1 (proliferation-associated genes), C2 (neuroendocrine subtypes), and C3 (mixing between subtype 2 and 4). Group C1 primarily consisted of poorly differentiated tumors; C2 and C4 predominately contained well differentiated tumors. Interestingly, C2 had the worst prognosis and C4 had a better prognosis, an outcome that correlates with what is known about bronchioloalveolar carcinoma and adenocarcinoma with neuroendocrine features.
Another study performed to find subclassifications of adenocarcinoma was presented by Garber and colleagues the same year [22]. They analyzed the gene expression profiles from 67 patients with lung cancer (41 adeno-, 16 squamous cell, 5 large cell, and 5 small cell carcinomas) using 24,000 transcript cDNA microarrays. Subdivision of these tumors based on their molecular signature correctly divided these tumors into their respective histological classes. They went on to further subclassify the 41 tumors from patients with adenocarcinomas. Three subgroups of adenocarcinomas were created. On histological examination of these three subgroups, group 1 revealed mainly glandular differentiation and had predominately moderate or well differentiated adenocarcinoma. The median survival for this group was approximately 3 years. Group 2 contained both low and high grade tumors, however, all these patients were still alive at time of last follow up (suggesting grade is not necessarily indicative of patient survival). Group 3 consisted primarily of poorly differentiated lung adenocarcinomas on histological examination. Median survival for this group was less than 8 months.
David Beer and his colleagues profiled primary squamous cell lung carcinomas (SCC) from 129 patients using Affymetrix U133A gene chips [36]. Unsupervised analysis revealed two clusters of SCC that had no correlation with tumor stage but had significantly different overall patient survival (P = 0.036). The high-risk cluster was most significantly associated with down-regulation of epidermal development genes. Cox proportional hazard models identified an optimal set of 50 prognostic mRNA transcripts using a 5-fold cross-validation procedure. This signature was tested in an independent set of 36 SCC samples and achieved 84% specificity and 41% sensitivity with an overall predictive accuracy of 68%. Kaplan-Meier analysis showed clear stratification of high-risk and low-risk patients. Finally, he combined the SCC classifier with their adenocarcinoma prognostic signature and showed that the combined classifier had a predictive accuracy of 71% in 72 NSCLC samples also showing significant differences in overall survival (log-rank P = 0.0002; HR, 3.54; 95% CI, 1.74–7.19).
Although these studies are promising for the future of molecular classification by microarray technology, reproducibility and consistency have been difficult to prove across multiple studies [39]. Bhattacharjee analyzed 186 primary tumors and identified four distinct classes of adenocarcinoma. Similarly, Garber analyzed 67 lung tumors and found three adenocarcinoma subgroups. These subgroups have not correlated to the identifying genes in each group. More likely, their classifications may each reflect the heterogeneity of their samples. Gene expression profiling studies need to capture several thousand patients before they can begin to eliminate the noise that is created by large scale gene expression profiling. Current gene expression profiling studies mix well, moderate and poorly differentiated adenocarcinomas and squamous cell cancers. Furthermore, they often mix various stage diseases. Also, it is difficult to ascertain whether their subgroups reflect meaningful biological differences or is simply a statistical aberration [39]. Bioinformatics technologies have not been adequately tested on high dimensional data [8]. Therefore, results from these analysis cannot be deciphered for what may or may not be valid information. Further validation is pending in these arenas.
Before closing this section, one well performed multi-institutional study was presented by Hayes and colleagues in 2006[38]. Three independent cohorts of patients with lung cancer were evaluated using a variety of DNA microarray assays. Tumor subtypes were selected using consensus clustering and genes distinguishing subtypes were identified using the weighted difference statistic. Gene lists were compared across cohorts using centroids and gene set enrichment analysis. Cohorts of 31, 72, and 128 adenocarcinomas were generated for a total of 231 microarrays. Three adenocarcinoma subtypes were identified in each cohort. These were named bronchioid, squamoid, and magnoid according to their respective correlations with gene expression patterns from histologically defined bronchioalveolar carcinoma, squamous cell carcinoma, and large-cell carcinoma. Tumor subtypes were distinguishable by many hundreds of genes, and lists generated in one cohort were predictive of tumor subtypes in the two other cohorts. Tumor subtypes correlated with clinically relevant covariates, including stage-specific survival and metastatic pattern. Most notably, bronchioid tumors were correlated with improved survival in early-stage disease, whereas squamoid tumors were associated with better survival in advanced disease.
Gene signatures that predict patient outcome
Another potential utility of classifying lung tumors is predicting which lung cancers have good versus poor clinical outcome. Clinically this could be used to determine which patients would benefit from aggressive therapies. Hundreds of studies have examined genetic changes using immunohistochemistry and RT-PCR to identify patients with tumors with a poor outcome [10]. However, no single study has found a gene that is clinically useful in lung cancer to predict prognosis. Gene expression analysis has provided a new technology to examine if a global genetic pattern is better than individual genes at predicting patient outcome.
Beer et al. studied the genetic profile in 86 patients with primary lung adenocarcinoma [40]. Genes most associated with survival were identified to create a risk index based on the top 50 genes that separated patients into low-risk (n=46) and high-risk (n=21). When applying this risk predictor to a test data set of 62 stage I patients from an independent study, they were able to predict survival of lung adenocarcinoma patients with a high degree of statistical significance (p=0.006). The gene list that comprised the risk index included genes not previously associated with survival. Some of the gene expression results were confirmed by Northern blot and immunohistochemistry.
Most importantly, the study identified certain patients with Stage I along with Stage III disease based on gene profile [40]. This demonstrated the ability for gene expression to identify a patient with poor prognosis that is independent of stage at the time of diagnosis. Therefore, genetic profiling provides an added prognostic value when combined with traditional staging and histological analysis in order to select those patients which may be candidates for aggressive therapy.
Guo and colleagues devised a computational model system which predicted the clinical outcome of individual patients based on their gene expression profiles [41]. A 37 gene signature was created using several advanced bioinformatic tools by studying a cohort of 86 patients with lung adenocarcinoma. The prognostic power of the survival predictors was also evaluated using hierarchical cluster analysis and Kaplan-Meier analysis. The gene signature was then applied to predict the survival of 84 patients with adenocarcinomas. The predictive accuracy of the gene signature was 96%. The cluster analysis, using the 37-gene signature, aggregated the test patient samples into three groups with good (mean survival 66.9 months), moderate (mean survival 27.6 months) and poor (mean survival 22.4 months) prognoses (Kaplan-Meier analysis, P < 0.0005, log-rank test). When the results were examined, all patients that had grouped together in cluster 1 (good prognosis) had stage I disease. Their results demonstrated that prediction models based on the expression levels of a small number of marker genes could potentially predict patient outcome for individualized therapy.
One of the problems with genomics data and interpretations is there has not been any consistency across multiple studies. No one can correlate if one analysis method is more accurate than another; often different methods yield sharply different results. For example, ornithine decarboxylase was listed as a gene highly expressed in the good outcome class in one study [22] and poor outcome class for another [37]. Attempts have been made to compare findings from several of the studies reviewed above (Garber et al, Beer et al, Bhattacharjee et al.) [22, 37, 40]. These findings have been inconsistent across reports.
Parmigiani and colleagues evaluated to what extent these three studies agree and whether the results could be integrated [42]. They performed cross-study comparison, validation, and integration of cancer molecular classification studies. They evaluated genes for consistency of expression patterns to quantify reproducibility. When they compared gene expression levels to differentiate squamous cell carcinoma and adenocarcinoma, their analysis did reveal a large proportion of genes in which the patterns agreed across studies more than would be expected by chance. Correlation for diagnosis of squamous cell carcinoma versus adenocarcinoma was high (0.85) and increased (0.925) when using only the most consistent genes in all three studies. However, as the studies were then used to compare smaller differences, that is differences amongst subclasses of adenocarcinoma, there was a decrease in accuracy. When Parmigiani and colleagues tried to validate across studies the associations of gene expression data with survival, reproducibility was even still less consistent. The one interesting finding in their review was the discovery of 14 genes that were identified as significant predictors of survival in all three studies and led to a combined significance level of 0.00675 and estimated 14.3% false discovery rate.
The Future: Genomics to treat lung cancer?
Surgery is the main therapeutic option for curative intent in lung cancer. However, less than 50% of patients with lung cancer present with resectable stage I–IIIA disease. In advanced disease, systemic chemotherapy prolongs survival. Combination of a platinum agent (carboplatin, cisplatin) with a cytotoxic agent (ie. paclitaxel, docetaxel, gemcitabine) is currently the most accepted therapy. A full understanding of the molecular mechanisms in NSCLC could lead to a more effective therapy for lung cancer. New agents could be developed to target specific proteins altered in lung cancer. Furthermore, it is clear from clinical that certain subsets of patients respond to different agents. Genomics can provide valuable insight into both these goals.
To optimize therapy for a given patient
Several groups are starting to evaluate gene expression profiles from an individual’s tumor to predict the optimal chemotherapy for that person and to predict response to radiation therapy. This will be the first step in customizing therapy for an individual.
Kikuchi and colleagues have performed several innovative studies trying to correlate a patient’s gene expression profile to select the best chemotherapy regimen for that individual [43]. They performed cDNA microarray analysis of 37 NSCLCs after laser-capture microdissection of cancer cells from primary tumors. They compared the gene expression data with measurements of the sensitivity of surgically dissected NSCLC specimens to six anti-cancer drugs (docetaxel, paclitaxel, irinotecan, cisplatin, gemcitabine, and vinorelbine) by the collagen gel droplet embedded culture-drug sensitivity test method. They found significant associations between expression levels of dozens of genes and chemosensitivity of NSCLCs. Their results provide some proof that valuable information for identifying predictive markers for chemotherapeutic agents could be potentially selected.
Petty and colleagues studied the genetic profile of patients with NSCLC to identify a profile that predicts clinical response to platinum-based chemotherapy [44]. Matched tumor and nontumor lung tissues from 8 platinum-treated NSCLC patients were profiled using microarrays containing 22,000 mRNA transcripts. Seventeen genes were correlated with responsiveness to platinum therapy. Lysosomal protease inhibitors (serpinB3, cystatin C) were particularly highly correlated with clinical response and were further confirmed by immunohistochemistry. These results were tested to predict whether eight more patients would be responsive or not to platinum-based chemotherapy. The genetic profile predicted four patients should respond and four patients would not. When compared to the true response based on clinical data, this assay provided an accuracy of 72% and suggested that 53% of patients who are unlikely to benefit from platinum therapy, while missing a very few patients who may benefit by maintaining a high sensitivity for responding patients (94%). Potentially, this could predict which patients would benefit from platinum-based therapy.
The development of a successful radiation sensitivity predictive assay has been a major goal of radiation biology for several decades. Torres-Roca et al. developed a radiation classifier to predict the radiosensitivity of tumor cell lines (not lung cancer) based on gene expression profiles [45]. Their classifier correctly predicted the fraction of tumor cells that would survive at 2 Gy in 22 of 35 cell lines, a result significantly different from chance (P = 0.0002). Gene selection identified three novel genes (RbAp48, RGS19, and R5PIA) of which expression values are correlated with radiation sensitivity. Gene expression was confirmed by quantitative real-time PCR. To biologically validate the classifier, they transfected one of the genes (RbAp48) into three cancer cell lines. RbAp48 overexpression induced radiosensitization (1.5–to 2-fold) when compared with mock-transfected cell lines. They dmonstrated that RbAp48 overexpression correlated with dephosphorylation of Akt, suggesting that RbAp48 may be exerting its effect by antagonizing the Ras pathway. Their study introduced a genomic approach to the identification of novel molecular markers of radiation sensitivity.
Currently, the role of adjuvant chemotherapy for stage I and II NSCLC is controversial. A clinical test that could identify patients likely to recur would be useful in guiding individual treatment strategies. Two groups have developed prediction methods that are promising on this front [46, 47].
Potti et al. identified gene-expression profiles that predicted the risk of recurrence following surgery from a cohort of 89 patients with early-stage NSCLC [47]. They tested their predictor model in 109 patients. The overall predictive accuracy was greater than 70%. The predictor also identified a subgroup of patients with stage IA disease who were at high risk for recurrence and who might be best treated by adjuvant chemotherapy. The gene signature profile predicted recurrence for individual patients significantly better than did clinical prognostic factors and was consistent across all early stages of NSCLC. The model provides a novel technique to estimate a patient’s risk of disease recurrence following surgery and, in principle, to alter decisions regarding the use of adjuvant chemotherapy in early-stage NSCLC.
Another smaller study, but with similar principles, Tomida and colleagues constructed a set of classifier genes from analyzing a total of 8644 genes in 50 non-small-cell lung cancer (NSCLC) cases[46]. The resultant classifier of NSCLCs was used to predict an independent set of six NSCLC patients, 3 squamous and 3 non-squamous. The outcome classifier for nonsquamous cell carcinoma accurately predicted both deaths and one survival. The outcome classifier for squamous cell carcinomas predicted the outcome for only one out of three cases. Okano and colleagues most recently identified candidate proteins for tumor markers to predict the response to gefitinib treatment using protein expression profiling of lung adenocarcinoma tissues from patients who showed a response to treatment [48]. They selected the proteins that best distinguished 31 responders from 16 nonresponders. The predictive performance of the nine proteins was validated examining an additional six responders and eight nonresponders, resulting in positive and negative predictive values of 100% (six of six) and 87.5% (seven of eight), respectively. The differential expression of one of the nine proteins, heart-type fatty acid-binding protein, was successfully validated by ELISA. They also identified 12 proteins as a signature to distinguish tumors based on their epidermal growth factor receptor gene mutation status. This study again demonstrates the enormous potential of molecular guided therapy selection. Another well performed study using profiling of serum markers has begun to identify those patients most likely to benefit from EGFR tyrosine kinase inhibitors [49]. Forty two patients underwent combined therapy with the EGFR tyrosine kinase inhibitor (TKI) gefitinib and the COX-2 inhibitor rofecoxib in platinum-pretreated, relapsed, metastatic NSCLC (n = 45). There was one complete response, two partial responses and 12 patients with stable disease; disease control rate was 35.7% (95% CI, 21.6% to 52.0%). Median time to tumor progression was 55 days (95% CI, 47 to 70 days), and median survival was 144 days (95% CI, 103 to 190 days). Matrix-assisted laser desorption/ionization (MALDI) proteomics analysis of baseline serum samples distinguished patients with an objective response from those with stable disease or progressive disease, and those with disease control from those with progressive disease. These clinical applications of profiling technology for treatment selection is likely to become more common.
To find new genes and new targets of therapy
Another goal of genomic applications is to discover a genetic mutation and then find an agent that is active against this change. The best example of genetic mutations discovered in lung cancer and subsequent development of biological agents is epidermal growth factor receptor (EGFR) [50]. Alterations in EGFR have been discovered in approximately 10% of patients with NSCLC. The treatment of these patients with tyrosine kinase inhibitors (ie. gefitinib, erlotinib) has been developed into a clinically useful therapy. Other single gene mutations that have been discovered in lung cancer include LKB1 [51, 52], EML4-ALK [53, 54], p110 [55], Kras, Her2 and BRAF [56]. Genomic technology, however, has made limited progress in this domain. One problem is even though gene expression profiling is a high-throughput method to finding targets, it does not provide information about whether the changes in gene expression are responsible for biological behavior. High-throughput methods to analyze effects of multiple biological agents on multiple genes simultaneously is being developed (“pharmacogenomics”), however, this technology has several obstacles to overcome before it is ready to be clinically useful.
Conclusion
Genomics could serve as a powerful tool for the classification and analysis of lung cancer. It has the potential to provide new insights into this largely fatal disease. Though the prospects are exciting, functional genomics is still in its very early stages and has a number of potential limitations. Over time, it remains to be seen if gene expression profiling becomes a usable clinical tool. It clearly will have some application in the field of diagnosis and discovery of markers for differentiating tumors. Whether it reaches the holy grail of novel target discovery and customized individual therapy remains is an open question.
Acknowledgments
This work was supported by funding from the Emory Center for Respiratory Health and Emory-GT Center for Cancer Nanotechnology Excellence. The authors would like to thank Dr. Steven M. Albelda and Dr. Charles Powell for their valuable input into preparation of this manuscript
Footnotes
Conflict of interest statement
The authors wish to disclose they have no conflict of interests.
Publisher's Disclaimer: This is a PDF file of an unedited manuscript that has been accepted for publication. As a service to our customers we are providing this early version of the manuscript. The manuscript will undergo copyediting, typesetting, and review of the resulting proof before it is published in its final citable form. Please note that during the production process errors may be discovered which could affect the content, and all legal disclaimers that apply to the journal pertain.
Contributor Information
Sunil Singhal, Assistant Professor of Surgery, General Thoracic Surgery, Emory University School of Medicine, 1365 Clifton Road, NE, Building A, Suite 2100, CT Section, Room A-2212, Atlanta, Georgia 30322, Tel: 404-778-3623, Fax: 404-778-4346, Sunil.Singhal@emoryhealthcare.org
Daniel Miller, Professor of Surgery, Chief, General Thoracic Surgery, Emory University School of Medicine, 1365 Clifton Road, NE, Building A, Suite 2100, CT Section, Room A-2200, Atlanta, Georgia 30322, Tel: 404-778-3623, Fax: 404-778-4346, Daniel.Miller@emoryhealthcare.org.
Suresh Ramalingam, Acting Associate Professor of Hematology-Oncology, Chief of Thoracic Medical Oncology, Emory Winship Cancer Institute, 1365 Clifton Road, Atlanta, GA 30322, Phone: 404-778-5180, Fax: 404-778-5048, S.Ramalingam@emoryhealthcare.org.
Shi-Yong Sun, Associate Professor, Georgia Cancer Coalition Distinguished Cancer Scholar, Department of Hematology and Oncology, Winship Cancer Institute, Emory University School of Medicine, 1365-C Clifton Road, Room C3088, Atlanta, Georgia 30322, Tel: 404-778-2170, Shi-yong.sun@emoryhealthcare.org
References
- 1.Jemal A, Siegel R, Ward E, Murray T, Xu J, Thun MJ. Cancer statistics, 2007. CA Cancer J Clin. 2007;57:43–66. doi: 10.3322/canjclin.57.1.43. [DOI] [PubMed] [Google Scholar]
- 2.Quackenbush J. Microarray analysis and tumor classification. N Engl J Med. 2006;354:2463–2472. doi: 10.1056/NEJMra042342. [DOI] [PubMed] [Google Scholar]
- 3.Watson JD. The human genome project: past, present, and future. Science. 1990;248:44–49. doi: 10.1126/science.2181665. [DOI] [PubMed] [Google Scholar]
- 4.Collins FS, Morgan M, Patrinos A. The Human Genome Project: lessons from large-scale biology. Science. 2003;300:286–290. doi: 10.1126/science.1084564. [DOI] [PubMed] [Google Scholar]
- 5.Tefferi A, Bolander ME, Ansell SM, Wieben ED, Spelsberg TC. Primer on medical genomics. Part III: Microarray experiments and data analysis. Mayo Clin Proc. 2002;77:927–940. doi: 10.4065/77.9.927. [DOI] [PubMed] [Google Scholar]
- 6.Schena M, Shalon D, Davis RW, Brown PO. Quantitative monitoring of gene expression patterns with a complementary DNA microarray. Science. 1995;270:467–470. doi: 10.1126/science.270.5235.467. [DOI] [PubMed] [Google Scholar]
- 7.Dobbin KK, Beer DG, Meyerson M, Yeatman TJ, Gerald WL, Jacobson JW, Conley B, Buetow KH, Heiskanen M, Simon RM, Minna JD, Girard L, Misek DE, Taylor JM, Hanash S, Naoki K, Hayes DN, Ladd-Acosta C, Enkemann SA, Viale A, Giordano TJ. Interlaboratory comparability study of cancer gene expression analysis using oligonucleotide microarrays. Clin Cancer Res. 2005;11:565–572. [PubMed] [Google Scholar]
- 8.Singhal S, Kyvernitis CG, Johnson SW, Kaiser LR, Liebman MN, Albelda SM. Microarray data simulator for improved selection of differentially expressed genes. Cancer Biol Ther. 2003;2:383–391. doi: 10.4161/cbt.2.4.431. [DOI] [PubMed] [Google Scholar]
- 9.Chowdary D, Lathrop J, Skelton J, Curtin K, Briggs T, Zhang Y, Yu J, Wang Y, Mazumder A. Prognostic gene expression signatures can be measured in tissues collected in RNAlater preservative. J Mol Diagn. 2006;8:31–39. doi: 10.2353/jmoldx.2006.050056. [DOI] [PMC free article] [PubMed] [Google Scholar]
- 10.Singhal S, Vachani A, Antin-Ozerkis D, Kaiser LR, Albelda SM. Prognostic implications of cell cycle, apoptosis, and angiogenesis biomarkers in non-small cell lung cancer: a review. Clin Cancer Res. 2005;11:3974–3986. doi: 10.1158/1078-0432.CCR-04-2661. [DOI] [PubMed] [Google Scholar]
- 11.Kopper L, Timar J. Genomics of lung cancer may change diagnosis, prognosis and therapy. Pathol Oncol Res. 2005;11:5–10. doi: 10.1007/BF03032399. [DOI] [PubMed] [Google Scholar]
- 12.Kaminski N, Krupsky M. Gene expression patterns, prognostic and diagnostic markers, and lung cancer biology. Chest. 2004;125:111S–115S. doi: 10.1378/chest.125.5_suppl.111s-a. [DOI] [PubMed] [Google Scholar]
- 13.Thomas RK, Baker AC, Debiasi RM, Winckler W, Laframboise T, Lin WM, Wang M, Feng W, Zander T, MacConaill L, Lee JC, Nicoletti R, Hatton C, Goyette M, Girard L, Majmudar K, Ziaugra L, Wong KK, Gabriel S, Beroukhim R, Peyton M, Barretina J, Dutt A, Emery C, Greulich H, Shah K, Sasaki H, Gazdar A, Minna J, Armstrong SA, Mellinghoff IK, Hodi FS, Dranoff G, Mischel PS, Cloughesy TF, Nelson SF, Liau LM, Mertz K, Rubin MA, Moch H, Loda M, Catalona W, Fletcher J, Signoretti S, Kaye F, Anderson KC, Demetri GD, Dummer R, Wagner S, Herlyn M, Sellers WR, Meyerson M, Garraway LA. High-throughput oncogene mutation profiling in human cancer. Nat Genet. 2007;39:347–351. doi: 10.1038/ng1975. [DOI] [PubMed] [Google Scholar]
- 14.Diederichs S, Bulk E, Steffen B, Ji P, Tickenbrock L, Lang K, Zanker KS, Metzger R, Schneider PM, Gerke V, Thomas M, Berdel WE, Serve H, Muller-Tidow C. S100 family members and trypsinogens are predictors of distant metastasis and survival in early-stage non-small cell lung cancer. Cancer Res. 2004;64:5564–5569. doi: 10.1158/0008-5472.CAN-04-2004. [DOI] [PubMed] [Google Scholar]
- 15.Singhal S, Amin KM, Kruklitis R, Marshall MB, Kucharczuk JC, DeLong P, Litzky LA, Kaiser LR, Albelda SM. Differentially expressed apoptotic genes in early stage lung adenocarcinoma predicted by expression profiling. Cancer Biol Ther. 2003;2:566–571. doi: 10.4161/cbt.2.5.514. [DOI] [PubMed] [Google Scholar]
- 16.Singhal S, Amin KM, Kruklitis R, DeLong P, Friscia ME, Litzky LA, Putt ME, Kaiser LR, Albelda SM. Alterations in cell cycle genes in early stage lung adenocarcinoma identified by expression profiling. Cancer Biol Ther. 2003;2:291–298. doi: 10.4161/cbt.2.3.399. [DOI] [PubMed] [Google Scholar]
- 17.Weir BA, Woo MS, Getz G, Perner S, Ding L, Beroukhim R, Lin WM, Province MA, Kraja A, Johnson LA, Shah K, Sato M, Thomas RK, Barletta JA, Borecki IB, Broderick S, Chang AC, Chiang DY, Chirieac LR, Cho J, Fujii Y, Gazdar AF, Giordano T, Greulich H, Hanna M, Johnson BE, Kris MG, Lash A, Lin L, Lindeman N, Mardis ER, McPherson JD, Minna JD, Morgan MB, Nadel M, Orringer MB, Osborne JR, Ozenberger B, Ramos AH, Robinson J, Roth JA, Rusch V, Sasaki H, Shepherd F, Sougnez C, Spitz MR, Tsao MS, Twomey D, Verhaak RG, Weinstock GM, Wheeler DA, Winckler W, Yoshizawa A, Yu S, Zakowski MF, Zhang Q, Beer DG, Wistuba II, Watson MA, Garraway LA, Ladanyi M, Travis WD, Pao W, Rubin MA, Gabriel SB, Gibbs RA, Varmus HE, Wilson RK, Lander ES, Meyerson M. Characterizing the cancer genome in lung adenocarcinoma. Nature. 2007;450:893–898. doi: 10.1038/nature06358. [DOI] [PMC free article] [PubMed] [Google Scholar]
- 18.Kwei KA, Kim YH, Girard L, Kao J, Pacyna-Gengelbach M, Salari K, Lee J, Choi YL, Sato M, Wang P, Hernandez-Boussard T, Gazdar AF, Petersen I, Minna JD, Pollack JR. Genomic profiling identifies TITF1 as a lineage-specific oncogene amplified in lung cancer. Oncogene. 2008 doi: 10.1038/sj.onc.1211012. [DOI] [PMC free article] [PubMed] [Google Scholar]
- 19.Glinsky GV, Berezovska O, Glinskii AB. Microarray analysis identifies a death-from-cancer signature predicting therapy failure in patients with multiple types of cancer. J Clin Invest. 2005;115:1503–1521. doi: 10.1172/JCI23412. [DOI] [PMC free article] [PubMed] [Google Scholar]
- 20.Bartling B, Hofmann HS, Boettger T, Hansen G, Burdach S, Silber RE, Simm A. Comparative application of antibody and gene array for expression profiling in human squamous cell lung carcinoma. Lung Cancer. 2005;49:145–154. doi: 10.1016/j.lungcan.2005.02.006. [DOI] [PubMed] [Google Scholar]
- 21.Gharib TG, Chen G, Huang CC, Misek DE, Iannettoni MD, Hanash SM, Orringer MB, Beer DG. Genomic and proteomic analyses of vascular endothelial growth factor and insulin-like growth factor-binding protein 3 in lung adenocarcinomas. Clin Lung Cancer. 2004;5:307–312. doi: 10.3816/CLC.2004.n.011. [DOI] [PubMed] [Google Scholar]
- 22.Garber ME, Troyanskaya OG, Schluens K, Petersen S, Thaesler Z, Pacyna-Gengelbach M, van de Rijn M, Rosen GD, Perou CM, Whyte RI, Altman RB, Brown PO, Botstein D, Petersen I. Diversity of gene expression in adenocarcinoma of the lung. Proc Natl Acad Sci U S A. 2001;98:13784–13789. doi: 10.1073/pnas.241500798. [DOI] [PMC free article] [PubMed] [Google Scholar]
- 23.Huber M, Bahr I, Kratzschmar JR, Becker A, Muller EC, Donner P, Pohlenz HD, Schneider MR, Sommer A. Comparison of proteomic and genomic analyses of the human breast cancer cell line T47D and the antiestrogen-resistant derivative T47D-r. Mol Cell Proteomics. 2004;3:43–55. doi: 10.1074/mcp.M300047-MCP200. [DOI] [PubMed] [Google Scholar]
- 24.Cox B, Kislinger T, Emili A. Integrating gene and protein expression data: pattern analysis and profile mining. Methods. 2005;35:303–314. doi: 10.1016/j.ymeth.2004.08.021. [DOI] [PubMed] [Google Scholar]
- 25.Sweet-Cordero A, Mukherjee S, Subramanian A, You H, Roix JJ, Ladd-Acosta C, Mesirov J, Golub TR, Jacks T. An oncogenic KRAS2 expression signature identified by cross-species gene-expression analysis. Nat Genet. 2005;37:48–55. doi: 10.1038/ng1490. [DOI] [PubMed] [Google Scholar]
- 26.Li R, Wang H, Bekele BN, Yin Z, Caraway NP, Katz RL, Stass SA, Jiang F. Identification of putative oncogenes in lung adenocarcinoma by a comprehensive functional genomic approach. Oncogene. 2006;25:2628–2635. doi: 10.1038/sj.onc.1209289. [DOI] [PubMed] [Google Scholar]
- 27.Ueda J, Iwata T, Ono M, Takahashi M. Comparison of three cytologic preparation methods and immunocytochemistries to distinguish adenocarcinoma cells from reactive mesothelial cells in serous effusion. Diagn Cytopathol. 2006;34:6–10. doi: 10.1002/dc.20391. [DOI] [PubMed] [Google Scholar]
- 28.Politi E, Kandaraki C, Apostolopoulou C, Kyritsi T, Koutselini H. Immunocytochemical panel for distinguishing between carcinoma and reactive mesothelial cells in body cavity fluids. Diagn Cytopathol. 2005;32:151–155. doi: 10.1002/dc.20203. [DOI] [PubMed] [Google Scholar]
- 29.Kuralay F, Tokgoz Z, Comlekci A. Diagnostic usefulness of tumour marker levels in pleural effusions of malignant and benign origin. Clin Chim Acta. 2000;300:43–55. doi: 10.1016/s0009-8981(00)00302-8. [DOI] [PubMed] [Google Scholar]
- 30.Gordon GJ, Jensen RV, Hsiao LL, Gullans SR, Blumenstock JE, Ramaswamy S, Richards WG, Sugarbaker DJ, Bueno R. Translation of microarray data into clinically relevant cancer diagnostic tests using gene expression ratios in lung cancer and mesothelioma. Cancer Res. 2002;62:4963–4967. [PubMed] [Google Scholar]
- 31.Yamagata N, Shyr Y, Yanagisawa K, Edgerton M, Dang TP, Gonzalez A, Nadaf S, Larsen P, Roberts JR, Nesbitt JC, Jensen R, Levy S, Moore JH, Minna JD, Carbone DP. A training-testing approach to the molecular classification of resected non-small cell lung cancer. Clin Cancer Res. 2003;9:4695–4704. [PubMed] [Google Scholar]
- 32.Flint A, Lloyd RV. Pulmonary metastases of colonic carcinoma. Distinction from pulmonary adenocarcinoma. Arch Pathol Lab Med. 1992;116:39–42. [PubMed] [Google Scholar]
- 33.Giordano TJ, Shedden KA, Schwartz DR, Kuick R, Taylor JM, Lee N, Misek DE, Greenson JK, Kardia SL, Beer DG, Rennert G, Cho KR, Gruber SB, Fearon ER, Hanash S. Organ-specific molecular classification of primary lung, colon, and ovarian adenocarcinomas using gene expression profiles. Am J Pathol. 2001;159:1231–1238. doi: 10.1016/S0002-9440(10)62509-6. [DOI] [PMC free article] [PubMed] [Google Scholar]
- 34.Vachani A, Nebozhyn M, Singhal S, Alila L, Wakeam E, Muschel R, Powell CA, Gaffney P, Singh B, Brose MS, Litzky LA, Kucharczuk J, Kaiser LR, Marron JS, Showe MK, Albelda SM, Showe LC. A 10-gene classifier for distinguishing head and neck squamous cell carcinoma and lung squamous cell carcinoma. Clin Cancer Res. 2007;13:2905–2915. doi: 10.1158/1078-0432.CCR-06-1670. [DOI] [PubMed] [Google Scholar]
- 35.Sorensen JB, Hirsch FR, Gazdar A, Olsen JE. Interobserver variability in histopathologic subtyping and grading of pulmonary adenocarcinoma. Cancer. 1993;71:2971–2976. doi: 10.1002/1097-0142(19930515)71:10<2971::aid-cncr2820711014>3.0.co;2-e. [DOI] [PubMed] [Google Scholar]
- 36.Raponi M, Zhang Y, Yu J, Chen G, Lee G, Taylor JM, Macdonald J, Thomas D, Moskaluk C, Wang Y, Beer DG. Gene expression signatures for predicting prognosis of squamous cell and adenocarcinomas of the lung. Cancer Res. 2006;66:7466–7472. doi: 10.1158/0008-5472.CAN-06-1191. [DOI] [PubMed] [Google Scholar]
- 37.Bhattacharjee A, Richards WG, Staunton J, Li C, Monti S, Vasa P, Ladd C, Beheshti J, Bueno R, Gillette M, Loda M, Weber G, Mark EJ, Lander ES, Wong W, Johnson BE, Golub TR, Sugarbaker DJ, Meyerson M. Classification of human lung carcinomas by mRNA expression profiling reveals distinct adenocarcinoma subclasses. Proc Natl Acad Sci U S A. 2001;98:13790–13795. doi: 10.1073/pnas.191502998. [DOI] [PMC free article] [PubMed] [Google Scholar]
- 38.Hayes DN, Monti S, Parmigiani G, Gilks CB, Naoki K, Bhattacharjee A, Socinski MA, Perou C, Meyerson M. Gene expression profiling reveals reproducible human lung adenocarcinoma subtypes in multiple independent patient cohorts. J Clin Oncol. 2006;24:5079–5090. doi: 10.1200/JCO.2005.05.1748. [DOI] [PubMed] [Google Scholar]
- 39.Ransohoff DF. How to improve reliability and efficiency of research about molecular markers: roles of phases, guidelines, and study design. Journal of Clinical Epidemiology. 2007;60:1205–1219. doi: 10.1016/j.jclinepi.2007.04.020. [DOI] [PubMed] [Google Scholar]
- 40.Beer DG, Kardia SL, Huang CC, Giordano TJ, Levin AM, Misek DE, Lin L, Chen G, Gharib TG, Thomas DG, Lizyness ML, Kuick R, Hayasaka S, Taylor JM, Iannettoni MD, Orringer MB, Hanash S. Gene-expression profiles predict survival of patients with lung adenocarcinoma. Nat Med. 2002;8:816–824. doi: 10.1038/nm733. [DOI] [PubMed] [Google Scholar]
- 41.Guo L, Ma Y, Ward R, Castranova V, Shi X, Qian Y. Constructing molecular classifiers for the accurate prognosis of lung adenocarcinoma. Clin Cancer Res. 2006;12:3344–3354. doi: 10.1158/1078-0432.CCR-05-2336. [DOI] [PubMed] [Google Scholar]
- 42.Parmigiani G, Garrett-Mayer ES, Anbazhagan R, Gabrielson E. A cross-study comparison of gene expression studies for the molecular classification of lung cancer. Clin Cancer Res. 2004;10:2922–2927. doi: 10.1158/1078-0432.ccr-03-0490. [DOI] [PubMed] [Google Scholar]
- 43.Kikuchi T, Daigo Y, Katagiri T, Tsunoda T, Okada K, Kakiuchi S, Zembutsu H, Furukawa Y, Kawamura M, Kobayashi K, Imai K, Nakamura Y. Expression profiles of non-small cell lung cancers on cDNA microarrays: identification of genes for prediction of lymph-node metastasis and sensitivity to anti-cancer drugs. Oncogene. 2003;22:2192–2205. doi: 10.1038/sj.onc.1206288. [DOI] [PubMed] [Google Scholar]
- 44.Petty RD, Kerr KM, Murray GI, Nicolson MC, Rooney PH, Bissett D, Collie-Duguid ES. Tumor transcriptome reveals the predictive and prognostic impact of lysosomal protease inhibitors in non-small-cell lung cancer. J Clin Oncol. 2006;24:1729–1744. doi: 10.1200/JCO.2005.03.3399. [DOI] [PubMed] [Google Scholar]
- 45.Torres-Roca JF, Eschrich S, Zhao H, Bloom G, Sung J, McCarthy S, Cantor AB, Scuto A, Li C, Zhang S, Jove R, Yeatman T. Prediction of radiation sensitivity using a gene expression classifier. Cancer Res. 2005;65:7169–7176. doi: 10.1158/0008-5472.CAN-05-0656. [DOI] [PubMed] [Google Scholar]
- 46.Tomida S, Koshikawa K, Yatabe Y, Harano T, Ogura N, Mitsudomi T, Some M, Yanagisawa K, Takahashi T, Osada H. Gene expression-based, individualized outcome prediction for surgically treated lung cancer patients. Oncogene. 2004;23:5360–5370. doi: 10.1038/sj.onc.1207697. [DOI] [PubMed] [Google Scholar]
- 47.Potti A, Mukherjee S, Petersen R, Dressman HK, Bild A, Koontz J, Kratzke R, Watson MA, Kelley M, Ginsburg GS, West M, Harpole DH, Jr, Nevins JR. A genomic strategy to refine prognosis in early-stage non-small-cell lung cancer. N Engl J Med. 2006;355:570–580. doi: 10.1056/NEJMoa060467. [DOI] [PubMed] [Google Scholar]
- 48.Okano T, Kondo T, Fujii K, Nishimura T, Takano T, Ohe Y, Tsuta K, Matsuno Y, Gemma A, Kato H, Kudoh S, Hirohashi S. Proteomic signature corresponding to the response to gefitinib (Iressa, ZD1839), an epidermal growth factor receptor tyrosine kinase inhibitor in lung adenocarcinoma. Clin Cancer Res. 2007;13:799–805. doi: 10.1158/1078-0432.CCR-06-1654. [DOI] [PubMed] [Google Scholar]
- 49.O’Byrne KJ, Danson S, Dunlop D, Botwood N, Taguchi F, Carbone D, Ranson M. Combination therapy with gefitinib and rofecoxib in patients with platinum-pretreated relapsed non small-cell lung cancer. J Clin Oncol. 2007;25:3266–3273. doi: 10.1200/JCO.2006.09.2791. [DOI] [PubMed] [Google Scholar]
- 50.Paez JG, Janne PA, Lee JC, Tracy S, Greulich H, Gabriel S, Herman P, Kaye FJ, Lindeman N, Boggon TJ, Naoki K, Sasaki H, Fujii Y, Eck MJ, Sellers WR, Johnson BE, Meyerson M. EGFR mutations in lung cancer: correlation with clinical response to gefitinib therapy. Science. 2004;304:1497–1500. doi: 10.1126/science.1099314. [DOI] [PubMed] [Google Scholar]
- 51.Ji H, Ramsey MR, Hayes DN, Fan C, McNamara K, Kozlowski P, Torrice C, Wu MC, Shimamura T, Perera SA, Liang MC, Cai D, Naumov GN, Bao L, Contreras CM, Li D, Chen L, Krishnamurthy J, Koivunen J, Chirieac LR, Padera RF, Bronson RT, Lindeman NI, Christiani DC, Lin X, Shapiro GI, Janne PA, Johnson BE, Meyerson M, Kwiatkowski DJ, Castrillon DH, Bardeesy N, Sharpless NE, Wong KK. LKB1 modulates lung cancer differentiation and metastasis. Nature. 2007;448:807–810. doi: 10.1038/nature06030. [DOI] [PubMed] [Google Scholar]
- 52.Matsumoto S, Iwakawa R, Takahashi K, Kohno T, Nakanishi Y, Matsuno Y, Suzuki K, Nakamoto M, Shimizu E, Minna JD, Yokota J. Prevalence and specificity of LKB1 genetic alterations in lung cancers. Oncogene. 2007;26:5911–5918. doi: 10.1038/sj.onc.1210418. [DOI] [PMC free article] [PubMed] [Google Scholar]
- 53.Inamura K, Takeuchi K, Togashi Y, Nomura K, Ninomiya H, Okui M, Satoh Y, Okumura S, Nakagawa K, Soda M, Choi YL, Niki T, Mano H, Ishikawa Y. EML4-ALK fusion is linked to histological characteristics in a subset of lung cancers. J Thorac Oncol. 2008;3:13–17. doi: 10.1097/JTO.0b013e31815e8b60. [DOI] [PubMed] [Google Scholar]
- 54.Soda M, Choi YL, Enomoto M, Takada S, Yamashita Y, Ishikawa S, Fujiwara S, Watanabe H, Kurashina K, Hatanaka H, Bando M, Ohno S, Ishikawa Y, Aburatani H, Niki T, Sohara Y, Sugiyama Y, Mano H. Identification of the transforming EML4-ALK fusion gene in non-small-cell lung cancer. Nature. 2007;448:561–566. doi: 10.1038/nature05945. [DOI] [PubMed] [Google Scholar]
- 55.Lin X, Bohle AS, Dohrmann P, Leuschner I, Schulz A, Kremer B, Fandrich F. Overexpression of phosphatidylinositol 3-kinase in human lung cancer. Langenbecks Arch Surg. 2001;386:293–301. doi: 10.1007/s004230100203. [DOI] [PubMed] [Google Scholar]
- 56.Ji H, Wang Z, Perera SA, Li D, Liang MC, Zaghlul S, McNamara K, Chen L, Albert M, Sun Y, Al-Hashem R, Chirieac LR, Padera R, Bronson RT, Thomas RK, Garraway LA, Janne PA, Johnson BE, Chin L, Wong KK. Mutations in BRAF and KRAS converge on activation of the mitogen-activated protein kinase pathway in lung cancer mouse models. Cancer Res. 2007;67:4933–4939. doi: 10.1158/0008-5472.CAN-06-4592. [DOI] [PubMed] [Google Scholar]