

Abstract
Rationale
Malignancy provokes regional changes to vessel shape. Characteristic vessel tortuosity abnormalities appear early during tumor development, affect initially healthy vessels, spread beyond the confines of tumor margins, and do not simply mirror tissue perfusion. The ability to detect and quantify tortuosity abnormalities on high-resolution MRA images offers a new approach to the noninvasive diagnosis of malignancy. This report evaluates a computerized, statistical method of analyzing the shapes of vessels extracted from MRA in diagnosing cancer.
Materials and Methods
The regional vasculature of 34 healthy subjects was compared to the tumor-associated vasculature of 30 brain tumors prior to surgical resection. The operator performing the analysis was blinded to the diagnosis. Vessels were segmented from an MRA of each subject, a region of interest was defined in each tumor patient and was mapped to all healthy controls, and a statistical analysis of vessel shape measures was then performed over the region of interest. Many difficult cases were included, such as pinpoint, hemorrhagic, and irradiated tumors, as were hypervascular benign tumors. Tumors were identified as benign or malignant on the basis of histological evaluation.
Results
A discriminant analysis performed at the study’s conclusion successfully classified all but one of the 30 tumors as benign or malignant on the basis of vessel tortuosity.
Discussion
Quantitative, statistical measures of vessel shape offer a new approach to the diagnosis and staging of disease. Although the methods developed under the current report must be tested against a new series of cases, initial results are promising.
Keywords: Computer, cancer, blood vessels, tortuosity, MRA, brain tumor
INTRODUCTION
A critical stage in cancer growth is the establishment of blood supply. Even the tiniest cancers express growth factors that alter the surrounding vasculature both physiologically and morphologically10, 18. Several imaging methods therefore aim to detect malignancy by searching for foci of neoangiogenesis or of abnormal vascular permeability. Although these techniques show promise, finding a fully reliable, noninvasive method of assessing tumor malignancy has remained an elusive goal3, 9, 17, 26. Particular difficulty may be encountered with the classification of small tumors, hemorrhagic or necrotic lesions, and hypervascular benign tumors.
Many previous approaches have focused upon the microvasculature. Little attention has been given, however, to the malignancy-induced alterations of vessel shape affecting the larger vessels visualized directly by magnetic resonance angiography (MRA). Since cancer and many other diseases alter vessel morphology, the quantitative measurement of vessel shape offers potentially valuable information complementary to that provided by perfusion and other imaging methods. A requirement for quantifying vessel shape, however, is the delineation of individual vessels. Although MRA permits such delineation, resolution limitations preclude capillary visualization. However, as outlined in the following section, even incipient cancers induce widespread vessel shape changes that may be visualized by high-resolution MRA.
An earlier conference report5 employed many of the methods described in the current paper. The current study includes a larger series, restricts analysis to subjects imaged at the same voxel size, provides better normalization of the tortuosity metrics, offers a new discriminant analysis, and discusses background information, methods, and results in more detail. The goal is to employ computerized measures of vessel shape, as determined from high-resolution MRA, to assess tumor malignancy. In the current study, images of thirty brain tumors were analyzed prior to gross surgical resection by an operator blinded to all clinical information. Results of the blinded computerized analysis were then compared to the histological diagnosis. The tumors included several types difficult to classify by any method, and included hemorrhagic lesions, hypervascular benign tumors, irradiated cancers, infection, and tiny lesions. All but one of the 30 cases was classified correctly. We conclude that the analysis of vessel shape offers promise for the noninvasive assessment of malignancy.
BACKGROUND
An intriguing observation, made both by those working from histological section2 and by those publishing in the older x-ray angiographic literature23, is that the vasculature associated with malignancy is abnormally shaped. More specifically, cancer vessels possess “…a profound sort of tortuosity, with many smaller bends upon each larger bend”2. These vessel shape changes are found in a wide variety of malignancies, including those of the breast16, brain8, colon25 and lung12.
The resolution of MR imaging does not permit delineation of capillaries. Of importance, however, the vessel shape changes characteristic of malignancy are not confined to capillaries, nor are they associated solely with large, hypervascular tumors. Indeed, vessel morphological changes occur very early during malignant tumor growth, appearing within 24 hours of injection of a few tens of cancer cells10,18. Moreover, the characteristic vessel shape alterations affect not just capillaries, but much larger, initially healthy vessels, and over a distance far beyond that of the tumor margin18. These vessel shape changes also do not correlate directly with blood flow measurements20, but instead appear to be related to the release of growth factors, possibly VEGF10. Of additional importance, vessel shape normalizes rapidly during successful cancer treatment14, 27.
For a variety of reasons, the use of vessel shape measurement therefore seems appealing as a means of in vivo assessment of tumor malignancy. Indeed, the approach may be particularly suited to the analysis of tiny tumors and to other tumor types that have been difficult to classify by other imaging methods. The hypothesis of the current study is that high-quality MRA images possess sufficient resolution to define the abnormally tortuous vessels associated with malignancy, and that computerized calculations of vessel shape can be employed to separate benign from malignant brain tumors.
METHODS
The work was approved by our institutional IRB. The overall approach involved a computerized, regional, statistical analysis of vessel shape. Vessels segmented from the MRA of each preoperative tumor patient were compared to the vessels segmented from a database of thirty-four healthy subjects. A region of interest was defined from each tumor patient and mapped to the brain of each healthy subject. Vessels were defined relative to the region of interest in all cases, and analysis was performed only upon vessel segments clipped to the region of interest. Values obtained from each tumor patient could then be statistically compared to the values derived from the set of healthy subjects. It took about an hour to process each new tumor subject. The final definition of “benign” or “malignant” was based upon clinical histological diagnosis.
Patient selection and image acquisition
Images of thirty-four healthy subjects, ranging in age from nineteen to seventy-two and of both sexes, were used to establish the healthy database. Tumor cases included thirty lesions in twenty-seven patients scheduled for total gross resection of each lesion. Images were obtained prior to surgery. The person performing the analysis was blinded to all clinical information.
Images were obtained upon a head-only 3T MR unit (Allegra, Siemens Medical Systems Inc., Germany) or upon a 1.5T MR unit (Sonata, Siemens Medical Systems Inc., Germany). A head coil was employed. T1, T2 and 3D, time-of-flight MRA images were obtained for all subjects, and tumor patients additionally underwent a gadolinium-enhanced T1 sequence. Imaging parameters were: TR/TE=15msec/7msec for T1, and TR/TE=7730msec/80 msec for T2. Inplane resolution was 1x1 mm2 on both the 1.5T and 3T units, but interslice spacing was 1 mm on the 3T unit and 3mm on the 1.5T unit.
The most critical study was the MRA. Velocity compensation along both frequency and phase encoding directions was used to minimize signal dephasing induced by the flowing spins and a magnetization transfer pulse was employed to suppress signal from brain parenchyma while maintaining signal from flowing spins. As we currently subsample the splines representing each vessel skeleton at a rate dependent upon voxel size, our tortuosity calculations are affected by voxel size7. All subjects in the current study therefore obtained MRA images at the same 0.5 x 0.5 x 0.8 mm3 spacing. Voxel number was 512 x 512 x approximately 160. Parameter settings included FOV=230 x 230, TR=35, TE=3.56 on the 3T unit and 3.5 on the 1.5T unit, flip angle=22, and a matrix of 309 x 448.
Vessel and tumor segmentation
Vessels comprising the total visible intracranial circulation were segmented from the MRAs of all subjects. The vessel segmentation method employed a multi-scale approach that proceeds from user-supplied seed points to automatically define the path of each vessel and to calculate the radius at each vessel point1. This method models a vessel in three steps: (1) definition of a seed point on or near a vessel of interest; (2) automatic, dynamic-scale extraction of an image intensity ridge representing the vessel’s central skeleton; and (3) automatic, dynamic-scale determination of vessel radius at each centerline point, using selection of the optimal response elicited by kernels with a range of apertures and aligned normal to the centerline. More detail on both centerline extraction and radius determination is provided by Aylward1. During segmentation the vessel skeleton is set to a spline, and the output defines each vessel as an ordered, regularly spaced set of x, y, z points indicating the spatial position of that vessel’s centerline with an associated radius at each point. These points were subsequently subsampled to provide equally spaced points separated by the length of one voxel. In this report, we use the term “vessel” to indicate a single, unbranched structure.
Tumor segmentation was performed using either a fully automated method21 or a program that segments tumors via polygon drawing and filling on orthogonal cuts through an image volume (http://www.cs.unc.edu/~gerig/).
The tumor margins were taken as the initial region of interest. Very tiny or hemorrhagic tumors may not contain discernible vessels, however. We decided, relatively arbitrarily, that a minimum of four vessels was required for meaningful analysis. If fewer than four vessels were present within the lesion margins, we outlined the larger, edematous region outside of the tumor as the region of interest. If no edema were present, the lesion was automatically dilated as a ball until it intersected the requisite minimum number of four vessels.
Image registration
Our statistical approach requires mapping a region of interest across multiple subjects. Such mapping requires image registration.
For this study, we decided not to transform the vessels, as affine transformation might alter measurements of tortuosity and other vessel attributes, but rather to deform the region of interest across patients. Vessels were thus analyzed only in their native states. All registrations were performed using Rueckert and Schnabel’s mutual information-based registration program22,24. This program permits rigid, affine, and fully deformable registration. For rigid and affine registrations, the output can be saved as a file convertible to a registration matrix. For this project, we employed only rigid and full affine registrations and saved the output matrices.
In each subject, the T1 image was registered by affine transformation to the McConnell T1 atlas13. All other images of the same subject were then rigidly registered to that subject’s own T1 study. By a combination of forward and backward mapping, using matrix inversion when appropriate, any image could thus be mapped into the coordinate space of any image of the same or of a different subject. This approach requires only a single registration per image, regardless of the number of healthy images to which a tumor image must be mapped.
Vessel attribute measures
Four vessel attribute measures were analyzed, as outlined below. If a vessel traversed the region of interest, the vessel was clipped to the surface and analysis was performed only upon the segment lying within the region. Tumor volume was calculated automatically.
The “Vessel Count” (VC) comprised a count of all individual, unbranched vessels that were either contained within the region of interest or intersected it. The VC provided a measure of vessel density. Within the limits of MRA resolution, one would expect angiogenesis within both benign and malignant tumors to produce an increase in the VC.
The “Average Radius” (AVRAD) summed the radii at all vessel points within the region of interest and divided by the number of vessel points counted.
The “Sum of Angles Metric” (SOAM) was a tortuosity measure that summed the angles between consecutive trios of points along the space curve represented by the vessel skeleton and then normalized by path length4. Results were output as radians/cm. Vessels of high curvature have elevated SOAM values. In particular, the SOAM is effective in detecting high-frequency, low-amplitude coils or sine waves. Figure 1A gives an example of a curve of high SOAM value.
Figure 1.
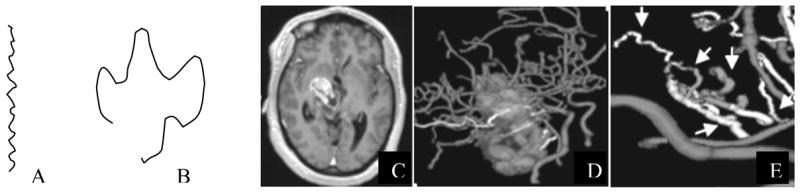
Examples of tortuosity types. A: High frequency wiggles resulting in high curvature per unit distance. This type of tortuosity is characterized by elevated SOAM values. B: larger amplitude curve with frequent changes of direction and a short distance between endpoints. This type of tortuosity is characterized by elevated ICM values. C: T1 gadolinium-enhanced slice of a malignant tumor. D: 3D rendering of segmented tumor and vessels. E: Magnification of a cluster of tumor-associated vessels. The smooth vessels in the foreground lie far outside of the lesion and have a normal shape. The vessels within or traversing the tumor exhibit abnormal tortuosity by both metrics (arrows).
The “Inflection Count Metric” (ICM) was a tortuosity measure that counted “inflection points” along each space curve and multiplied this number (plus one) times the total path length and then divided by the distance between endpoints4. For a 3D space curve, we defined an inflection point as a locus that exhibits a minimum of total curvature. In particular, the Normal and Binormal axes of the Frenet frame11, 15 change orientation by close to 180° as the frame passes through an inflection point. As a result, one can search for 3D inflection points by identifying large local maxima of the dot product ΔN • ΔN, where N is the unit vector representing the Frenet normal axis, and ΔN represents the difference of the normal axes associated with the consecutive points Pk and Pk+1. Results were output as a dimensionless number. The ICM is effective in detecting larger amplitude curves. Figure 1B provides an example of a curve with a high ICM value. Malignant tumor vessels, with the shape of “many smaller bends upon each larger bend”2, exhibit tortuosity increases by SOAM and often by the ICM as well. Figure 1E provides an example of malignant tumor vessels that display both tortuosity abnormalities simultaneously.
Multiple vessels were contained within each region of interest. For each person, we calculated an average for each vessel attribute over all of the vessels contained within (or clipped to) the region of interest. No averaging was required for the VC. For AVRAD, the average radius was calculated by summing the radius values over all vessel points and dividing by the total number of points. For SOAM, the average was calculated by dividing the sum of the curvature values by the sum of the total vessel path lengths. For ICM, the total number of inflection points was multiplied by the sum of the total path lengths and divided by the sum of the distances between endpoints and was further normalized by dividing by the number of vessels analyzed.
Statistical analysis of vessel shape measures
Vessel density, tortuosity, average radius, and a variety of other measures of vessel shape vary from location to location within the head7. It is therefore not possible to define a single set of metrics that define a vessel as “healthy”. As a result, the vessel shape changes induced by malignancy and other focal disease processes must be interpreted within the context of the expected vessel shape measures within the affected region.
We therefore normalized each tumor vessel attribute by the means and standard deviations of the healthy measures derived from the same anatomical region of healthy controls. Each value was represented as a z-score, and all further statistical processing was performed upon these z-scored values. For example, the z-scored SOAM value for a tumor was given by:
A further advantage of this approach is that, since we employ averages of averages, the normality assumption of the measurements is plausible by the central limit theorem.
Using these z-score values, three methods including linear discriminant analysis, quadratic discriminant analysis, and nonparametric classification trees were employed to analyze the data to select the classification rule most effective in separating benign from malignant tumors. All three methods identified SOAM and ICM as the only important factors and resulted in similar classification error rates. Therefore, only the results of the linear discrimant analysis, the simplest classification rule, are described in this paper.
More specifically, two equations were derived from the zscored SOAM and ICM values by linear discriminant analysis. The first equation below represented the summarized mean measure for the malignant group. The second equation represented the summarized mean measure for the benign group.
The probability of malignancy was then
This equation provided a continuous measure with values between 0 and 1, and for which values less than 0.5 indicated that a tumor was likely benign and values greater than 0.5 suggested that a tumor was malignant. Multiplying by 100 provided an estimate of malignancy as a percentage.
RESULTS
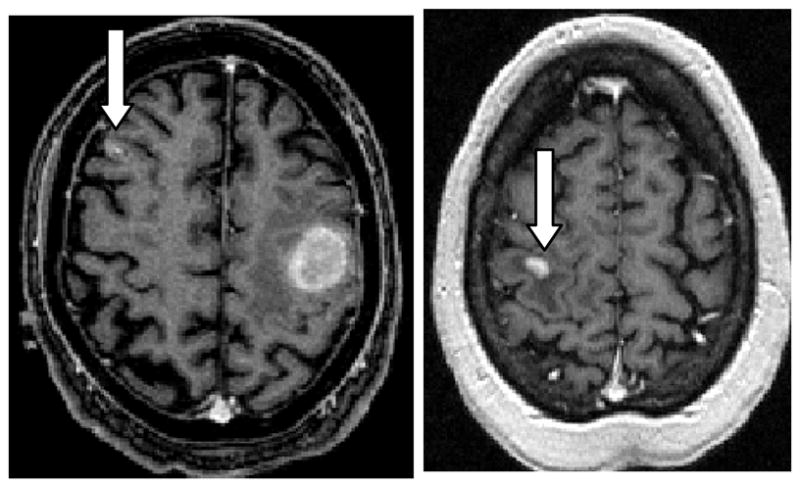
Table 1 provides a summary of results. The first column associates an ID number with each tumor. Of the thirty tumors, twenty-two were malignant and eight were benign. Case 7(23) (Figure 2) provides an example of a diagnostic dilemma. This patient had previously undergone resection of a melanoma followed by whole brain irradiation. He presented years later with a pair of hemorrhagic lesions. It was unclear whether one or both represented recurrent tumor or radiation necrosis. Positron emission tomography, MR-perfusion, and MR-spectroscopic imaging were inconclusive. As a result, both lesions were resected, with histological findings of recurrent tumor in one lesion and no evident tumor in the second. Figure 2 illustrates the vessels segmented from each lesion. The lesion depicted at left in Figure 2 is associated with the “wiggly” vessels characteristic of malignancy whereas the second lesion, shown at right, is not. These results were confirmed by histology following total gross resection of each tumor.
Table 1.
Vessel analysis. ID = tumor number. If two tumors were present the second ID is given in parentheses. VC = z-score vessel count. AVRAD = z-score average radius. SOAM = z-score SOAM. ICM = z-score ICM. MP = malignancy probability %. A value > 50 suggests malignancy. RT = Previous whole head irradiation yes or no. DX = Final pathological diagnosis. GBM = Glioblastoma, Rad Nec = radiation necrosis.
| ID | VC | AVRAD | SOAM | ICM | MP | RT | DX | Malignant |
|---|---|---|---|---|---|---|---|---|
| 1 | 2.1 | 5.4 | 2.3 | 0.9 | 95 | N | GBM | Y |
| 2 | 5.0 | 1.9 | 4.7 | 0.7 | 100 | N | GBM | Y |
| 3 | 9.1 | −1.1 | 2.8 | 0.4 | 96 | N | GBM | Y |
| 4 | −0.2 | −1.6 | 2.7 | 0.9 | 97 | N | GBM | Y |
| 5 | 3.4 | 4.5 | 7.6 | −0.2 | 100 | N | GBM | Y |
| 6 | −0.6 | 6.3 | 1.8 | 2.4 | 95 | N | GliomaIII | Y |
| 7(23) | 6.2 | 5.4 | 6.2 | 0.4 | 100 | Y | Melanoma | Y |
| 8 | 4.0 | 10.9 | 2.3 | 0.4 | 90 | N | Glioma III | Y |
| 9 | 5.5 | 2.6 | 3.2 | −0.5 | 96 | N | GBM | Y |
| 10 | 0.8 | −1.8 | 3.5 | −0.2 | 98 | N | Pinealoblastoma | Y |
| 11 | 3.1 | 2.8 | 4.1 | 0.5 | 100 | N | GBM | Y |
| 12 | 0.4 | 4.3 | 3.1 | 0.2 | 98 | N | GBM | Y |
| 13(14) | 1.8 | 12.2 | 1.9 | 0.8 | 88 | N | Melanoma | Y |
| 14(13) | 3.7 | 0.7 | 2.7 | −0.2 | 93 | N | Melanoma | Y |
| 15 | −0.5 | −1.1 | 4.7 | 0.6 | 100 | Y | RadNec/GBM | Y |
| 16 | 4.0 | −0.6 | 2.6 | 4.9 | 97 | Y | Lymphoma | Y |
| 17 | 2.8 | 0.1 | 3.9 | 2.6 | 99 | N | Breast | Y |
| 18 | 0.2 | −1.8 | 2.6 | −2.0 | 60 | Y | RadNec/GBM | Y |
| 19 | 2.7 | −0.4 | 4.5 | 2.5 | 100 | N | Lung | Y |
| 20 | 5.2 | 0.7 | 0.3 | −0.1 | 11 | N | Renal | Y |
| 21 | 3.3 | 3.4 | 1.9 | −0.2 | 69 | N | Lung | Y |
| 22 | 2.9 | −0.8 | 2.0 | −0.3 | 73 | N | Lung | Y |
| 23(7) | −1.9 | 2.9 | 0.6 | −1.7 | 0 | Y | Rad Nec | N |
| 24 | 1.2 | 5.5 | −0.4 | −1.5 | 0 | N | Pituitary | N |
| 25 | −2.7 | 4.6 | −0.5 | −0.6 | 1 | Y | Rad Nec | N |
| 26 | −0.5 | 1.2 | −0.8 | −1.4 | 0 | Y | Rad Nec | N |
| 27(28) | −0.1 | 1.0 | 0 | 0.1 | 7 | N | Infection | N |
| 28(27) | 1.5 | −0.5 | 1.4 | −0.4 | 40 | N | Infection | N |
| 29 | 1.7 | 0.9 | −1.4 | 1.6 | 0 | N | Myelinolysis | N |
| 30 | 14.5 | 0 | −0.3 | 1.2 | 13 | N | Hemangioblastoma | N |
Figure 2.

Malignant tumor and associated vessels (left) and benign tumor with associated vessels (right) in the same patient. Note that the vessels associated with the malignant tumor have high-frequency wiggles, but that the vessels associated with the benign tumor are smooth.
Assessing the malignancy of tiny tumors is often difficult. This series contained two “pinpoint” tumors with volumes of approximately 0.3 cm3 (Cases 14 and 19; Figure 3). Both tumors were correctly judged malignant on the basis of vessel shape.
Figure 3.
Tiny malignant melanoma (left) and metastatic lung carcinoma (right). Arrows point to the relevant tumors. Vessel shape abnormalities extend well outside of the tumor surface, enabling the diagnosis of malignancy even if the lesion is too small to contain vessels delineated by MRA.
The second column of Table 1 provides a z-scored vessel count for each tumor. Within the limits of MRA resolution, the VC provides an estimate of vessel density. By this measure, some of the malignant tumors were hypervascular and some hypovascular, as was also true for the benign tumors. The tumor exhibiting the largest increase in vessel count was a hemangioblastoma (Case 30), correctly classified as benign by tortuosity measures. Figure 4 provides a 3D rendering of the vessels segmented from this hemangioblastoma. Note that, although the tumor is heavily angiogenic, the shapes of the vessels in this benign lesion are quite different from those of the “wiggly” malignant tumor vessels shown in Figures 1 and 2.
Figure 4.
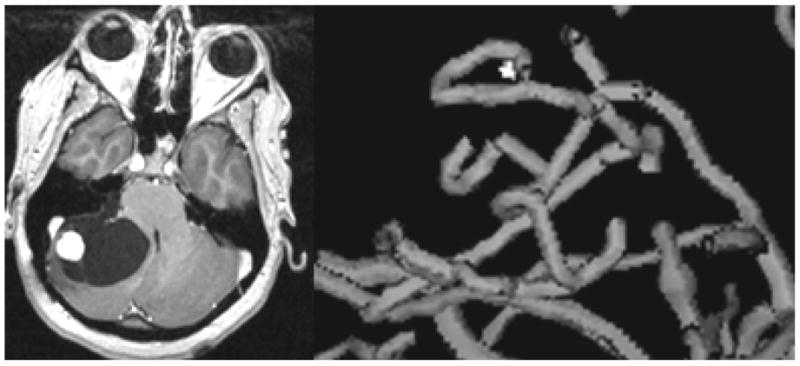
The shapes of vessels associated with a hypervascular benign tumor (hemangioblastoma). A T1 gadolinium-enhanced slice is shown at left, and a 3D rendering of the tumor-associated vessels at right. Note the relatively smooth shapes of the vessels as compared to those associated with malignancy and shown in Figures 1 and 2.
The third column of Table 1 provides a z-scored average radius for vessels within each region of interest. No clear pattern is apparent, with some tumors exhibiting an increase in AVRAD and others a decrease. The most likely explanation is that neoangiogenesis is likely to induce growth of vessels of a variety of sizes.
Columns four through six in Table 1 provide, for each tumor, z-scored tortuosity measurements and a malignancy probability calculated from these tortuosity measurements. Several patients in both the benign and the malignant tumor groups had previously undergone whole-head radiation. All tumors were correctly classified with the exception of one false negative (Case 20), a patient with metastatic renal cell carcinoma. This patient’s tumor was located peripherally in the occipital cortex, a region in which vessels are normally small and faint on MRA. Indeed, only a third of the healthy subjects had vessels within the demarcated region, and these subjects generally possessed only a single vessel segment, often comprised of only a few points. There was therefore exceptionally large variability in the healthy SOAM values, precluding the correct assessment of malignancy.
DISCUSSION
The use of vessel shape measures to estimate malignancy is theoretically appealing for several reasons. First, like many other imaging procedures, the method is noninvasive. Second, the fact that tortuosity abnormalities occur even in incipient malignancies, spread beyond the confines of a cancer’s margins, and affect vessels much larger than those of the capillary bed10,18 implies that tortuosity assessment has the potential of recognizing even tiny tumors as malignant. Finally, the development of vessel tortuosity abnormalities does not appear to be directly related to blood flow20. Vessel tortuosity analysis thus appears to offer information complementary to that provided by perfusion imaging, and may be additionally helpful in discriminating between hypervascular benign and hypervascular malignant tumors.
The current study employs two tortuosity metrics, one of which (SOAM) captures high-frequency “wiggles”, and the second of which (ICM) captures curves with larger excursions4. Since cancer induces vessels with “many smaller bends upon each larger bend”2, one would expect that both tortuosity measures should increase with malignancy, as is often the case. However, as shown by Table 1, some malignant tumors contain vessel clusters with ICM values lower than the mean of the healthy population. There are two reasons for this finding. First, as mathematically implemented, the two tortuosity metrics oppose each other. If one increases the amplitude of a sine wave of a given frequency, for example, the ICM value for that curve will increase while the SOAM value will decrease4. Second, if a tumor induces growth of multiple short vessels, these short sprouts may not be long enough to produce a high ICM value. As indicated by the equation produced by the discriminant analysis, both the SOAM and ICM values are of importance in the detection of cancer vessel tortuosity abnormalities, but the SOAM is of higher significance. A very high SOAM value is likely to indicate malignancy when this parameter is taken in isolation. When the SOAM value is only moderately elevated, however, the additional input from the ICM is likely to be helpful. Indeed, a previous blinded study based on this nonparametric approach was successful in discriminating benign from malignant tumors in all cases5.
The two tortuosity metrics we employ can be viewed as describing tortuosity at two different scales. These scales are not simply a reflection of vessel radius, however, since vessels of small or medium radius may exhibit abnormal, high-frequency “wiggles” detectable by SOAM, abnormally elongated curves detectable by ICM, or both types of tortuosity abnormality simultaneously. It might be desirable to formulate a single tortuosity metric capable of detecting both large and small scale tortuosity abnormalities at the same time, but we have not yet been able to do so. Fourier analysis might provide a solution, but it is difficult to perceive how to combine results over populations of disconnected vessels of varying lengths and shapes. Measurement of fractal dimension is another approach2, but we have found the method to be ineffective in voxelized images. With voxelized data, the two shortest meaningful “rulers” are one and two voxels long. Many vessels in the vicinity of a tumor may be quite short, however, measuring only five voxels in length. When the length of the path to be measured is a low multiple of the length of each “ruler”, the finding of a high average fractal dimension often simply reflects the presence of short vessels.
Case 30 (the hemangioblastoma shown in Figure 4) is of particular interest. The vessels associated with this hypervascular, benign tumor do NOT display the high-frequency “wiggles” associated with cancer, although the vessels do exhibit a mild increase in the larger-scale tortuosity abnormalities measurable by ICM. In a study of both familial and sporadic hemangioblastoma, Miyagami et. al. noted overexpression of VEGF protein in all of the thirteen cases analyzed19. We unfortunately do not know the VEGF protein levels in the hemangioblastoma described in the current report. The association between levels of various growth factors and the development (or resolution) of different types of vessel tortuosity abnormalities could be a highly fruitful area of research.
Given a mathematical description of segmented vessels, a wide variety of vessel attributes can be assessed. The current report evaluates only vessel count, average radius, and tortuosity. Additional parameters such as change in radius, branching frequency, branching angle, and a variety of other vessel attributes might be useful in analyzing other disease processes or in following an individual over time. An advantage of the proposed approach is that it is immediately extensible to an arbitrary number of parameters and to an arbitrary number of disease processes. Of additional interest, Jain has noted that, by histological section, malignancy-associated vessel tortuosity abnormalities reverse rapidly with successful tumor treatment14. The malignancy probability equation described in the current report provides a continuous measure that might be used to follow individual subjects over time so as to evaluate tumor response during treatment6.
A limitation of the technique is that it requires delineation of the paths of individual vessels. It is therefore impossible to incorporate information about vessels whose diameters are smaller than those of the voxels employed during image acquisition. This study employed MRA images. Computed tomographic angiography (CTA) can visualize smaller vessels. We did not employ CTA, however, because our approach is based upon a statistical comparison of vessel numbers and shapes across subjects, and the difference in circulation times between individuals makes CTA injection timing difficult. For our purposes, if the injection were timed too late it might miss the small vessels critical to our approach, and if timed too early it would be likely to “white out” the tumor, making it impossible to discriminate individual vessels within tumor boundaries. Moreover, MR is more sensitive to tumor delineation than is CT. MR/MRA therefore seemed a better choice for the current study.
A related limitation is that, since the approach is statistically based, it requires analysis of a reasonable number of vessels of reasonable lengths to produce a meaningful result. The one failure in the current series was a false negative represented by a peripherally situated cancer in a region in which only a few healthy subjects possessed only a few short vessels. When the tumor margins were taken as the region of interest, the paucity of healthy vessels produced a reasonable average SOAM value, but an extraordinarily large healthy SOAM standard deviation (2.7; the usual healthy SOAM standard deviation is approximately 0.8) so that the tumor could not be declared malignant. When the region of interest was dilated to include a larger number of longer healthy vessels to reduce the healthy SOAM standard deviation to about 1.0, so much dilation was required that the mean tumor SOAM value then approached the healthy range. This case is the only such example to date, but the same problem may recur in the future with other peripherally situated lesions. This problem fortunately can be automatically flagged as an indeterminate situation by the excessively high healthy standard deviation.
It should be noted that, given the wide range of human brain tumors, the series presented here is small and contains relatively few benign lesions. The equation derived from the current study requires evaluation against a much larger series of patients, with possible modification of the equation as further experience is gained with a greater range of tumor types. Nevertheless, the preliminary results presented in this report are highly promising. We believe that a statistical analysis of vessel morphology can offer a new and exciting means of diagnosing and monitoring cancer. The approach should be extensible to a variety of other diseases as well.
Acknowledgments
Supported by R01 EB000219 NIH NIBIB.
We are grateful to Daniel Rueckert for donating his registration software.
Grant Support: R01 EB000219 NIH-NIBIB
LITERATURE CITED
- 1.Aylward S, Bullitt E. Initialization, noise, singularities and scale in height ridge traversal for tubular object centerline extraction. IEEE TMI. 2002;21:61–75. doi: 10.1109/42.993126. [DOI] [PubMed] [Google Scholar]
- 2.Baish JS, Jain RK. Fractals and cancer. Cancer Research 2000. 2000;60:3683–3688. [PubMed] [Google Scholar]
- 3.Benard F, Romsa J, Hustinx R. Imaging gliomas with positron emission tomography and single-photon emission computed tomography. Seminars Nuc Med. 2003;23:148–162. doi: 10.1053/snuc.2003.127304. [DOI] [PubMed] [Google Scholar]
- 4.Bullitt E, Gerig G, Pizer S, Aylward SR. Measuring tortuosity of the intracerebral vasculature from MRA images. IEEE-TMI. 2003;22:1163–1171. doi: 10.1109/TMI.2003.816964. [DOI] [PMC free article] [PubMed] [Google Scholar]
- 5.Bullitt E, Jung I, Muller K, Gerig G, Aylward S, Joshi S, Smith K, Lin W, Ewend M. Determining malignancy of brain tumors by analysis of vessel shape. MICCAI 2004 Lecture Notes in Computer Science. 2004;3217:645–653. [Google Scholar]
- 6.Bullitt E, Ewend M, Aylward S, Lin W, Gerig G, Joshi S, Jung I, Muller K, Smith K. Abnormal vessel tortuosity as a marker of treatment response of malignant gliomas: Preliminary report. Technology in Cancer Research and Treatment. 2004;3:577–584. doi: 10.1177/153303460400300607. [DOI] [PMC free article] [PubMed] [Google Scholar]
- 7.Bullitt E, Muller K, Jung I, Lin W, Aylward SR. Analyzing attributes of vessel populations. MedIA. 2005;9:39–49. doi: 10.1016/j.media.2004.06.024. [DOI] [PMC free article] [PubMed] [Google Scholar]
- 8.Burger PC, Scheithauer BW, Vogel FS. Surgical Pathology of the Nervous System and its Coverings. 3. Churchill Livingstone; New York: 1991. [Google Scholar]
- 9.Burtscher LM, Holtas S. Proton magnetic resonance spectroscopy in brain tumors: clinical applications. Neuroradiology. 2001;43:345–352. doi: 10.1007/s002340000427. [DOI] [PubMed] [Google Scholar]
- 10.Folkman J. Incipient Angiogenesis. Journal of the National Cancer Institute. 2000;92:94–95. doi: 10.1093/jnci/92.2.94. [DOI] [PubMed] [Google Scholar]
- 11.Frenet MF. Sur les courbes a double courbure. Journal des Mathematiques Pures et Appliquees. 1852;17(Sér I):437–447. [Google Scholar]
- 12.Helmlinger G, Sckell A, Dellian M, Forbes NS, Jain RK. Acid production in glycolysis-impaired tumors provides new insights into tumor metabolism. Clinical Cancer Research. 2002;8:1284–1291. [PubMed] [Google Scholar]
- 13.ICBM Atlas. McConnell Brain Imaging Centre, Montréal Neurological Institute, McGill University; Montréal, Canada: [Google Scholar]
- 14.Jain RK. Normalizing tumor vasculature with anti-angiogenic therapy: a new paradigm for combination therapy. Nature Medicine. 2001;7:987–998. doi: 10.1038/nm0901-987. [DOI] [PubMed] [Google Scholar]
- 15.Koenderink JJ. Solid Shape. Cambridge Mass: MIT Press; 1993. pp. 167–194. [Google Scholar]
- 16.Lau DH, Xue L, Young LJ, Burke PA, Cheung AT. Paclitaxel (Taxol): an inhibitor of angiogenesis in a highly vascularized transgenic breast cancer. Cancer Biother Radiopharm. 1999;14:31–6. doi: 10.1089/cbr.1999.14.31. [DOI] [PubMed] [Google Scholar]
- 17.Law M, Yang S, Wang H, Babb JS, Johnson G, Cha S, Knopp EA, Zagzag D. Glioma Grading:Sensitivity, specificity, and predictive values of perfusion MR imaging and proton MR spectroscopic imaging compared with conventional MR imaging. AJNR. 2003;24:1989–1998. [PMC free article] [PubMed] [Google Scholar]
- 18.Li CH, Shan S, Huang Q, Braun R, Lanzen J, Hu K, Lin P, Dewhirst M. Initial stages of tumor cell-induced angiogenesis: evaluation via skin window chambers in rodent models. J Natl Cancer Inst. 2000;92:143–147. doi: 10.1093/jnci/92.2.143. [DOI] [PubMed] [Google Scholar]
- 19.Miyagami M, Katayama Y, Nakamura S. Clinicopathological study of vascular endothelial growth factor (VEGF), p53, and proliferative potential in familial von Hippel-Lindau disease and sporadic hemangioblastomas. Brain Tumor Pathol. 2000;17(3):111–20. doi: 10.1007/BF02484282. [DOI] [PubMed] [Google Scholar]
- 20.Parikh A, Smith K, Ewend M, Bullitt E. Correlation of MR perfusion imaging and vessel tortuosity parameters in assessment of intracranial neoplasms. Technology in Cancer Research and Treatment. 2004;3:585–590. doi: 10.1177/153303460400300608. [DOI] [PMC free article] [PubMed] [Google Scholar]
- 21.Prastawa M, Bullitt E, Moon N, Van Leemput K, Gerig G. Automatic brain tumor segmentation by subject specific modification of atlas priors Academic. Radiology. 2003;10:1341–1348. doi: 10.1016/s1076-6332(03)00506-3. [DOI] [PMC free article] [PubMed] [Google Scholar]
- 22.Rueckert D. Rview. Available: www.doc.ic.ac.uk/~dr/software.
- 23.Scatliff JH, Radcliffe WB, Pittman HH, Park CH. Vascular structure of glioblastomas. Am J Roent Rad Ther Nuc Med. 1969;105:795–804. doi: 10.2214/ajr.105.4.795. [DOI] [PubMed] [Google Scholar]
- 24.Schnabel JA, Rueckert D, Quist M, Blackall JM, Castellano Smith AD, Hartkens T, Penney GP, Hall WA, Liu H, Truwit CL, Gerritsen FA, Hill DLG, Hawkes JD. A generic framework for non-rigid registration based on non-uniform multi-level free-form deformations. Lecture Notes in Computer Science. 2001;2208:573–581. [Google Scholar]
- 25.Siemann D. Vascular Targeting Agents. Horizons in Cancer Therapeutics. 2002;3:4–15. [Google Scholar]
- 26.Tosi MR, Fini G, Tinti A, Reggiani A, Tugnoli V. Molecular characterization of human healthy and neoplastic cerebral and renal tissues by in vitro1H NMR spectroscopy (Review) International Journal of Molecular Medicine. 2002;9:299–310. [PubMed] [Google Scholar]
- 27.Willett CG, et al. Direct evidence that the VEGF-specific antibody bevacizumab has antivascular effects in human rectal cancer. Nature Medicine. 2004;10:145–147. doi: 10.1038/nm988. [DOI] [PMC free article] [PubMed] [Google Scholar]