

Abstract
Atherogenesis is a chronic inflammatory process in which intercellular adhesion molecule 1 (ICAM-1) plays a critical role. Circulating soluble ICAM-1 (sICAM-1) is thought to be the result of cleavage of membrane-bound ICAM-1 and its concentration in serum/plasma has been shown to be heritable. Genome-wide linkage scans were conducted for quantitative trait loci influencing sICAM-1. Phenotype and genetic marker data were available for 2,617 white and 531 black individuals in the NHLBI Family Heart Study follow-up examination. Heritability for sICAM-1 was 0.39 in whites and 0.59 in blacks. Significant linkage was observed on chromosome 19 (LOD = 4.0 at 14 cM) in whites near the ICAM gene cluster that includes the structural gene for ICAM-1. The T-allele of ICAM-1 SNP rs5491 has been strongly associated with the specific sICAM-1 assay we used in our study. Through additional genotyping we were able to rule out rs5491 as the cause of the linkage finding. This study provides preliminary evidence linking genetic variation in the ICAM-1 structural gene to circulating sICAM-1 levels.
Keywords: Intercellular adhesion molecule-1, Linkage (Genetics), ICAM gene cluster, inflammation, atherosclerosis
Introduction
Atherogenesis is a chronic inflammatory process in which the arterial intima undergoes significant changes including the deposition of lipids, recruitment of leukocytes and smooth muscle cells, and accumulation of extracellular matrix. Leukocyte infiltration into the extravascular space is mediated in part by binding of complementary adhesion molecules. Intercellular adhesion molecule 1 (ICAM-1) plays a critical role in firm adhesion of all leukocytes to the endothelium. Circulating soluble ICAM-1 (sICAM-1) is thought to originate from proteolytic cleavage of cell-bound ICAM-1 and has been shown to retain most of the structure and function of the membrane bound form1.
Several human studies have found an association between high levels of sICAM-1 and cardiovascular disease. The ARIC study reported the odds ratios of coronary heart disease and carotid artery atherosclerosis were 5.5 and 2.6, respectively, for those with levels of sICAM-1 in the highest quartile compared with those in the lowest quartile2. Using a nested case-control design in the Physicians Health Study, Ridker and colleagues found a significant association between increasing sICAM-1 levels and future risk of myocardial infarction in men. Furthermore, they report a multivariate adjusted relative risk (RR) = 1.8 for myocardial infarction in participants whose baseline sICAM-1 levels were in the highest quartile compared to the lowest3. Using a similar nested case-control design in the British Regional Heart Study, Malik et al. found a RR = 1.68 for CHD comparing participants in the top and bottom third of baseline sICAM-1 levels, but this decreased to RR = 1.11 after controlling for other CHD risk factors4. In the Women’s Health Study, the highest quartile of sICAM-1 level was associated with increased risk of cardiovascular events (RR = 2.6) compared to the lowest quartile3.
In normal vasculature, ICAM-1 is expressed at low levels but can be upregulated by endothelial dysfunction. High levels indicate on-going inflammatory activity. An apo E knockout mouse model with ICAM-1 deficiency (ICAM-1−/−) showed a 30% reduction in intimal lesions and a lack of advanced calcified lesions compared to ICAM-1 wild type mice5. Nakashima et al. observed that ICAM-1 expression was independent of plasma cholesterol and appeared to be upregulated by biomechanical forces6. The stress-response element identified in the promoter of the ICAM-1 gene supports this observation7. Genetic factors may partly account for interindividual variation in sICAM-1. Heritabilities of sICAM-1 levels ranging from 0.34–0.50 have been reported8,9. Genome-wide linkage scans for sICAM-1 were conducted in 1,269 Hispanics in the San Antonio Family Heart Study and 1,054 whites in the Framingham Heart Study. In Hispanics, a significant linkage was observed on Chromosome 19 over the region containing the structural gene for ICAM19 However, no significant linkage signals were observed for this trait in the Framingham Heart Study.
To identify genes contributing to variation in sICAM-1 and to decipher the inconsistent results of the previous two genome scans, we conducted a genome-wide scan for quantitative trait locus (QTL) influencing sICAM-1 levels in a large family study. The identification of genes contributing to variation in circulating levels may point to etiological pathways that further clarify the role of inflammation in atherogenesis.
Subjects and Methods
Subjects
In its follow-up examination, the NHLBI FHS enrolled previously examined and genotyped participants from the original NHLBI FHS and Hypertension Epidemiology Network (HyperGEN). The NHLBI FHS originally recruited three-generation pedigrees from three population-based studies with approximately half the pedigrees randomly selected and the other half selected on the basis of having higher than expected rates of CHD. HyperGEN recruited hypertensive siblings and a random sample of the population. In addition, relatives of participants in FHS and HyperGEN were enrolled. This follow-up examination included 3,359 participants, including 622 African Americans.
Measurements
Participants were asked to change into a scrub suit or examination gown and were given the opportunity to empty their bladder prior to anthropometric measurements. Hip and waist circumferences were measured at the maximal protrusion of the hips and at the level of the umbilicus, respectively, with the participant standing erect. Height was measured while participants were standing without shoes, heels together against a vertical mounted ruler. A Detecto Platform Balance was used to measure weight. BMI was calculated as weight (kg)/height2 (m2). Medical and personal histories were ascertained via interview and participants self reported diabetes, hypertension, and hypercholesterolemia. Smoking exposure was assessed by current smoking status and lifetime exposure (pack years). Participants were asked to bring all prescription medications taken in the previous four weeks and an interviewer transcribed this information. sICAM-1 was measured in EDTA plasma by an ELISA method (Parameter Human sICAM-1 Immunoassay; R&D Systems, Minneapolis, MN). With this method, the sICAM-1 is sandwiched between an immobilized monoclonal antibody and the enzyme-linked monoclonal antibody. The samples were run in duplicate the order they were received by the laboratory. The amount of sICAM-1 present was determined by a colorimetric reaction. The CV for the assay is 5.0%, with a healthy reference mean of 326 ± 89 ng/mL. The minimum detectable level is < 0.35 ng/mL.
Genotyping
Genotypes for microsatellite markers throughout the genome were provided by the NHLBI Mammalian Genotyping Service (MGS) and the University of Texas Health Science Center at Houston. The markers were from CHLC screening set 10 (408 markers) spaced at approximately 10 cM intervals. Primers tagged by fluorescent dyes were used to amplify microsatellite markers for electrophoresis to distinguish alleles that differ by numbers of short repeats. Quality control measures included checking genotypes for consistency with pedigree relationships, as well as inclusion of samples with known genotypes (CEPH) to ensure accurate and consistent allele designations. Genotyping for rs5491 was performed at the University of Minnesota Medical Center, Fairview. Genomic DNA was amplified using the following primers: forward-GCCTCTTCCCTCGTTTCTTC, reverse-CTCCGGGCTCAGTTACTCAC which produced a 306 bp product. The amplification program was an initial cycle at 95.0°C for 15 minutes, followed by 38 cycles of 95.0ºC for 30 seconds, 58.1ºC for 30 seconds, and 72.0 ºC for 40 seconds, and a final cycle of 72.0 ºC for 5 minutes. When the amplified product was digested with NlaIII restriction enzyme, the A allele produced two fragments of 211 bp and 95 bp, while the T allele produced three fragments of 186, 95, and 25 bp which were detected by gel electrophoresis.
Statistical Methods
Heritability and covariate effects were estimated and genome scans were performed using the variance components approach as implemented in SOLAR10. This method is an implementation of the Amos method that uses extended pedigree data rather than restricting the linkage analysis to sibships11. Variance component methods model phenotypic covariances between relatives as a function of the identity-by-descent (IBD) relationships of alleles a given locus and other factors12. Two alleles are said to show IBD when they are both copies of the same ancestral allele. IBD relations are estimated using genetic marker data. The variance component model tests the null hypothesis that there is no linkage (i.e. the additive genetic variance due to the QTL is zero) by comparing the likelihood of the restricted (null) model to a model in which the variance of the QTL is estimated13
The IBD probabilities for the small families were computed by MERLIN. MERLIN uses the Lander-Green algorithm to estimate the probability that any two individuals actually inherited the same allele from founders in the pedigree14. For the seven largest families, Loki was used to compute IBD probabilities. Loki uses Markov chain Monte Carlo techniques to estimate the IBD relationship matrices for large and complex pedigrees while avoiding the computational issues that prevent the use of the precise Lander-Green algorithm15,16. The MERLIN and Loki IBD files were converted into SOLAR format using the program MER2SOL for use in linkage analysis17. The SOLAR lodadj procedure was used to simulate the expected distribution of LOD scores for a given phenotype under the null model. This procedure has been described in detail elsewhere13,18. Briefly, this procedure simulates a fully-informative marker completely unlinked to the trait and tests the trait linkage at that marker to determine the LOD score distribution under the null model. Empirical p-values were estimated as (r + 1)/(n + 1), where n is the number of replicate samples simulated and r is the number of those replicates with LOD exceeding or equaling the observed LOD19.
SICAM-1 levels were logarithmically transformed to normalize the distribution. The distribution was truncated to reduce kurtosis by excluding participants with log transformed levels ± 4 standard deviations from the mean (n = 6). The resulting kurtosis was 0.6. In SOLAR, sICAM-1 was adjusted for the effects of sex, age, smoking status, lifetime smoking exposure (pack-years), and field center.
Results
Phenotype and genetic marker data were available on 2,617 white subjects in 482 pedigrees and 531 black subjects in 160 pedigrees. Pedigree characteristics are shown in Table 1. In whites, significant associations between sICAM-1 levels and age, sex, BMI, waist circumference, smoking status, lifetime smoking exposure, diabetes status, and field center were observed using mixed effect models as implemented in SOLAR to account for the lack of independence due to familial aggregation. In blacks, only smoking and diabetes status were significantly associated with sICAM-1. Baseline characteristics of the study population and a race-specific comparison of mean levels by several characteristics are shown in Table 2. Subjects ranged in age from 32–93 years, with a mean age of 57 in whites and 53 in blacks, and over half were women. In whites, higher mean sICAM-1 levels were observed with increasing age, BMI, and waist circumference. Smokers had higher sICAM-1 levels in both races, and in whites only there was evidence of a dose-response relationship, with higher levels observed across the quintiles of smoking exposure. Diabetics had higher sICAM-1 levels than non-diabetics in both blacks and whites.
Table 1.
Characteristics of the NHLBI FHS follow-up examination pedigrees included in the linkage analysis
| ICAM-1 | ||
|---|---|---|
| Race | White | Black |
| Pedigrees | 482 | 160 |
| Mean pedigree size (range) | 5.4 (2–17) | 3.3 (2–17) |
| Individuals | 2617 | 531 |
| Relative Pairs | ||
| Parent-offspring | 1447 | 128 |
| Siblings | 2885 | 394 |
| Grandparent-grandchild | 35 | 1 |
| Avuncular | 1627 | 159 |
| Half siblings | 74 | 84 |
| Half avuncular | 44 | 13 |
| 1st cousins | 92 | 13 |
| Other | 3 | 2 |
Table 2.
Baseline Characteristics of NHLBI FHS follow-up exam participants included in the linkage analysis (mean ± standard deviation or percentage)
| Variable | ICAM-1 | |
|---|---|---|
| Race | Whites | Blacks |
| N | 2617 | 531 |
| Age, years | 57 ± 13 | 53 ± 11 |
| % male | 45 | 34 |
| BMI, kg/m2 | 29 ± 5.7 | 33 ± 7.4 |
| Smoking Status, % yes | 10 | 22 |
| Diabetes, % yes | 11 | 25 |
| Hypertension, % yes | 39 | 75 |
| Hypercholesterolemia, % yes | 42 | 36 |
| Means and standard deviations of ICAM-1 (ng/mL) by various characteristics | ||
| Sex | ||
| Male | 242 ± 74 | 217 ± 100 |
| Female | 249 ± 76 | 221 ± 99 |
| Age (years) | ||
| 30–35 | 234 ± 67 | 197 ± 80 |
| 36–45 | 237 ± 77 | 210 ± 93 |
| 46–55 | 242 ± 72 | 234 ± 105 |
| 56–65 | 249 ± 72 | 231 ± 110 |
| 66–75 | 255 ± 77 | 215 ± 68 |
| 76+ | 254 ± 79 | 207 ± 95 |
| Current Smoking Status | ||
| No | 242 ± 72 | 208 ± 97 |
| Yes | 287 ± 91 | 259 ± 98 |
| Pack-years of smoking | ||
| Quintile 1 (0.10–6.0) | 236 ± 61 | 208 ± 91 |
| Quintile 2 (6.15–14.85) | 245 ± 59 | 222 ± 89 |
| Quintile 3 (15–25) | 259 ± 83 | 248 ± 97 |
| Quintile 4 (25.5–42) | 268 ± 94 | 262 ± 137 |
| Quintile 5 (43–160) | 273 ± 91 | 226 ± 100 |
| BMI | ||
| Normal (< 25) | 242 ± 77 | 236 ± 120 |
| Overweight (25–29) | 244 ± 71 | 224 ± 97 |
| Obese (≥ 30) | 250 ± 79 | 213 ± 99 |
| Morbidly Obese (40+) | 261 ± 64 | 219 ± 85 |
| Waist circumference (cm) | ||
| Quintile 1 (58–86) | 241 ± 77 | 224 ± 121 |
| Quintile 2 (87–95) | 243 ± 74 | 244 ± 118 |
| Quintile 3 (96–103) | 247 ± 71 | 210 ± 75 |
| Quintile 4 (104–112) | 249 ± 72 | 202 ± 87 |
| Quintile 5 (113–187) | 254 ± 80 | 226 ± 104 |
| Current Diabetes or High Blood Sugar Status | ||
| No | 244 ± 74 | 210 ± 93 |
| Yes | 265 ± 80 | 248 ± 113 |
Heritability was 0.39 and 0.59 for whites and blacks, respectively (Table 3) after adjusting for sex, age, smoking status, pack-years, and field center. Heritability estimates were similar with or without adjustment for addition covariates including measures of adiposity (i.e. BMI, waist, waist to hip ratio) therefore only those listed above were included in the final model. Under the null model, 10,000 LOD scores were simulated and ranged from 0–3.0. These replicates were used to estimate empirical p-values. Race-specific multipoint LOD scores are plotted by map position for each chromosome in Figure 1. A significant LOD score was observed in whites on chromosome 19 (LOD = 4.0 at 14cM, p = 0.0001).
Table 3.
Adjusted heritability of ICAM-1
| Phenotype | N | Heritability (h2) ± SE | Proportion of Variance explained by covariates* |
|---|---|---|---|
| Whites | 2617 | 0.39 ± 0.04 | 0.06 |
| Blacks | 531 | 0.59 ± 0.10 | 0.05 |
covariates = sex, age, smoking status, pack years, and field center.
Figure 1.
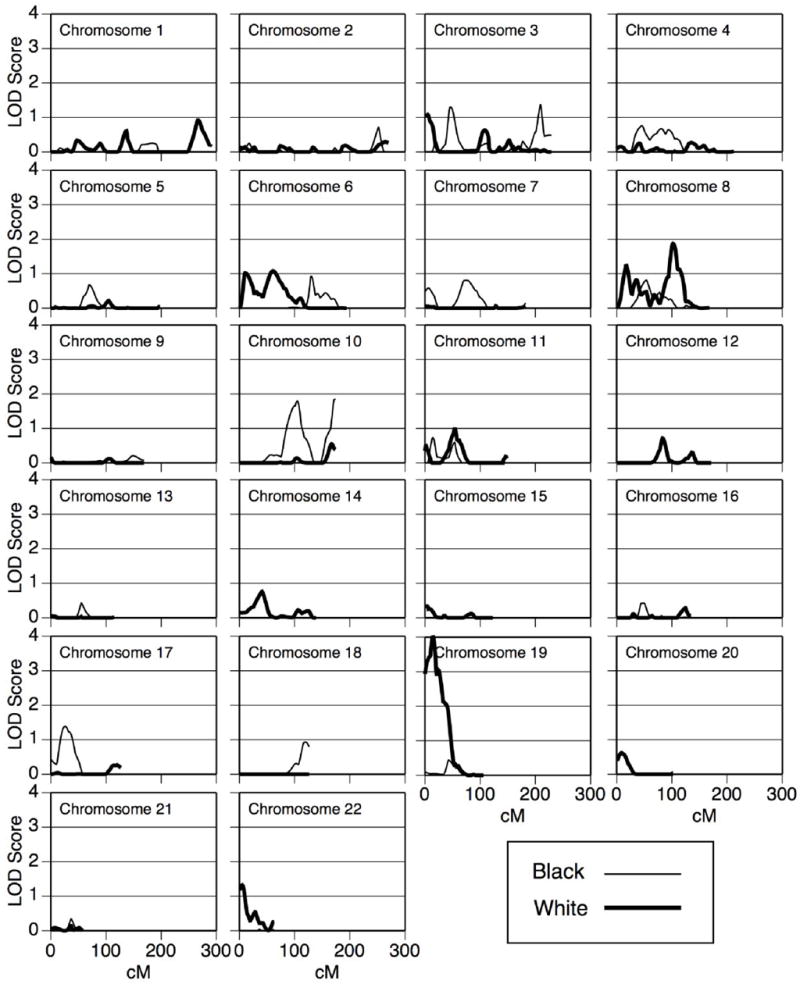
Race-specific multipoint LOD scores by chromosome for sICAM-1
Discussion
We observed heritabilities of 0.39 in whites and 0.59 in blacks suggesting a genetic component influencing sICAM-1 levels. These estimates are consistent with previously published reports in whites in the Framingham Heart Study8 (h2 = 0.34) and Mexican Americans in the San Antonio Family Heart Study (SAFHS, h2 = 0.50)9. Significant linkage was observed near the ICAM gene cluster region on chromosome 19 in whites (LOD = 4.0 at 14cM). There was minimal evidence for linkage in this region in our small black sample with a small peak, LOD = 0.43, shifted closer to the centromere at 43cM. Our results for whites on chromosome 19 replicate a previously published linkage scan for sICAM-1. Kent et al. reported significant linkage in Mexican Americans in the SAFHS (LOD = 4.95 at 33 cM)9. However, Dupuis reported minimal evidence for linkage in this area (LOD ≈ 1) in whites in the Framingham Heart Study8.
The structural gene for ICAM-1 maps to 19p13.3-p13.2 (33 cM) and numerous SNPs have been identified within the seven exons of this gene. Register et al. discovered that the T-allele of rs5491 alters a critical binding site of ICAM-1 interfering with the monoclonal antibody used in the R&D Systems assay to bind to the protein, the same assay that was used to measure sICAM-1 in our study population. These researchers identified the assay problem by genotyping an individual who had no detectable sICAM-1 using the R&D Systems assay and high levels of sICAM-1 using an alternative assay. They determined that the individual was homozygous for the rs5491-T allele20. The T-allele of rs5491 is associated with 50% lower sICAM-1 levels for heterozygotes and undetectable levels in homozygotes using the R&D Systems assay.
NCBI SNP cluster report lists T-allele frequencies of 0–1% for Europeans and 20–25% for African Americans. Therefore it is conceivable that the strong linkage signal over the ICAM gene cluster in whites could be the result of a small number of pedigrees transmitting the T-allele. To test this hypothesis, we genotyped the 10 pedigrees (n = 83) providing the highest pedigree-specific LOD scores (LOD > 0.28). We also genotyped 3 black pedigrees (n = 11) that included at least one member with undetectable sICAM-1 according to the R&D Systems assay. All 83 whites were homozygous for the A-allele indicating that the significant linkage peak on chromosome 19 was not likely due to transmission of the rs5491-T allele. As expected, all blacks with no detectible sICAM-1 levels (n = 6) were homozygous for the T-allele and all blacks with sICAM-1 approximately 50% lower than the population average (200 ng/ml) were heterozygous (n = 5).
Having ruled out rs5491 as responsible for the linkage on chromosome 19 observed in whites, further characterization of ICAM-1 is needed to determine if other variants are responsible for linkage. Two other ICAM-1 SNPs, rs5498 and rs1799969, are non-synonymous and polymorphic in whites, with minor allele frequencies of 44% and 8%, respectively (HapMap). A lysine to glutamic acid substitution, in exon 6 (rs5498) has been correlated with serum sICAM-1 levels in a case control study of childhood asthma21.
There are several other candidate genes under the linkage peak that could be responsible for the linkage peak including the LDL receptor (LDLR), several members of the tumor necrosis factor superfamily, and resistin. LDL receptors are critical in the metabolism of LDL cholesterol and variants affecting the function of LDLR cause familial hypercholesterolemia. Other, less catastrophic variants on LDLR, have been shown to cause increased levels of LDL22. Higher levels of LDL lead to higher levels of oxidized LDL and oxidized LDL has been shown to stimulate the expression of ICAM-123. Tumor necrosis factor molecules are involved with immune regulation and inflammation and therefore, could influence sICAM-1 levels. Resistin is an adipocytokine that is expressed in white adipose tissue, has been found to induce expression of ICAM-1in a dose dependent manner in human aortic endothelial cells24, and SNPs in the resistin gene have been association with serum resistin level25.
We did not observe any significant linkage results for sICAM-1 in our smaller population of blacks. A small peak was observed near the ICAM-1 gene (LOD = 0.43 at 44 cM). Given the frequency of the rs5491-T allele in blacks and the magnitude of effect, we expected to observe strong evidence for linkage in this region. Using the power calculation procedure in SOLAR that assumes fully informative marker genotype data for all subjects, we estimate that we have 93% power to detect, with a LOD of 3, a QTL which accounts for approximately 59% of the trait variance (i.e. heritability = 0.59). However, the failure to detect a linkage signal is this region is likely due to the fact that the information content for chromosome 19 was very poor in blacks (> 0.50 from 0–38 cM). As a result of genotyping difficulty on chromosome 19, there were only 8 markers available for blacks and 11 for whites.
The major weakness of this study is that linkage analysis is an exploratory methodology that is sensitive to complexities in population structure, etiological heterogeneity, and complex gene-gene and gene-environment interactions. It is possible that there is genetic heterogeneity within the cohort that may mask the linkage signals. Additionally, linkage analysis techniques have low power to detect genes of small to moderate effects. This problem is compounded by the small sample size and thus limited power in the black families. The degree to which these factors impact the linkage results is unknown.
Conclusion
This investigation into the genetics of sICAM-1 revealed heritabilities of 0.39 in white and 0.59 in black populations. Significant linkage was observed in whites on chromosome 19 near the ICAM gene cluster that includes the structural gene for ICAM-1. Genotyping of the 10 pedigrees providing the most evidence for linkage excluded rs5491 as the cause of the linkage finding. We observed no regions of significant linkage in blacks. This study provides preliminary evidence linking genetic variation in the ICAM-1 structural gene to circulating sICAM-1 levels.
Acknowledgments
We are grateful for resources from the University of Minnesota Supercomputing Institute, the NIH Training Grant in Cardiovascular Disease Genetic Epidemiology (#5 T32 HL007972). Support was provided by the National Heart, Lung, and Blood Institute cooperative agreement grants U01 HL 67893, U01 HL67894, U01 HL67895, U01 HL67896, U01 HL67897, U01 HL67898, U01 HL67899, U01 HL67900, U01 HL67901, U01 HL67902. Support was also partially provided by the National Heart, Lung, and Blood Institute cooperative agreement grants U01 HL56563, U01 HL56564, U01 HL56565, U01 HL56566, U01 HL56567, U01 HL56568, U01 HL56569. This report is presented on behalf of the investigators of the NHLBI Family Heart Study. The investigators thank the study participants and staff for their valuable contributions.
Footnotes
Publisher's Disclaimer: This is a PDF file of an unedited manuscript that has been accepted for publication. As a service to our customers we are providing this early version of the manuscript. The manuscript will undergo copyediting, typesetting, and review of the resulting proof before it is published in its final citable form. Please note that during the production process errors may be discovered which could affect the content, and all legal disclaimers that apply to the journal pertain.
References
- 1.Rothlein R, Mainolfi EA, Czajkowski M, Marlin SD. A form of circulating ICAM-1 in human serum. J Immunol. 1991;147:3788–3793. [PubMed] [Google Scholar]
- 2.Hwang SJ, Ballantyne CM, Sharrett AR, Smith LC, Davis CE, Gotto AM, Jr, Boerwinkle E. Circulating adhesion molecules VCAM-1, ICAM-1, and E-selectin in carotid atherosclerosis and incident coronary heart disease cases: the Atherosclerosis Risk In Communities (ARIC) study. Circulation. 1997;96:4219–4225. doi: 10.1161/01.cir.96.12.4219. [DOI] [PubMed] [Google Scholar]
- 3.Ridker PM, Hennekens CH, Roitman-Johnson B, Stampfer MJ, Allen J. Plasma concentration of soluble intercellular adhesion molecule 1 and risks of future myocardial infarction in apparently healthy men. Lancet. 1998;351:88–92. doi: 10.1016/S0140-6736(97)09032-6. [DOI] [PubMed] [Google Scholar]
- 4.Malik I, Danesh J, Whincup P, Bhatia V, Papacosta O, Walker M, Lennon L, Thomson A, Haskard D. Soluble adhesion molecules and prediction of coronary heart disease: a prospective study and meta-analysis. Lancet. 2001;358:971–976. doi: 10.1016/S0140-6736(01)06104-9. [DOI] [PubMed] [Google Scholar]
- 5.Collins RG, Velji R, Guevara NV, Hicks MJ, Chan L, Beaudet AL. P-Selectin or intercellular adhesion molecule (ICAM)-1 deficiency substantially protects against atherosclerosis in apolipoprotein E-deficient mice. J Exp Med. 2000;191:189–194. doi: 10.1084/jem.191.1.189. [DOI] [PMC free article] [PubMed] [Google Scholar]
- 6.Nakashima Y, Raines EW, Plump AS, Breslow JL, Ross R. Upregulation of VCAM-1 and ICAM-1 at atherosclerosis-prone sites on the endothelium in the ApoE-deficient mouse. Arterioscler Thromb Vasc Biol. 1998;18:842–851. doi: 10.1161/01.atv.18.5.842. [DOI] [PubMed] [Google Scholar]
- 7.Resnick N, Collins T, Atkinson W, Bonthron DT, Dewey CF, Jr, Gimbrone MA., Jr Platelet-derived growth factor B chain promoter contains a cis-acting fluid shear-stress-responsive element. Proc Natl Acad Sci U S A. 1993;90:4591–4595. doi: 10.1073/pnas.90.10.4591. [DOI] [PMC free article] [PubMed] [Google Scholar]
- 8.Dupuis J, Larson MG, Vasan RS, Massaro JM, Wilson PW, Lipinska I, Corey D, Vita JA, Keaney JF, Jr, Benjamin EJ. Genome scan of systemic biomarkers of vascular inflammation in the Framingham Heart Study: evidence for susceptibility loci on 1q. Atherosclerosis. 2005;182:307–314. doi: 10.1016/j.atherosclerosis.2005.02.015. [DOI] [PubMed] [Google Scholar]
- 9.Kent JW, Jr, Mahaney MC, Comuzzie AG, Goring HH, Almasy L, Dyer TD, Cole SA, Maccluer JW, Blangero J. Quantitative trait locus on Chromosome 19 for circulating levels of intercellular adhesion molecule-1 in Mexican Americans. Atherosclerosis. 2006 doi: 10.1016/j.atherosclerosis.2006.10.005. [DOI] [PMC free article] [PubMed] [Google Scholar]
- 10.Almasy L, Blangero J. Multipoint quantitative-trait linkage analysis in general pedigrees. Am J Hum Genet. 1998;62:1198–1211. doi: 10.1086/301844. [DOI] [PMC free article] [PubMed] [Google Scholar]
- 11.Amos CI. Robust variance-components approach for assessing genetic linkage in pedigrees. Am J Hum Genet. 1994;54:535–543. [PMC free article] [PubMed] [Google Scholar]
- 12.Almasy L, Dyer TD, Blangero J. Bivariate quantitative trait linkage analysis: pleiotropy versus co-incident linkages. Genet Epidemiol. 1997;14:953–958. doi: 10.1002/(SICI)1098-2272(1997)14:6<953::AID-GEPI65>3.0.CO;2-K. [DOI] [PubMed] [Google Scholar]
- 13.Blangero J, Williams JT, Almasy L. Variance component methods for detecting complex trait loci. Adv Genet. 2001;42:151–181. doi: 10.1016/s0065-2660(01)42021-9. [DOI] [PubMed] [Google Scholar]
- 14.Abecasis GR, Cherny SS, Cookson WO, Cardon LR. Merlin--rapid analysis of dense genetic maps using sparse gene flow trees. Nat Genet. 2002;30:97–101. doi: 10.1038/ng786. [DOI] [PubMed] [Google Scholar]
- 15.Heath SC. Markov chain Monte Carlo segregation and linkage analysis for oligogenic models. Am J Hum Genet. 1997;61:748–760. doi: 10.1086/515506. [DOI] [PMC free article] [PubMed] [Google Scholar]
- 16.Heath SC, Snow GL, Thompson EA, Tseng C, Wijsman EM. MCMC segregation and linkage analysis. Genet Epidemiol. 1997;14:1011–1016. doi: 10.1002/(SICI)1098-2272(1997)14:6<1011::AID-GEPI75>3.0.CO;2-L. [DOI] [PubMed] [Google Scholar]
- 17.Miller MB. MER2SOL: Translating MERLIN or Loki IBD Data to SOLAR Format. Genetic Epidemiology. 2003;25:261–262. [Google Scholar]
- 18.Blangero J, Williams JT, Almasy L. Robust LOD scores for variance component-based linkage analysis. Genet Epidemiol. 2000;19(Suppl 1):S8–14. doi: 10.1002/1098-2272(2000)19:1+<::AID-GEPI2>3.0.CO;2-Y. [DOI] [PubMed] [Google Scholar]
- 19.North BV, Curtis D, Sham PC. A note on the calculation of empirical P values from Monte Carlo procedures. Am J Hum Genet. 2002;71:439–441. doi: 10.1086/341527. [DOI] [PMC free article] [PubMed] [Google Scholar]
- 20.Register TC, Burdon KP, Lenchik L, Bowden DW, Hawkins GA, Nicklas BJ, Lohman K, Hsu FC, Langefeld CD, Carr JJ. Variability of serum soluble intercellular adhesion molecule-1 measurements attributable to a common polymorphism. Clin Chem. 2004;50:2185–2187. doi: 10.1373/clinchem.2004.036806. [DOI] [PubMed] [Google Scholar]
- 21.Puthothu B, Krueger M, Bernhardt M, Heinzmann A. ICAM1 amino-acid variant K469E is associated with paediatric bronchial asthma and elevated sICAM1 levels. Genes Immun. 2006;7:322–326. doi: 10.1038/sj.gene.6364302. [DOI] [PubMed] [Google Scholar]
- 22.Kong WJ, Liu J, Jiang JD. Human low-density lipoprotein receptor gene and its regulation. J Mol Med. 2006;84:29–36. doi: 10.1007/s00109-005-0717-6. [DOI] [PubMed] [Google Scholar]
- 23.Takei A, Huang Y, Lopes-Virella MF. Expression of adhesion molecules by human endothelial cells exposed to oxidized low density lipoprotein. Influences of degree of oxidation and location of oxidized LDL. Atherosclerosis. 2001;154:79–86. doi: 10.1016/s0021-9150(00)00465-2. [DOI] [PubMed] [Google Scholar]
- 24.Kawanami D, Maemura K, Takeda N, Harada T, Nojiri T, Imai Y, Manabe I, Utsunomiya K, Nagai R. Direct reciprocal effects of resistin and adiponectin on vascular endothelial cells: a new insight into adipocytokine-endothelial cell interactions. Biochem Biophys Res Commun. 2004;314:415–419. doi: 10.1016/j.bbrc.2003.12.104. [DOI] [PubMed] [Google Scholar]
- 25.Azuma K, Oguchi S, Matsubara Y, Mamizuka T, Murata M, Kikuchi H, Watanabe K, Katsukawa F, Yamazaki H, Shimada A, Saruta T. Novel resistin promoter polymorphisms: association with serum resistin level in Japanese obese individuals. Horm Metab Res. 2004;36:564–570. doi: 10.1055/s-2004-825762. [DOI] [PubMed] [Google Scholar]