

Abstract
Background
Greater central adiposity is related to the risk of diabetes.
Objective
We aimed to test the hypothesis that central adiposity measured by computed tomography (CT) is a better predictor of the risk of diabetes than is body mass index (BMI), waist circumference (WC), waist/hip ratio (WHR), or waist/height ratio.
Design
Visceral adipose tissue (VAT) and subcutaneous adipose tissue (SAT) were measured at the L2–3 and L4–5 disc spaces in 1106 of the 3234 participants in the Diabetes Prevention Program. Sex-specific proportional hazards models were used to evaluate the association between VAT and SAT at both cuts, BMI, and other measures of central adiposity as predictors of the development of diabetes.
Results
Men had more VAT than did women. White subjects had more VAT at both cuts than did other ethnic groups. The ratio of VAT to SAT was lowest in African Americans of both sexes. Among men in the placebo group, VAT at both cuts, WC, BMI, waist/height ratio, and WHR predicted diabetes (hazard ratio: 1.79–1.44 per 1 SD of variable). Among women in the lifestyle group, VAT at both cuts predicted diabetes as well as did BMI, and L2–3 was a significantly better predictor than was WC or WHR. SAT did not predict diabetes. None of the body fat measurements predicted diabetes in the metformin group.
Conclusions
In the placebo and lifestyle groups, VAT at both cuts, WHR, and WC predicted diabetes. No measure predicted diabetes in the metformin group. CT provided no important advantage over these simple measures. SAT did not predict diabetes.
INTRODUCTION
The prevalence of type 2 diabetes has risen steadily in recent decades, and type 2 diabetes is now a global health problem (1). Diabetes causes greater morbidity and mortality, particularly from coronary artery, cerebrovascular, retinal, neurologic, and renal complications (2, 3). Delaying the onset of or preventing diabetes in at-risk populations (4-6) is one strategy for reducing the global health burden. The Diabetes Prevention Program (DPP), a multicenter randomized clinical trial, showed that this could be done. Persons with impaired glucose tolerance who were assigned to treatment with a lifestyle intervention or metformin had significant reductions in their risk of diabetes. At the end of 3.2 y (this average duration of follow-up is 4 mo longer than that reported in the primary outcome article), diabetes incidence rates were 10.8, 7.7, and 5.0 per 100 person-years in the placebo, metformin, and lifestyle groups, respectively. Treatment effects were consistent by sex and race-ethnicity.
Persons who have type 2 diabetes usually are overweight or obese. Central adiposity, particularly a greater amount of intra-abdominal or visceral fat, is an independent risk factor for diabetes (7-25). Baseline anthropometric measurements in the DPP population of 3234 persons significantly predicted the development of diabetes in the placebo and lifestyle arms, but not in the metformin arm. In the entire DPP population, a large waist circumference was a better predictor of risk than were most other anthropometric measures (26).
Visceral fat was measured in a subgroup of the DPP population by using computed tomography (CT), and this report details the relation of central adiposity in this subgroup of the DPP to the risk of developing diabetes We address 3 questions. 1) Does visceral or subcutaneous adipose tissue measured by CT predict the risk of developing diabetes in the DPP? 2) Are measures of central adiposity at L4–5 better than those at L2–3? 3) Are measurements of visceral or subcutaneous fat by CT better at predicting diabetes than is body mass index (BMI), waist circumference, waist/hip ratio (WHR), or waist/height ratio?
SUBJECTS AND MATERIALS
Subject eligibility and recruitment
The design and methods of the DPP study (27), the baseline characteristics of the cohort (28), and the primary outcomes (6) were reported previously. Participants were recruited from 1996 to 1999 by 27 clinical centers located throughout the United States. Key eligibility requirements were age ≥ 25 y, BMI (in kg/m2) ≥ 24 (≥22 for Asian Americans), and impaired glucose tolerance [with a 2-h plasma glucose concentration of 7.8 to 11.0 mmol/L (140–199 mg/dL) after 75 g glucose by mouth] plus a fasting plasma glucose concentration of 5.3 to 6.9 mmol/L (95–125 mg/dL) [≤7.0 mmol/L (≤125 mg/dL) in the American Indian centers].
All participants in this substudy gave written informed consent to a substudy consent form that had been approved by the institutional review boards at all of the participating sites.
Intervention groups
Participants were randomly assigned to 1 of 3 treatment groups—a placebo group, a group receiving metformin (850 mg 2 times/d), and a group treated with an intensive lifestyle modification program. The goals of the intensive lifestyle intervention were to achieve and maintain a weight reduction of ≥7% of initial body weight through healthy eating, which emphasized a low-fat diet and reduced calories, and to achieve and maintain a level of physical activity of ≥150 min/wk through moderate-intensity activity, such as walking or bicycling. The weight-loss goal was attempted initially through a reduction in dietary fat intake to <25% of calories. If weight loss did not occur with fat restriction alone, calorie restriction was added (6, 29).
Primary outcomes
Throughout the study, which averaged 3.2 y [4 mo longer than the 2.8 y reported in the primary outcome article (6)], participants in the lifestyle intervention group lost a mean of 5.6 kg. Diabetes incidence rates were 10.8, 7.7, and 5.0 per 100 person-years in the placebo, metformin, and lifestyle groups, respectively, and they resulted in a 55% (95% CI: 45%, 63%) reduction in the incidence of diabetes in the lifestyle group and a 30% (95% CI: 16%, 41%) reduction in the metformin group, both versus placebo. The lifestyle intervention was significantly more effective than was metformin. Treatment effects were similar across sex and self-reported race-ethnicity groups.
Measurements of body size and shape
During the baseline screening visits, body size and shape measurements were obtained for all 3234 participants (26). All staff members performing these measurements were certified annually. Height was measured with a stadiometer to the nearest 0.5 cm. Body weight was measured on a calibrated balance scale. Waist circumference and hip circumference were obtained by using a cloth tape. The waist was defined as the midpoint between the highest point of the iliac crest and the lowest part of the costal margin in the midaxillary line, and the hips were measured at the level of the greater femoral trochanters (30). We used these measurements to compute the waist circumference divided by the hip circumference [waist-hip ratio (WHR)] and the BMI.
Computed tomography measurements of subcutaneous and visceral adipose tissue
Participants from 18 of the 27 sites (n = 1106) volunteered for measurement of adipose tissue by CT. The instruments used included the GE High Speed Advantage (General Electric, Milwaukee, WI), at 5 centers, the Picker PQ 5000 (Picker, Groton, CT) at 5 centers, the Siemens and Siemens Somatom Plus (Siemens and Siemens, New York, NY) at 2 centers, the GE 9800 (General Electric) at 3 centers, and the GE Highlite (General Electric) at 2 centers. Two 10-mm-thick axial images were obtained at the L2–3 and L4–5 disc spaces. The data obtained were submitted to a central reading facility at the University of Colorado in Denver by data tape, optical disc, or Write Once Read Many disc. The reading center calculated the total visceral adipose area on each scan, delineated visceral fat from subcutaneous fat by circumscribing the transversalis fascia, and calculated subcutaneous adipose tissue (SAT) by subtracting the visceral adipose tissue (VAT) from the total cross-sectional area for fat. Each subject served as his or her own control, which was done by creating a bimodal histogram depicting the distribution of Hounsfield units for fat and muscle that resulted in 2 easily separable peaks, one for muscle and other for fat. The peak also defines the range of fat density for that participant. Four such measurements were obtained per image, and means and SDs were calculated. This method eliminated errors that may occur if the CT scanner calibration is off (ie, out of line with expected results). Nine hundred fifty-seven participants had measurements of good quality and both visceral and subcutaneous fat measurements at both slices.
Statistical analysis
Descriptive statistics of baseline measures of central adiposity are computed by sex, race, and treatment groups. Pearson’s correlation coefficients were examined to describe the relations between CT adipose tissue measurements, BMI, and waist. We examined sex differences in mean measures of central adiposity by using Student’s t test. To describe differences in central adiposity between ethnic groups by sex, we used analysis of variance. P values were adjusted for multiple comparisons by using Holm’s procedure (31).
We used Cox regression models to assess the effect of baseline measures of central adiposity on the development of diabetes. Hazards ratios for the measures of central adiposity are reported per 1 SD. Models were run separately for each treatment group after adjustment for age, sex, and self-reported ethnicity, and a test of heterogeneity was used to ascertain whether the effect of central adiposity differed across treatment groups. The interaction between sex and each body fat measurement was also tested in each model. Madalla’s likelihood ratio (32) was used to compare the relative contribution of each body fat measurement added to a model adjusted for age and self-reported race-ethnicity within each treatment group. The methods described by Pencina and D’Agostino (33) were used to compute the overall c-index as a measure of discrimination in Cox regression models, and the methods of DeLong et al (34) were used to compare receiver operating characteristic (ROC) curves. The c-index is a generalization of the area under the ROC curve. It is the probability of concordance between observed and predicted disease-free survival based on pairs of subjects. Like the area under the ROC curve, the c-index ranges from 0.5 (no predictive value) to 1.0 (perfect prediction). This analysis compared each measure of central adiposity to each other measure separately by sex and treatment group. Each model was adjusted for age at randomization and self-reported race-ethnicity. P < 0.05 was considered statistically significant. SAS software (version 8.2; SAS Institute Inc, Cary, NC) was used for all analyses.
RESULTS
The between-clinics variability in measurement for both SAT and VAT at L2–3 and L4–5 for men and women is considerably smaller than the within-clinics variance, which indicates that the methods for measuring CT at different clinics did not play an important part in the overall variability of the scan measurements (data not shown).
The baseline data by sex and self-reported race-ethnicity for the subgroup that underwent CTs are shown in Table 1. Among the 200 white men, visceral fat (whether measured at L2–3 or L4–5), weight, waist circumference, hip circumference, and WHR were significantly larger than in ≥1 of the other groups of men. In contrast, there were no significant ethnic differences in subcutaneous fat at either site, or in the ratio of VAT to SAT (VAT/SAT) at L2–3, BMI, or waist/height ratio.
TABLE 1.
Baseline characteristics by self-reported race-ethnicity in study subjects1
| Racial-ethnic group
|
|||||
|---|---|---|---|---|---|
| Baseline characteristics by sex | White | African American | Hispanic | Asian or Pacific Islander | P for ethnicity2 |
| Participants (n) | |||||
| Men | 200 | 49 | 52 | 20 | <0.01 |
| Women | 346 | 157 | 104 | 21 | <0.01 |
| Age (y) | |||||
| Men | 55.1 ± 11.73 | 54.3 ± 10.2 | 51.2 ± 12.3 | 53.1 ± 9.4 | 0.16 |
| Women | 52.0 ± 10.3a,b | 49.2 ± 9.3a | 47.4 ± 8.9b | 52.3 ± 7.8 | <0.01 |
| Visceral L2–3 (cm2) | |||||
| Men | 281 ± 87.7a,b,c | 215 ± 57.9a | 243 ± 85.3b | 222 ± 89.0c | <0.01 |
| Women | 179 ± 68.4a,b | 137 ± 47.4a,b | 167 ± 49.5b,c | 131 ± 48.6b,c | <0.01 |
| Visceral L4–5 (cm2) | |||||
| Men | 195 ± 76.1a,b,c | 143 ± 49.8a | 163 ± 69.8b | 142 ± 49.8c | <0.01 |
| Women | 161 ± 61.9a,b | 131 ± 49.1a | 143 ± 44.6b | 137 ± 50.0 | <0.01 |
| Subcutaneous L2–3 (cm2) | |||||
| men | 261 ± 106 | 244 ± 124 | 231 ± 113 | 215 ± 98.8 | 0.12 |
| Women | 330 ± 123a,b | 362 ± 134a,c,d | 326 ± 112c,e | 233 ± 90.5b,c,d | <0.01 |
| Subcutaneous L4–5 (cm2) | |||||
| men | 360 ± 121 | 347 ± 135 | 336 ± 138 | 294 ± 134 | 0.12 |
| Women | 484 ± 138a | 512 ± 154 | 475 ± 135b | 376 ± 131a,b | <0.01 |
| VAT/SAT L2–3 | |||||
| men | 1.23 ± 0.55 | 1.04 ± 0.45 | 1.24 ± 0.61 | 1.10 ± 0.45 | 0.13 |
| Women | 0.57 ± 0.20a | 0.41 ± 0.16a,b,c | 0.55 ± 0.18b | 0.61 ± 0.23c | <0.01 |
| VAT/SAT L4–5 | |||||
| men | 0.59 ± 0.26a | 0.45 ± 0.19a | 0.54 ± 0.25 | 0.53 ± 0.21 | <0.01 |
| Women | 0.35 ± 0.14a | 0.27 ± 0.11a,b,c | 0.32 ± 0.11b | 0.39 ± 0.16c | <0.01 |
| Weight (kg) | |||||
| men | 101 ± 16.2a,b | 98.3 ± 16.7 | 94.3 ± 17.2a | 88.9 ± 17.1b | <0.01 |
| Women | 88.8 ± 17.2a,b | 93.8 ± 17.4a,c,d | 84.8 ± 15.1c | 75.9 ± 12.9b,d | <0.01 |
| BMI (kg/m2) | |||||
| men | 32.4 ± 5.3 | 32.0 ± 4.8 | 31.7 ± 5.3 | 30.2 ± 5.1 | 0.32 |
| Women | 33.3 ± 6.1a | 34.5 ± 5.9b | 33.7 ± 5.6c | 29.8 ± 5.3a,b,c | <0.01 |
| Waist circumference (cm) | |||||
| men | 111 ± 11.1a,b,c | 106 ± 12.2a | 105 ± 12.3b | 101 ± 12.8c | <0.01 |
| Women | 101 ± 13.5a | 103 ± 12.3b,c | 98.1 ± 11.2b | 91.3 ± 10.5a,c | <0.01 |
| Hip circumference (cm) | |||||
| men | 110 ± 9.0a,b | 108 ± 9.2c | 105 ± 10.4a | 102 ± 11.4b,c | <0.01 |
| Women | 115 ± 12.3a | 115 ± 11.3b | 112 ± 10.6 | 105 ± 11.6a,b | <0.01 |
| Waist/hip ratio | |||||
| men | 1.01 ± 0.06a | 0.98 ± 0.07a | 0.99 ± 0.06 | 1.00 ± 0.04 | 0.03 |
| Women | 0.88 ± 0.07 | 0.89 ± 0.07 | 0.88 ± 0.07 | 0.87 ± 0.06 | 0.08 |
| Waist/height ratio | |||||
| men | 0.63 ± 0.06 | 0.60 ± 0.07 | 0.61 ± 0.07 | 0.59 ± 0.07 | 0.03 |
| Women | 0.62 ± 0.08a | 0.62 ± 0.07b | 0.62 ± 0.07c | 0.57 ± 0.07a,b,c | 0.04 |
n = 321 men, 636 women. VAT, visceral adipose tissue; SAT, subcutaneous adipose tissue. Values in a row with the same superscript letters are significantly different between ethnic groups, P ≤ 0.05. Type I errors from multiple comparisons were controlled by using the Holm procedure.
American Indians were included in the analysis, as the earlier mention of “American Indian centers” suggests, but their data are not shown because of the small sample size. F test from ANOVA.
x̄ ± SD (all such values).
Among women (Table 1), there was an even larger number of differences between ethnic groups. The 346 white women were older, had more visceral fat at both L2–3 and L4–5, and had more subcutaneous fat at L2–3 than did ≥1 of the other groups of women. African American women had less visceral fat at L2-3 than did Hispanic or white women, and they were heavier than women in any other subgroup. African American women had larger waist circumferences than did either Hispanic or Asian or Pacific Islander women. Asian or Pacific Islander women had less subcutaneous fat at L2–3, lower BMI, and lower waist/height ratio than did all other groups; they also weighed less and had smaller waist and hip circumferences than did whites and African Americans; and they had less VAT at L2–3 than did African Americans and Hispanics. The WHR did not differ significantly between groups.
There were significant differences for all body measurements between the sexes (P < 0.01). BMI and hip circumference were larger in women than in the corresponding group of men (Table 1). In contrast, waist circumference and WHR were significantly smaller than in the men. The differences between the sexes for the visceral and subcutaneous cross-sectional areas at disc spaces L2–3 and at L4–5 are shown in Figure 1. VAT was significantly higher in men than in women, and there was more VAT in both sexes at L2–3 than at L4–5. In contrast, there was more SAT in women than in men, and larger values for both sexes were seen at L4–5 than at L2–3. SAT at L4–5 was much larger than that at L2–3 in both men and women. Waist circumference was significantly larger in the men than in the women, but the BMI was lower in all male groups except the Asian or Pacific Islander group. All differences were significant at P < 0.01.
FIGURE 1.
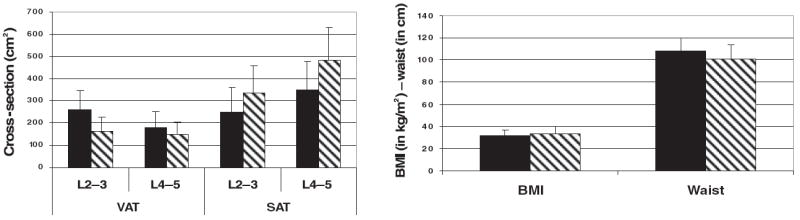
Comparison of visceral adipose tissue (VAT) and subcutaneous adipose tissue (SAT) at each of the 2 computed tomography cross-sectional cutoffs with BMI and waist circumference in men (■) and women (▧). Left: the cross-sectional area of VAT and SAT in both sexes by computed tomography at the L2–3 and L4–5 intervertebral lumbar spaces. Right: BMI and waist circumference of the men and the women.
The relations between visceral and subcutaneous fat areas are shown in Table 2. There was a strong correlation between visceral fat at L2–3 and that at L4–5 in men (r = 0.81) and women (r = 0.82), and the correlation did not differ significantly between sexes (P = 0.721, z test). Subcutaneous fat was even more highly correlated in men (r = 0.93) and women (r = 0.86), and this difference between sexes was highly significant (P < 0.001, z test). Visceral fat and subcutaneous fat were less highly correlated in men (r = 0.28 for L2–3 and r = 0.25 for L4–5) than in women (r = 0.44 for L2–3 and r = 0.33 for L4–5); all correlations were significantly different from 0 at P < 0.01, and VAT and SAT at L2–3 differed significantly between the sexes (P < 0.007, z test), but VAT and SAT at L4–5 did not. Both visceral and subcutaneous fat were clearly correlated with waist circumference in men (visceral fat: r = 0.683 and 0.59 for L2–3 and L4–5, respectively; subcutaneous fat: r = 0.98 and 0.81 for L2–3 and L4–5, respectively) and women (visceral fat: r = 0.64 and 0.63 for L2–3 and L4–5, respectively; subcutaneous fat: r = 0.83 and 0.74 for L2–3 and L4–5, respectively).
TABLE 2.
Correlation between visceral and subcutaneous fat depots in men and women
| Correlation coefficients
|
|||
|---|---|---|---|
| Women (n = 636) | Men (n = 321) | P | |
| Correlation coefficients | |||
| VAT 2–3 | |||
| VAT 4–5 | 0.81822 | 0.80993 | 0.721 |
| SAT 2–3 | 0.44531 | 0.28457 | 0.007 |
| SAT 4–5 | 0.39354 | 0.40023 | 0.908 |
| VAT 4–5 | |||
| SAT 2–3 | 0.41262 | 0.19105 | <0.001 |
| SAT 4–5 | 0.33419 | 0.24795 | 0.17 |
| SAT 2–3 | |||
| SAT 4–5 | 0.86272 | 0.93429 | <0.001 |
To further examine the ethnic differences in subcutaneous and visceral fat, we used VAT/SAT. In men, VAT/SAT at L2–3 is >1.0 in all groups (Table 1), and there are no significant differences between groups. In contrast, VAT/SAT is <1 at L4–5 in all groups of men and is significantly smaller in the African American men than in the white men. VAT/SAT at L2–3 and L4–5 was smallest in the African American women (Table 1). VAT/SAT at L4–5 was lower in all groups than that at L2–3, but the ethnic difference was still present: it was lower in African American women than in any other women.
Because the interactions between sex and waist (P = 0.09), VAT L4–5 (P = 0.04), and waist/height ratio (P = 0.03) were significant, we analyzed the data for each sex separately. The hazard ratio, the c-index from the ROCs analyzing the sensitivity and specificity for this prediction, and the percentage R2 for developing diabetes using Cox regression models for each measure of subcutaneous and visceral fat are shown in Table 3. Among the men in the placebo group (Table 3), visceral fat at L2–3 and L4–5, waist circumference, BMI, WHR, and waist/ height ratio predicted the likelihood of developing diabetes (P < 0.05 or better). Among women in the placebo group, VAT/SAT was a significant predictor of diabetes. The use of the c-index on data in the placebo groups showed that none of these measures was significantly better than any other.
TABLE 3.
Cox regression models testing the association between baseline measures of central adiposity and the incidence of diabetes in the computed tomography substudy (HR per 1 SD) by treatment group during an average 3.2-y follow-up1
| Placebo group (n = 108)
|
Metformin group (n = 112)
|
Lifestyle group (n = 101)
|
||||||||||
|---|---|---|---|---|---|---|---|---|---|---|---|---|
| Baseline measurement | c-Index | R2 | HR (95% CI) | P | c-Index | R2 | HR (95% CI) | P | c-Index | R2 | HR (95% CI) | P |
| men | ||||||||||||
| Visceral 4–5 | 0.683 | 7.3 | 1.79 (1.21, 2.67) | <0.01 | 0.629 | 0.3 | 1.12 (0.70, 1.81) | 0.64 | 0.644a | 0.2 | 1.13 (0.62, 2.08) | 0.69 |
| Waist | 0.697 | 6.4 | 1.69 (1.14, 2.51) | <0.01 | 0.640 | 1.4 | 1.49 (0.79, 2.84) | 0.22 | 0.661b | 1.0 | 1.50 (0.69, 3.25) | 0.31 |
| BMI | 0.668 | 5.7 | 1.41 (1.10, 4.82) | <0.01 | 0.660 | 1.9 | 1.56 (0.86, 2.82) | 0.14 | 0.656c | 0.5 | 1.37 (0.60, 3.14) | 0.46 |
| Waist/height ratio | 0.670 | 5.1 | 1.49 (1.07, 2.07) | 0.02 | 0.659 | 2.4 | 1.66 (0.90, 3.05) | 0.11 | 0.711 | 1.6 | 1.65 (0.78, 3.48) | 0.19 |
| Visceral 2–3 | 0.634 | 3.9 | 1.48 (1.02, 2.14) | 0.04 | 0.661 | 2.8 | 1.67 (0.95, 2.93) | 0.07 | 0.698d | 1.9 | 1.61 (0.82, 3.15) | 0.16 |
| Waist/hip ratio | 0.635 | 3.9 | 1.44 (1.00, 2.07) | 0.05 | 0.648 | 1.5 | 1.38 (0.87, 2.19) | 0.18 | 0.825a–h | 7.7 | 3.47 (1.36, 8.89) | <0.01 |
| Subcutaneous 4–5 | 0.648 | 3.2 | 1.41 (0.99, 2.01) | 0.06 | 0.677 | 2.1 | 1.49 (0.91, 2.44) | 0.12 | 0.612e | 0.4 | 1.31 (0.57, 2.99) | 0.53 |
| VAT/SAT L4–5 | 0.591 | 1.3 | 1.26 (0.86, 1.86) | 0.23 | 0.619 | 0.0 | 0.96 (0.58, 1.57) | 0.86 | 0.577g | 0.1 | 0.89 (0.42, 1.87) | 0.75 |
| VAT/SAT L2–3 | 0.594 | 0.8 | 1.20 (0.81, 1.79) | 0.36 | 0.628 | 1.3 | 1.34 (0.84, 2.13) | 0.21 | 0.605h | 0.2 | 1.16 (0.57, 2.36) | 0.68 |
| Women | ||||||||||||
| VAT/SAT L4–5 | 0.602 | 1.9 | 1.29 (1.02, 1.64) | 0.03 | 0.606 | 0.3 | 1.16 (0.80, 1.68) | 0.43 | 0.598a | 0.3 | 1.17 (0.80, 1.71) | 0.42 |
| Waist/hip ratio | 0.586 | 1.6 | 1.31 (0.98, 1.75) | 0.07 | 0.620 | 0.4 | 1.17 (0.83, 1.65) | 0.36 | 0.608b | 0.9 | 1.31 (0.89, 1.93) | 0.17 |
| Visceral 2–32 | 0.604 | 1.3 | 1.28 (0.96, 1.70) | 0.09 | 0.608 | 0.3 | 1.16 (0.82, 1.64) | 0.40 | 0.722a,b,c,d | 4.7 | 2.12 (1.34, 3.34) | <0.01 |
| Visceral 4–5 | 0.598 | 1.3 | 1.24 (0.96, 1.61) | 0.10 | 0.596 | 0.3 | 1.14 (0.81, 1.62) | 0.45 | 0.662 | 2.5 | 1.64 (1.11, 2.43) | 0.01 |
| VAT/SAT L2–3 | 0.608 | 1.2 | 1.25 (0.95, 1.64) | 0.11 | 0.624 | 0.9 | 1.30 (0.91, 1.86) | 0.15 | 0.608c | 0.7 | 1.28 (0.87, 1.91) | 0.21 |
| Subcutaneous 4–5 | 0.572 | 0.4 | 0.87 (0.64, 1.17) | 0.35 | 0.621 | 0.3 | 0.87 (0.61, 1.24) | 0.44 | 0.654 | 1.2 | 1.43 (0.93, 2.18) | 0.10 |
| Subcutaneous 2–3 | 0.560 | 0.2 | 0.90 (0.66, 1.23) | 0.52 | 0.611 | 0.2 | 0.88 (0.59, 1.31) | 0.53 | 0.651 | 1.1 | 1.40 (0.92, 2.14) | 0.12 |
| BMI | 0.553 | 0.0 | 0.98 (0.71, 1.35) | 0.89 | 0.611 | 0.0 | 0.95 (0.66, 1.39) | 0.81 | 0.658 | 1.8 | 1.57 (1.02, 2.43) | 0.04 |
| Waist/height ratio | 0.555 | 0.0 | 0.98 (0.71, 1.35) | 0.88 | 0.607 | 0.0 | 1.00 (0.72, 1.38) | 0.99 | 0.633 | 1.2 | 1.42 (0.94, 2.14) | 0.10 |
| Waist | 0.559 | 0.0 | 1.02 (0.75, 1.40) | 0.89 | 0.607 | 0.0 | 1.03 (0.71, 1.49) | 0.89 | 0.631d | 1.0 | 1.43 (0.89, 2.29) | 0.14 |
n = 321 men, 636 women. VAT, visceral adipose tissue; SAT, subcutaneous adipose tissue; HR, hazard ratio. Models are ordered by R2 for the placebo group and are adjusted for self-reported race-ethnicity and age at randomization. Values in the c-index column under Lifestyle group that have the same superscript letter are significantly different, P = 0.05.
Significant differences between treatment groups.
Treatment assignment affected the relation of central adiposity to the risk of diabetes. In men in the lifestyle group, only the WHR significantly predicted diabetes, and it was significantly more predictive than any of the other measures except waist/ height ratio. In women in the lifestyle group (Table 3), baseline measures of visceral fat at L2–3 and L4–5 and of BMI predicted the development of diabetes. The lifestyle intervention succeeded in preventing diabetes in those women with the lowest visceral fat and BMI. There were no effects of baseline measures of central adiposity on the incidence of diabetes in the metformin group.
To assess the relative value of measures of central adiposity in predicting diabetes, we used the c-index from the ROCs of the Cox regression models (34). In men in the lifestyle group, the WHR was a significantly better predictor of diabetes than were all other measures of central adiposity except the waist/height ratio (Table 3), although none of the others predicted diabetes by themselves. In women in the lifestyle group, visceral fat at L2–3 was a significantly better predictor than were waist, the WHR, and VAT/SAT at both cuts (Table 3).
DISCUSSION
Here we report on measures of subcutaneous and visceral fat as predictors of the development of diabetes in a subgroup of the DPP who underwent CT scans at baseline. In this subgroup, the relation of visceral fat to the development of diabetes was clearly shown in some treatment groups but not in others. Using Cox proportional hazards models, we found that, among the men in the placebo group, higher visceral fat at either L2–3 or L4–5 and waist circumference, BMI, WHR, and waist/height ratio significantly predicted the onset of diabetes. None of these measures was significantly better than any other, and thus CT provides no important advantage over these simpler measures of central adiposity. In contrast, subcutaneous fat measured by CT did not predict diabetes. In women, these measures of visceral fat are generally not strong predictors, and there is at least one treatment group interaction. These outcomes may be due to the fact that women have more subcutaneous fat than men and to the possibility that, because the subcutaneous fat measured by CT did not predict diabetes, the higher subcutaneous fat may have “diluted” the effect of the visceral fat.
In the entire DPP population of 3234 subjects, baseline waist circumference, waist/height ratio, BMI, hip circumference, and WHR predicted the development of diabetes (26). Of these measures, waist circumference had the highest or second-highest percentage R2 value for predicting diabetes in both sexes. Cox hazard ratios per 1 SD were 1.43 and 1.49 for men in the placebo and lifestyle groups, respectively, and 1.29 and 1.53, respectively, for women in these same groups. The c-index from the ROCs also favored the waist circumference in men and women (26). In the subgroup for which CT scans are reported here, waist circumference, WHR, and BMI also were significant predictors, but, in addition, VAT but not SAT was a significant predictor. The simplicity with which waist circumference can be measured appears to make it the preferable surrogate for visceral fat.
Treatment assignment affected the relation of baseline measures of central adiposity in predicting the development of diabetes. In men in the lifestyle group, WHR was a significant predictor of the risk of diabetes. Among women in the lifestyle group, visceral fat at L2–3 was a significantly better predictor than were waist, WHR, and VAT:SAT at both cuts. This implies that in men the interventions were effective regardless of the amount or type of visceral fat present at baseline. No measure of visceral fat or subcutaneous fat predicted diabetes in the metformin group. Thus metformin and lifestyle treatments were successful in reducing diabetes incidence regardless of baseline measures of central adiposity.
Men and women have different distributions of visceral and subcutaneous fat, as is evident at both L2–3 and L4–5. Women had more subcutaneous fat and men had more visceral fat at both CT cross-sectional measurements. Our findings that men had more visceral fat and less subcutaneous fat than women thus are in agreement with other studies (24, 35). Although BMI was similar in the 4 ethnic groups of men, visceral fat in the African American men at both L2–3 and L4–5 was lower than that in the white or Hispanic men and comparable to that in the Asian or Pacific Islander men. Because the DPP population is not a random sample, these conclusions must thus be interpreted with these differences in mind. Although the ethnic differences in women were marked, that finding must interpreted cautiously. However, our data are consistent with numerous other studies that showed smaller amounts of visceral fat in African Americans (36-41).
There has been much discussion of whether visceral fat, subcutaneous fat, or waist circumference is the best measure with respect to risk of metabolic disease. In the present analysis, these measures were highly correlated, and, thus, the information derived from any one of these variables is shared to a large extent with the others. By analysis of ROCs, we were able to test whether measures of visceral fat, subcutaneous fat, or waist circumference differed with respect to prediction of diabetes. As has been shown in the literature (9-21), we showed that—in addition to visceral fat measured by CT—BMI, waist circumference, and WHR are predictors for the risk of developing diabetes. The c-index from the ROCs showed that, among men in the lifestyle group, was a significantly better predictor of diabetes than was any other measure of central fat. WHR also predicted diabetes in the men in the placebo group, but it was not significantly more predictive than was visceral fat (at both L2–3 and L4–5), waist circumference, BMI, or waist/height ratio. Among women in the lifestyle group, visceral fat (at both L2–3 and L4–5) and BMI predicted diabetes. Using the c-index from the ROCs, we found that visceral fat at L2–3 was a significantly better predictor of diabetes than was WHR, waist circumference, or VAT/SAT. In the Health Professionals Follow-up Study, Wang et al (21) found that BMI and waist circumference predicted the risk of diabetes, but waist was a slightly better predictor than BMI.
The strengths of this trial are the large number of subjects with a laboratory diagnosis of impaired glucose tolerance who underwent CT scans during their baseline evaluation and who were followed for the development of diabetes for an average of 3.2 y. One weakness is that the subjects had a relatively high BMI and large amounts of visceral and subcutaneous fat. Compared with the obese men and women in the study of Fujioka et al (13) who had impaired glucose or lipid metabolism, the population of the present study had a quantity of visceral and subcutaneous fat of ≥50%. The greater amount of VAT in the DPP participants may account, in part, for the relatively low hazard ratio for predicting the development of diabetes. Another limitation is that, because not all DPP participants were in the CT substudy, there may be some differences in results between the cohort in the present study and the entire DPP population. Such differences may be due to differences in baseline characteristics, such as lower body weight, BMI, and hip and waist circumferences, in the substudy participants than in the entire DPP cohort, but they also may be due to the smaller number of participants in the substudy.
In summary, this substudy from the DPP has shown that baseline measurements of BMI and central adiposity by several methods, including visceral fat measured by CT, waist circumference, and WHR, predicted the development of diabetes. BMI also predicted the risk of diabetes. No one of these measures was consistently better than the others, and, thus, CT measurement provides no important advantage over simpler measures. There were significant ethnic differences in VAT: African Americans had lower levels of VAT than of subcutaneous fat. The 2 CT cuts, L2–3 and L4–5, produced similar results. No baseline measures of central adiposity were predictive in the participants taking metformin. We conclude that visceral fat measured by CT at L2–3 and L4–5 is a significant predictor of diabetes in one or more subgroups of persons, but that subcutaneous fat by CT is not predictive of the risk for developing diabetes in the DPP population.
Acknowledgments
We gratefully acknowledge the commitment and dedication of the participants in the Diabetes Prevention Program.
Footnotes
Supported by the National Institutes of Health through the National Institute of Diabetes and Digestive and Kidney Diseases (NIDDK); the National Heart, Lung, and Blood Institute; the National Center on Minority and Health Disparities; the National Institute of Child Health and Human Development; the Office of Women’s Health; and the National Institute on Aging; also supported by the Indian Health Service, the Centers for Disease Control and Prevention, the American Diabetes Association, Bristol-Myers Squibb, Parke-Davis, and the intramural research program of the NIDDK. The General Clinical Research Center Program, National Center for Research Resources, supported many of the centers. Support to most of the clinical centers and the coordinating center was provided by the NIDDK through a cooperative agreement; the American Indian centers in the Southwest were supported directly by NIDDK and the Indian Health Service.
None of the authors have a personal or financial conflict of interest.
References
- 1.Wild S, Green A, Sicree R, King H. Global prevalence of diabetes: estimates for the year 2000 and projections for 2030. Diabetes Care. 2004;27:1047–53. doi: 10.2337/diacare.27.5.1047. [DOI] [PubMed] [Google Scholar]
- 2.McAlpine RR, Morris AD, Emslie-Smith A, James P, Evans JM. The annual incidence of diabetic complications in a population of patients with type 1 and type 2 diabetes. Diabet Med. 2005;22(3):348–52. doi: 10.1111/j.1464-5491.2004.01391.x. [DOI] [PubMed] [Google Scholar]
- 3.Amos AF, McCarty DJ, Zimmet P. The rising global burden of diabetes and its complications: estimates and projections to the year 2010. Diabet Med. 1997;14:81–5. [PubMed] [Google Scholar]
- 4.Pan XR, Li GW, Hu YH, et al. Effects of diet and exercise in preventing NIDDM in people with impaired glucose tolerance. The Da Zing IGT and Diabetes Study. Diabetes Care. 1997;20:537–44. doi: 10.2337/diacare.20.4.537. [DOI] [PubMed] [Google Scholar]
- 5.Tuomilehto J, Lindstrom J, Eriksson JG, et al. Prevention of type 2 diabetes mellitus by changes in lifestyle among subjects with impaired glucose tolerance. N Engl J Med. 2001;344:1343–50. doi: 10.1056/NEJM200105033441801. [DOI] [PubMed] [Google Scholar]
- 6.Diabetes Prevention Program Research Group. Reduction in the incidence of type 2 diabetes with lifestyle intervention or metformin. N Engl J Med. 2002;346:393–403. doi: 10.1056/NEJMoa012512. [DOI] [PMC free article] [PubMed] [Google Scholar]
- 7.Vague J. The degree of masculine differentiation of obesities determining predisposition to diabetes, atherosclerosis, gout and uric calculus disease. Am J Clin Nutr. 1956;4:20–34. doi: 10.1093/ajcn/4.1.20. [DOI] [PubMed] [Google Scholar]
- 8.Feldman R, Sender AJ, Siegelaub AB. Difference in diabetic and non-diabetic fat distribution patterns by skinfold measurements. Diabetes. 1969;18:478–86. doi: 10.2337/diab.18.7.478. [DOI] [PubMed] [Google Scholar]
- 9.Kissebah AH, Vydelingum N, Murray R, et al. Relation of body fat distribution to metabolic complications of obesity. J Clin Endocrinol Metab. 1982;54:254–60. doi: 10.1210/jcem-54-2-254. [DOI] [PubMed] [Google Scholar]
- 10.Hartz AJ, Rupley DC, Jr, Kalkhoff RD, Rimm AA. Relationship of obesity to diabetes: influence of obesity level and body fat distribution. Prev Med. 1983;12:351–7. doi: 10.1016/0091-7435(83)90244-x. [DOI] [PubMed] [Google Scholar]
- 11.Ohlson LO, Larsson B, Svardsudd K, et al. The influence of body fat distribution on the incidence of diabetes mellitus. 13.5 years of follow-up of the participants in the study of men born in 1913. Diabetes. 1985;34:1055–8. doi: 10.2337/diab.34.10.1055. [DOI] [PubMed] [Google Scholar]
- 12.Sparrow D, Borkan GA, Gerzof SG, Wisniewski C, Silbert CK. Relationship of fat distribution to glucose tolerance. Diabetes. 1986;35:411–5. doi: 10.2337/diab.35.4.411. [DOI] [PubMed] [Google Scholar]
- 13.Fujioka S, Matsuzawa Y, Tokunaga K, Tarui S. Contribution of intra-abdominal fat accumulation to the impairment of glucose and lipid metabolism in human obesity. Metabolism. 1987;36:54–9. doi: 10.1016/0026-0495(87)90063-1. [DOI] [PubMed] [Google Scholar]
- 14.Despres JP, Nadeau A, Tremblay A, et al. Role of deep abdominal fat in the association between regional adipose tissue distribution and glucose tolerance in obese women. Diabetes. 1989;38:304–9. doi: 10.2337/diab.38.3.304. [DOI] [PubMed] [Google Scholar]
- 15.Lundgren H, Bengtsson C, Blohme G, Lapidus L, Sjöström L. Adiposity and adipose tissue distribution in relation to incidence of diabetes in women: results from a prospective population study in Gothenburg, Sweden. Int J Obes. 1989;13:413–23. [PubMed] [Google Scholar]
- 16.Haffner SM, Stern MP, Mitchell BD, Hazuda HP, Patterson JK. Incidence of type II diabetes in Mexican Americans predicted by fasting insulin and glucose levels, obesity and body fat distribution. Diabetes. 1990;39:283–8. doi: 10.2337/diab.39.3.283. [DOI] [PubMed] [Google Scholar]
- 17.Carey VJ, Walters EE, Colditz GA, et al. Body fat distribution and risk of non-insulin-dependent diabetes mellitus in women. The Nurses’ Health Study. Am J Epidemiol. 1997;145:614–9. doi: 10.1093/oxfordjournals.aje.a009158. [DOI] [PubMed] [Google Scholar]
- 18.Wei M, Gaskill SP, Haffner SM, Stern MP. Waist circumference as the best predictor of non-insulin dependent diabetes mellitus (NIDDM) compared to body mass index, waist/hip ratio and other anthropometric measurements in Mexican Americans—a 7-year prospective study. Obes Res. 1997;5(1):16–23. doi: 10.1002/j.1550-8528.1997.tb00278.x. [DOI] [PubMed] [Google Scholar]
- 19.Kaye SA, Folsom AR, Sprafka JM, Prineas RJ, Wallace RB. Increased incidence of diabetes mellitus in relation to abdominal adiposity in older women. J Clin Epidemiol. 1991;44(3):329–34. doi: 10.1016/0895-4356(91)90044-a. [DOI] [PubMed] [Google Scholar]
- 20.Chan JM, Rimm EB, Colditz GA, Stampfer MJ, Willett WC. Obesity, fat distribution, and weight gain as risk factors for clinical diabetes in men. Diabetes Care. 1994;17(9):961–9. doi: 10.2337/diacare.17.9.961. [DOI] [PubMed] [Google Scholar]
- 21.Wang Y, Rimm EB, Stampfer MJ, Willett WC, Hu FB. Comparison of abdominal adiposity and overall obeity in predicting risk of type 2 diabetes among men. Am J Clin Nutr. 2005;81(3):555–63. doi: 10.1093/ajcn/81.3.555. [DOI] [PubMed] [Google Scholar]
- 22.Lean ME, Han TS, Morrison CE. Waist circumference as a measure for indicating need for weight management. BMJ. 1995;311(6998):158–61. doi: 10.1136/bmj.311.6998.158. [DOI] [PMC free article] [PubMed] [Google Scholar]
- 23.Pouliot MC, Despres JP, Lemieux S, et al. Waist circumference and abdominal sagittal diameter: best simple anthropometric indexes of abdominal visceral adipose tissue accumulation and related cardiovascular risk in men and women. Am J Cardiol. 1994;73(7):460–8. doi: 10.1016/0002-9149(94)90676-9. [DOI] [PubMed] [Google Scholar]
- 24.Kvist H, Chowdhury B, Grangard U, Tylen U, Sjostrom L. Total and visceral adipose-tissue volumes derived from measurements with computed tomography in adult men and women: predictive equations. Am J Clin Nutr. 1988;48:1351–61. doi: 10.1093/ajcn/48.6.1351. [DOI] [PubMed] [Google Scholar]
- 25.Kotani K, Tokunaga K, Fujioka S, et al. Sexual dimorphism of age-related changes in whole-body fat distribution in the obese. Int J Obes Relat Metab Disord. 1994;18:207–12. [PubMed] [Google Scholar]
- 26.Relationship of body size and shape to the development of diabetes in the Diabetes Prevention Program. Obesity. 2006;14:2107–17. doi: 10.1038/oby.2006.246. [DOI] [PMC free article] [PubMed] [Google Scholar]
- 27.The Diabetes Prevention Program. Design and methods for a clinical trial in the prevention of type 2 diabetes. Diabetes Care. 1999;22(4):623–34. doi: 10.2337/diacare.22.4.623. Published erratum appears in Diabetes Care 1999;22:1389. [DOI] [PMC free article] [PubMed] [Google Scholar]
- 28.The Diabetes Prevention Program: baseline characteristics of the randomized cohort. The Diabetes Prevention Program Research Group. Diabetes Care. 2000;23:1619–29. doi: 10.2337/diacare.23.11.1619. [DOI] [PMC free article] [PubMed] [Google Scholar]
- 29.Wing RR, Hamman RF, Bray GA, et al. Diabetes Prevention Program Research Group. Achieving weight and activity goals among Diabetes Prevention Program lifestyle participants. Obes Res. 2004;12(9):1426–34. doi: 10.1038/oby.2004.179. [DOI] [PMC free article] [PubMed] [Google Scholar]
- 30.Lohman TG, Roche AF, Martorell R, editors. Anthropometric standardization reference manual (abridged edition) Champagne, IL: Human Kinetics Books; 1988. [Google Scholar]
- 31.Holm S. A simple sequentially rejective multiple test procedure. Scand J Stat. 1979;6:5–70. [Google Scholar]
- 32.Lachin JM. Biostatistical methods: the assessment of relative risks. New York, NY: Wiley and Son; 2000. [Google Scholar]
- 33.Pencina MJ, D’Agostino RB. Overall C as a measure of discrimination in survival analysis: model specific population value and confidence interval estimation. Stat Med. 2004;23:2109–23. doi: 10.1002/sim.1802. [DOI] [PubMed] [Google Scholar]
- 34.DeLong ER, DeLong DM, Clarke-Pearson DL. Comparing the areas under two or more correlated receiver operating characteristic curves: a nonparametric approach. Biometrics. 1988;44(3):837–45. [PubMed] [Google Scholar]
- 35.Albu JB, Murphy L, Frager DH, Johnson JA, Pi-Sunyer FX. Visceral fat and race-dependent health risks in obese nondiabetic premenopausal women. Diabetes. 1997;46(3):456–62. doi: 10.2337/diab.46.3.456. [DOI] [PubMed] [Google Scholar]
- 36.Conway JM, Yanovski SZ, Avila NA, Hubbard VS. Visceral adipose tissue differences in black and white women. Am J Clin Nutr. 1995;61(4):765–71. doi: 10.1093/ajcn/61.4.765. [DOI] [PubMed] [Google Scholar]
- 37.Lovejoy JC, de la Bretonne JA, Klemperer M, Tulley R. Abdominal fat distribution and metabolic risk factors: effects of race. Metabolism. 1996;45(9):1119–24. doi: 10.1016/s0026-0495(96)90011-6. [DOI] [PubMed] [Google Scholar]
- 38.Hill JO, Sidney S, Lewis CE, Tolan K, Scherziner AL, Stamm ER. Racial differences in amounts of visceral adipose tissue in young adults: the CARDIA (Coronary Artery Risk Development in Young Adults) Study. Am J Clin Nutr. 1999;69(3):381–7. doi: 10.1093/ajcn/69.3.381. [DOI] [PubMed] [Google Scholar]
- 39.Marcus MA, Murphy L, Pi-Sunyer FX, Albu JB. Insulin sensitivity and serum triglyceride level in obese white and black women: relationship to visceral and truncal subcutaneous fat. Metabolism. 1999;48(4):194–9. doi: 10.1016/s0026-0495(99)90033-1. [DOI] [PubMed] [Google Scholar]
- 40.Perry AC, Applegate EB, Jackson ML, et al. Racial differences in visceral adipose tissue but not anthropometric markers of health-related variables. J Appl Physiol. 2000;89(2):636–43. doi: 10.1152/jappl.2000.89.2.636. [DOI] [PubMed] [Google Scholar]
- 41.Okosun IS, Tedders SH, Choi S, Dever GEA. Abdominal adiposity values associated with established body mass indexes in white, black and Hispanic Americans. A study from the Third National Health and Nutrition Examination Survey. Int J Obes Relat Metab Disord. 2000;24(10):1279–85. doi: 10.1038/sj.ijo.0801414. [DOI] [PubMed] [Google Scholar]