Abstract
Risk factors associated with the progression from impaired glucose tolerance (IGT) to NIDDM were examined in data from six prospective studies. IGT and NIDDM were defined in all studies by World Health Organization (WHO) criteria, and baseline risk factors were measured at the time of first recognition of IGT. The studies varied in size from 177 to 693 participants with IGT, and included men and women followed from 2 to 27 years after the recognition of IGT. Across the six studies, the incidence rate of NIDDM was 57.2/1,000 person-years and ranged from 35.8/1,000 to 87.3/1,000 person-years. Although baseline measures of fasting and 2-h postchallenge glucose levels were both positively associated with NIDDM incidence, incidence rates were sharply higher for those in the top quartile of fasting plasma glucose levels, but increased linearly with increasing 2-h postchallenge glucose quartiles. Incidence rates were higher among the Hispanic, Mexican-American, Pima, and Nauruan populations than among Caucasians. The effect of baseline age on NIDDM incidence rates differed among the studies; the rates did not increase or rose only slightly with increasing baseline age in three of the studies and formed an inverted U in three studies. In all studies, estimates of obesity (including BMI, waist-to-hip ratio, and waist circumference) were positively associated with NIDDM incidence. BMI was associated with NIDDM incidence independently of fasting and 2-h post challenge glucose levels in the combined analysis of all six studies and in three cohorts separately, but not in the three studies with the highest NIDDM incidence rates. Sex and family history of diabetes were generally not related to NIDDM progression. This analysis indicates that persons with IGT are at high risk and that further refinement of risk can be made by other simple measurements. The ability to identify persons at high risk of NIDDM should facilitate clinical trials in diabetes prevention.
Approximately 12-15 million Americans have diabetes, [approximately] 90% of whom have NIDDM [1]. Roughly half of those with NIDDM remain undiagnosed [1]. Current statistics from the Centers for Disease Control and Prevention [2] and the National Center for Health Statistics [3] indicate that diabetes is among the 10 leading causes of death and that up to 80% of adults with diabetes die from macrovascular disease (coronary, cerebral, or peripheral vascular). Thus, there is great interest in the prevention of diabetes.
Impaired glucose tolerance (IGT) is the phase of glucose intolerance that indicates a higher than normal risk of progression to NIDDM [4] and, hence, has been used as an entry criterion in clinical trials of diabetes prevention [5]. Factors associated with increased risk of glucose intolerance are well known and include obesity, older age, a family history of diabetes, selected race and ethnicity groups, a history of IGT or of gestational diabetes mellitus, and lipid abnormalities [6-10]. Although many of these diabetes risk factors were originally shown to be associated with the risk of NIDDM, most were also shown to be associated with IGT in an analysis of data from the Second National Health and Nutrition Examination Survey (NHANES II) [11]. Several studies have examined some or all of these risk factors to determine whether they also predict progression from IGT to NIDDM. However, definitions of IGT and NIDDM have varied widely in these published studies, as did follow-up time and overall progression rates [12-31].
This study reports the combined analysis of data sets collected from six prospective studies in diverse populations as a part of the planning for the Diabetes Prevention Program, a clinical trial to prevent NIDDM. These data sets were analyzed to determine IGT-to-NIDDM incidence rates, overall and for various subgroups. In addition, the relationship of prospectively measured diabetes risk factors, including sex, age, BMI, waist circumference, waist-to-hip ratio (WHR), family history of diabetes, race and ethnicity, and fasting and 2-h postchallenge glucose levels measured at a baseline visit on progression from IGT to NIDDM, in these six studies are considered. This is the first publication of comparable prospective data from such a large number of subjects with IGT.
RESEARCH DESIGN AND METHODS
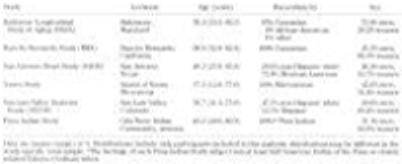
Six prospective studies of nondiabetic adults were included in this combined analysis, including five population-based studies and one volunteer study. These six studies include volunteers from 1) Baltimore, Maryland (Baltimore Longitudinal Study of Aging [BLSA]) [32], and residents from 2) Rancho Bernardo, California (Rancho Bernardo Study [RBS]) [33], 3) San Antonio, Texas (San Antonio Heart Study [SAHS]) [34], 4) the Micronesian island of Nauru in the Pacific Ocean [35], 5) San Luis Valley, Colorado (San Luis Valley Diabetes Study [SLVDS]) [36], and 6) the Gila River Indian Community, Arizona (Pima Indian Study) [37]. Although detailed descriptions of these studies can be found elsewhere, a brief description of study characteristics can be found in Table 1. All study investigators are continuing to collect follow-up evaluation data on their cohorts. This report includes data available as of October 1994.
Table 1.
Participant characteristics of the six studies analyzed
 |
Glucose tolerance
In all studies, an oral glucose tolerance test (OGTT) was performed at each clinic evaluation, and IGT was defined according to World Health Organization (WHO) criteria [38] as a fasting plasma glucose level of <7.8 mmol/l (<140 mg/dl) and a 2-h postchallenge plasma glucose level of 7.8-11.0 mmol/l (140-199 mg/dl). In all but one study, a 75-g equivalent glucose load (either glucose monohydrate [Nauru only] or anhydrous equivalent [all others]) was used after a requested 12-h (overnight) fast. The BLSA used two doses of glucose: 1) from July 1964 to June 1977, 1.75 gm glucose/kg body wt was given [39], and 2) from 1977 through 1994, 40 g glucose/m2 body surface area was given [40]. Women did not enter the study until 1978 and, therefore, received only the latter dose. The mean glucose dose given to the men in the earlier period averaged 138 g and in the later period men received 79 g and women 67 g. In paired studies on the same male subjects given both doses, the mean difference in the 2-h glucose value was 14 mg/dl, and this value was used as a correction factor for tests given with the larger dose. In the men, 382 of the 2,164 (18%) OGTT results were adjusted.
All but one study had both fasting and 2-h glucose available at each time point. The Pima study measured postchallenge plasma glucose throughout the study, with the addition of fasting plasma glucose after 8 years. (Fasting glucose data were used where available.) IGT was therefore defined for most participants in the Pima study as a 2-h glucose between 7.8-11.0 mmol/l (140-199 mg/dl) without known diabetes. Participants in this analysis included persons who had an OGTT result of IGT at the first clinic evaluation or had normal glucose tolerance at the first clinic evaluation and developed IGT (without developing diabetes in the intervening interval) at a subsequent clinic evaluation. “Baseline” was defined as the first clinic visit at which the subject had IGT. To be included in this analysis, participants also had at least one subsequent OGTT evaluation after the first IGT result.
The epidemiological diagnosis of NIDDM was made according to WHO criteria [38], as a fasting plasma glucose >or= to 7.8 mmol/l (>or= to 140 mg/dl) and/or a 2-h postchallenge glucose >or= to 11.1 mmol/l (>or= to 200 mg/dl), the use of hypoglycemic medications, or a physician diagnosis of NIDDM (RBS only). In the Rancho Bernardo cohort, self-reported physician diagnoses of NIDDM were validated in a subset and were correct >85% of the time. The first diagnosis of NIDDM after the baseline IGT result was defined as the endpoint for the progression from IGT to NIDDM. Because this is a post-hoc comparison of six independent studies, no measures of comparability of laboratory or examination data across centers were available.
Predictors
The potential predictors of the progression from IGT to NIDDM were measured at the baseline evaluation (time of first diagnosis of IGT). Every study had measures of age (years), BMI (kg/m2), and fasting and 2-h postchallenge plasma glucose levels (mg/dl). Although waist circumference and WHR were available for five studies (BLSA, RBS, Nauru, SLVDS, and Pima), two of these studies (Nauru and Pima) had these measures on too few participants for categorization in the incidence rate analysis. A self-reported family history of diabetes (first-degree relatives) was available for four studies (BLSA, RBS, Nauru, and SLVDS), and two studies included more than one ethnic group (SAHS and SLVDS). Differences between the sexes were also compared. Insulin data were not available for this analysis.
Statistical methods
Rates of progression from IGT to NIDDM were computed as incidence density rates, defined as the number of new cases of diabetes per 1,000 person-years of follow-up. The follow-up time for those who progressed to NIDDM assumed the actual time of NIDDM onset was at the midpoint between the last clinical evaluation without NIDDM and the clinic evaluation when NIDDM was diagnosed. For those who did not progress to NIDDM, the follow-up time was defined as the total time between the IGT evaluation and the final available clinic evaluation. Two studies collected data at only two time points (SAHS and RBS); for these studies, IGT was defined only at the first clinic evaluation, and the time to the progression from IGT to NIDDM was defined as half of the time between the baseline and follow-up evaluations. The standard errors of the incidence rates were computed assuming the numbers of cases were distributed as Poisson variables [41].
The incidence rates by category were defined as the total number of participants progressing to NIDDM in the category, divided by the total person-years experienced by everyone in the category. For most continuous variables, the same cut-points were used for all studies to define categories for the computation of incidence rates from IGT to NIDDM, as noted in relevant tables and figures. Because the distributions of waist circumference and WHR varied dramatically between men and women and were quite different across studies, sex-and study-specific quartiles of these variables were used to compute the incidence rates, and the rates were plotted separately for men and women. Results for WHR and waist circumference were nearly identical; therefore, only the WHR results are presented graphically. Baseline measures of fasting and 2-h postchallenge plasma glucose cut-points were chosen to be near the quartile cut-points across all six studies: <5.2 mmol/l (<93 mg/dl), 5.2-5.5 mmol/l (93-99 mg/dl), 5.6-6.0 mmol/l (100-109 mg/dl), and 6.1-7.7 mmol/l (110-139 mg/dl) for fasting plasma glucose; 7.8-8.2 mmol/l (140-149 mg/dl), 8.3-8.8 mmol/l (150-159 mg/dl), 8.9-9.7 mmol/l (160-174 mg/dl), and 9.7-11.0 mmol/l (175-199 mg/dl) for 2-h postchallenge plasma glucose.
Odds ratios (ORs) or relative hazards (RHs) were estimated using logistic regression [42] and Cox proportional hazards regression [43], respectively, to examine the risk of progression to NIDDM according to risk factors. Logistic regression models were used for the two studies with all participants having only two time points (RBS and SAHS), and proportional hazards models were used for the studies with multiple time points (BLSA, Nauru, SLVDS, and Pima). Similarly, logistic regression and proportional hazards regression were used to examine whether BMI predicted progression from IGT to NIDDM after adjustment for baseline age, fasting, and 2-h glucose levels for participants from each study separately and for participants from all studies combined. SAS statistical software version 6.08 (Cary, NC) was used for all analyses [44].
RESULTS
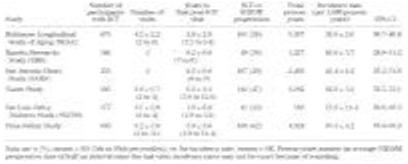
(Table 2) summarizes the participant information and the NIDDM incidence rates for the six studies. There were 2,389 total individuals with IGT followed for 16,775 person-years across all studies. Four studies (BLSA, Nauru, SLVDS, and Pima) each had multiple follow-up visits per participant. These visits took place between 1 and 15 years apart, with the Pima study participants evaluated most frequently and the Nauru participants evaluated least frequently. Two studies (RBS and SAHS) each evaluated participants at baseline and again at a follow-up visit, an average of 8 years apart. The crude percentage progressing from IGT to NIDDM ranged from 23% in the SLVDS to 62% in the Pima study. The overall NIDDM incidence rate (the total number progressing to NIDDM divided by person-years [Table 2]) was 57.2/1,000 person-years and varied more than twofold, from 35.8/1,000 person-years (3.58% per year) in the BLSA to a high of 87.3/1,000 person-years (8.73% per year) in the Pima study.
Table 2.
Summary of studies and cumulative number of NIDDM events in participants with IGT at baseline
 |
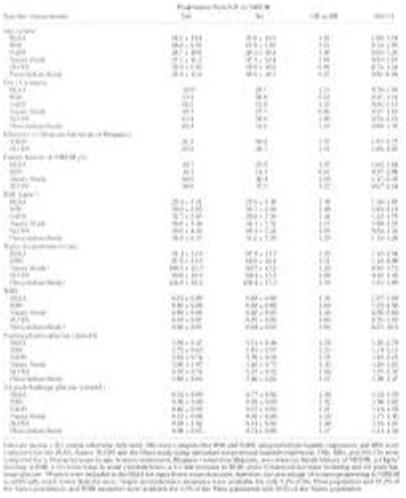
The distribution of baseline risk factors by subsequent progression status and the crude OR or RH by risk factor status and presented in Table 3. Although there was no significant difference in the mean baseline age between those who did and did not progress to NIDDM in five studies, the progressers were younger than the nonprogressers among the Pima participants. Similarly, there was no consistent sex pattern between the progressers and nonprogressers, with women more likely than men to progress to NIDDM in four studies (BLSA, SAHS, SLVDS, and Pima) and less likely in two studies (RBS and Nauru). Among the four studies with an indicator of family history of NIDDM, BLSA and Nauru had a significantly higher proportion with a family history of NIDDM in individuals who progressed than in those who did not. In all studies with available data, the measures of obesity (including BMI, waist circumference, and WHR) were higher among those who progressed to NIDDM than those who did not, although these differences were not always statistically significant. Lastly, in all six studies, significantly higher fasting and 2-h postchallenge glucose levels were observed among individuals who progressed than among those who did not.
Table 3.
Study-specific baseline characteristics by progression from IGT to NIDDM
 |
Study-specific crude incidence rates of NIDDM for risk factor subgroups are displayed in Figure 1, Figure 2, Figure 3. The effect of baseline age on NIDDM incidence rates differed among the studies; the rates did not increase or rose only slightly with increasing baseline age in three of the studies (BLSA, RBS, and SAHS) and formed an inverted U in three studies (Nauru, SLVDS, and Pima), starting low, increasing for several decades, and then declining (Figure 1A). However, NIDDM incidence rates were positively associated with BMI (Figure 1B), WHR (Figure 2), and waist circumference (not shown). When the lower BMI category was divided into those <24 kg/m2 and those 24-27 kg/m2, the sample sizes within the categories were very small; however, the incidence rates between the two lower groups were quite similar (data not shown). When computed separately for men and women, the positive association between incidence of NIDDM and BMI persisted in both sexes (data not shown).
Figure 1.
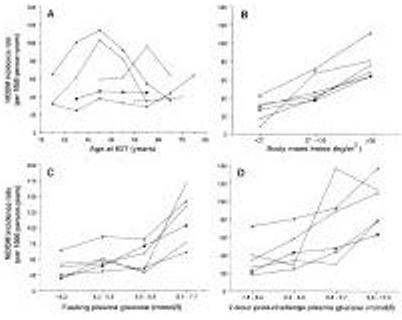
Study-specific NIDDM incidence rates by age (A), BMI (B), fasting plasma glucose concentrations (C), and 2-h postchallenge plasma glucose concentrations (D) at the time of IGT recognition. [square bullet, filled], BLSA; *, Nauru; [shaded triangle], Pima; +, RBS; [square bullet, filled] , SAHS; [circle, open], SLVDS.
Figure 2.
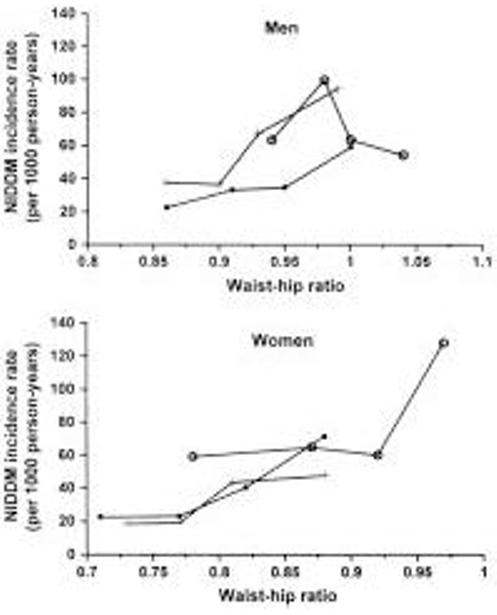
Study-specific NIDDM incidence rates by WHR at time of IGT recognition for men and women. Incidence rates were computed by study-and-sex-specific WHR quartiles and are graphed at the study-and sex-specific quartile means. [square bullet, filled], BLSA; +, RBS; [circle, open], SLVDS.
Figure 3.
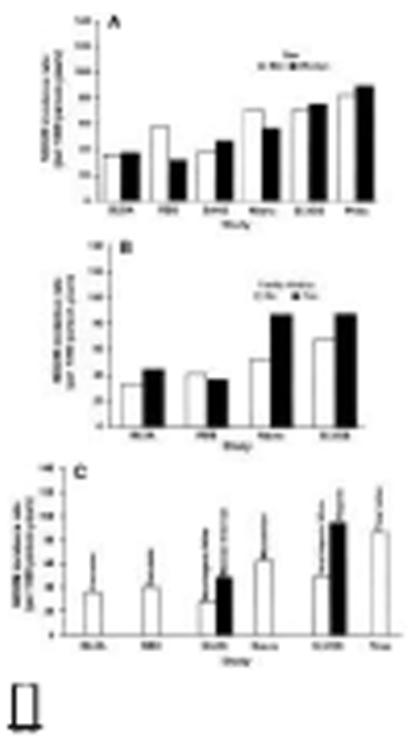
Study-specific NIDDM incidence rates by sex (A), family history of NIDDM (B), and ethnicity (C) at the time of IGT recognition.
NIDDM incidence rates increased slightly with increasing fasting plasma glucose quartile through the lowest three quartiles (<5.2 mmol/l, 5.3-5.5 mmol/l, and 5.6-6.0 mmol/l), but were much higher among those with fasting glucose values in the highest quartile (6.1-7.7 mmol/l) (Figure 1C). However, there was relatively constant increase in the NIDDM incidence rates with increasing 2-h postchallenge glucose quartile in most studies (Figure 1D). Minimal differences in the NIDDM incidence rates were seen between men and women, with rates higher among men for two studies (RBS and Nauru), higher among women for three studies (SAHS, SLVDS, and Pima), and essentially equal in one study (BLSA) (Figure 3A). NIDDM incidence rates tended to be slightly higher in those with a self-reported family history of NIDDM (Figure 3B). In the SAHS and SLVDS, respectively, Mexican-American and Hispanic participants had higher incidence rates than the non-Hispanic white participants in these studies (Figure 3C). Incidence rates were similar for Caucasians from the BLSA and RBS as they were for the non-Mexican-Americans and non-Hispanics from the SAHS and SLVDS.
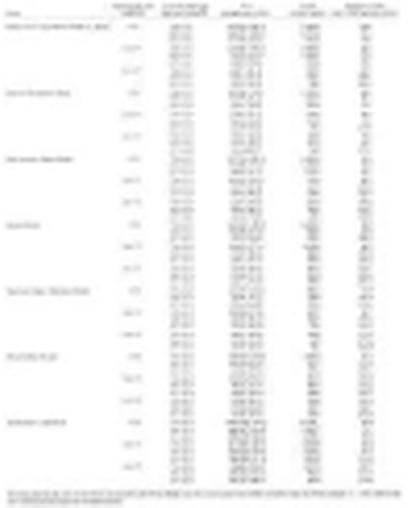
(Table 4) presents the NIDDM incidence rates by category of fasting and 2.h postchallenge glucose levels simultaneously. Fasting and 2-h glucose levels were evaluated for those above the approximate median (5.6 mmol/l fasting and 8.9 mmol/l 2-h postchallenge) and above the upper quartile (6.1 mmol/l fasting and 9.7 mmol/l 2-h postchallenge) of the six studies. Within each fasting glucose category, the NIDDM incidence rate increased with increasing 2-h postchallenge glucose category, with the highest rates in all studies seen among those in the highest quartile of both the fasting and 2-h postchallenge glucose categories.
Table 4.
Study-specific IGT-to-NIDDM progression rates by fasting and 2-h postchallenge glucose levels
 |
Lastly, we examined whether BMI was an independent predictor of the progression from IGT to NIDDM after adjustment for fasting and 2-h postchallenge glucose levels. Variables entered into these models included age, BMI, fasting glucose, 2-h postchallenge glucose, and an indicator variable for each data set. Before and after the adjustment for glucose levels and age, BMI at baseline was a significant predictor of the progression from IGT to NIDDM in the six studies combined (adjusted RH per 4 kg.m2 increase in BMI: 1.13 (95% confidence interval [CI] 1.08-1.19), P < 0.001). When computed separately for each study, increased BMI was associated with substantially increased progression to NIDDM after adjustment for age and glucose in the BLSA (RH 1.31,P = 0.004), RBS (OR 1.48, P = 0.058), and SAHS (OR 1.44, P < 0.001), a moderate increase in Nauru (RH 1.12, P = 0.012), and no increase in the SLVDS (RH 0.95,P = 0.697) or Pima study (RH 1.03, P = 0.549).
DISCUSSION
This analysis examined the major risk factors from six prospective studies for the progression to NIDDM in those individuals with IGT. NIDDM incidence rates for the six analyzed studies varied more than twofold, from a low of 35.8/1,000 persons-years (3.58% per year) in the BLSA to a high of 87.3/1,000 persons-years (8.73% per year) in the Pima population. Similarly, among published studies that used either National Diabetes Data Group (NDDG) or WHO criteria for IGT and NIDDM (20-25,27-31), the overall NIDDM incidence rates varied substantially. In the six cohorts reported here, the diagnostic criteria were nearly identical, and the differences in follow-up time were accounted for using the person-years approach. Most of the published studies examined risk factor associations by comparing the mean or percentage of each risk factor in those progressing from IGT to NIDDM with those not progressing to NIDDM over the study period. Only a few studies have examined progression from IGT to NIDDM by varying levels of risk factors. For this reason, few published studies have examined potential non-linear relationships between risk factors and the progression to NIDDM as we have.
Despite the differences in methods and IGT-to-NIDDM progression rates, the six data sets analyzed in the present study and published studies that used either NDDG or WHO criteria for IGT and NIDDM, found remarkable consistency in the risk factors for progression from IGT to NIDDM. As in the cohorts used for this combined analysis, higher baseline fasting and 2-h postchallenge glucose concentrations were associated with an increased risk of progression to NIDDM in almost all published studies using NDDG or WHO criteria (20-25,27-31). Similarly, several measures of obesity were generally associated with a higher progression rate to NIDDM (20-22,24,25,27,28,30). Sex was not a predictor of progression from IGT to NIDDM in any published study using NDDG or WHO criteria, as incidence rates were similar between men and women in each of the six cohorts included in this analysis. Family history of diabetes was associated with increased progression to NIDDM in only a few of the published [24,31] or analyzed studies. Rates of progression from IGT to NIDDM were substantially higher among the non-Caucasian populations in this analysis.
The only association that varied extensively among the cohorts was the relationship between baseline age and subsequent progression to NIDDM. In one published study, there was a higher NIDDM progression rate among participants identified with IGT at younger ages [24], while other studies found that participants first identified as having IGT at older ages progressed to NIDDM at a higher rate than younger IGT-identified participants [13,23,28]. Among the data sets analyzed here, there was a clear inverse-U relationship between age and the progression from IGT to NIDDM in the populations at highest risk of NIDDM (Pimas, Nauruans, and Hispanics). It has been hypothesized that this pattern in populations at high risk of early NIDDM is due to a strong genetic predisposition to NIDDM [22]. NIDDM may develop at an early age in susceptible persons; after the age of 40 or 50, the the progression rate declines in the older age groups. Two studies (BLSA and RBS) found increasing progression rates from IGT to NIDDM with increasing age, although these were relatively slight increases. These studies tended to have older IGT populations and relatively low overall progression rates. Thus, that the effect of age at IGT on subsequent NIDDM differed among these six populations may reflect the diversity of the populations and the disease in these populations.
In all but one of the published studies (using NDDG or HOW criteria) with family history of diabetes data, as well as two of the four analyzed data sets with data included regarding family history of diabetes, family history was not a significant predictor of subsequent progression to NIDDM. In two studies (BLSA and Nauru), those who progressed to NIDDM were significantly more likely to have a family history of diabetes than those who did not; the incidence rates of the progression to NIDDM were also modestly elevated in those with a family history of diabetes in the BLSA. Overall, a self-reported family history of diabetes does not appear to be as important a risk factor for the development of NIDDM in those with IGT as in those with normal glucose tolerance perhaps reflecting the fact that IGT is already an enriched high risk group. Similarly, in the Pima Indians, parental diabetes (by examination rather than history) was a strong predictor of diabetes among the entire population [37], but not among those with IGT [22].
There is little doubt, from both the published literature [12,14-20,22-31] and this analysis, that the most important predictor of subsequent deterioration from IGT to NIDDM is the level of fasting or postchallenge hyperglycemia at baseline. In this analysis, both fasting and 2-h postchallenge glucose levels were positively associated with the progression to NIDDM. The IGT to NIDDM incidence rates were relatively flat for the lower three quartiles of fasting glucose (<6.1 mmol/l), but were markedly higher in the highest quartile (6.1-7.7 mmol/l), a finding that is probably due to the wide range of glucose concentrations included in this quartile. In contrast, the incidence rates generally increased in a linear manner with increasing quartile of 2-h glucose concentrations. When looked at simultaneously, those in the highest quartile of both fasting and 2-h postchallenge glucose had the highest progression rates.
Several studies have examined whether obesity, usually measured as BMI, predicts the progression from IGT to NIDDM, after the adjustment for baseline glucose levels, with conflicting results. In the Bedford survey, BMI was a significant independent predictor of the progression from IGT to NIDDM during the second five years of follow-up [17], and in Japanese men, maximal weight predicted the progression to 12-year follow-up [19]. However, the Whitehall study [18] and a study of South-African Indians [27] found that the association between BMI and the progression to NIDDM was small and nonsignificant during several follow-up periods. Similarly, a previous analysis of the Nauru population found only a slight (not-quite-significant) direct association between BMI and the progression to NIDDM [20]. In a previous analysis of Pima Indians with IGT, BMI did not predict the progression to NIDDM after the adjustment for baseline glucose and insulin concentrations [22]. Across the six studies combined, BMI was a significant independent predictor of the progression from IGT to NIDDM. When analyzed separately, BMI independently and substantially predicted the progression to NIDDM in three studies (BLSA, RBS, and SAHS), while in one study (Nauru) higher BMI was independently associated with only a slightly increased progression to NIDDM. In the SLVDS and Pima study, BMI did not predict the progression to NIDDM after the adjustment for baseline age and glucose concentrations. It is interesting that BMI was not a strong independent predictors of the progression to NIDDM in the three cohorts with the highest NIDDM incidence rates. However, these populations also are very overweight, which may be why obesity cannot be demonstrated to be a risk factor for the progression to NIDDM in these cohorts.
Although body fat distribution is commonly discussed as a predictor of NIDDM [45,46], to our knowledge only one study, the Hoorn study, has shown that WHR predicts the progression from IGT to NIDDM [28]. Similarly, in each of the four data sets with sufficient waist circumference and WHR data analyzed in this joint analysis, both baseline waist circumference and WHR were consistently associated with the progression to NIDDM. However, the high correlation between BMI and WHR (or waist circumference) may suggest that the risk of future NIDDM in those with IGT is associated with both overall adiposity and truncal obesity.
The published studies using NDDG or WHO criteria and the data sets analyzed for this combined analysis focused only on the major known predictors of NIDDM: age, sex, race and ethnicity, measures of obesity, family history of diabetes, and glucose concentrations. Several studies have reported other factors associated with the incidence of NIDDM in individuals with IGT. In the Niueans [24], increased Westernization and socioeconomic status were related to the progression to NIDDM. This was reflected by those progressing to NIDDM being mostly skilled workers who were inactive in both their occupations and mode of transportation to work and by those who did not progress who were mostly fishermen or farmers who occupation and mode of transportation (walking to work) required high daily activity levels. In addition, those who progressed to NIDDM had a non-significantly higher level of caloric intake at baseline. Several studies have examined the association between baseline blood pressure and IGT-to-NIDDM progression rates. For example, Sartor et al. [15] found that Swedish men had higher diastolic but not systolic blood pressure in those who progressed to NIDDM, and Sigurdsson et al. [16] found that Icelandic men had higher systolic blood pressure at baseline among those who progressed to NIDDM than among those who did not. In a previous analysis of the SLVDS, higher levels of dietary fat intake at baseline in those with IGT predicted the progression to NIDDM, before and after the adjustment for other NIDDM risk factors [47]. Similarly, a prospective study of second-generation Japanese-American men with IGT found that those who progressed to NIDDM after 5 years had a higher intake of calories, animal fat, and cholesterol than those whose glucose tolerance reverted to normal or remained impaired [48]. Insulin measurements were not available for this analysis; however, increased fasting and decreased postchallenge insulin levels measured in those with IGT have been associated with the progression to NIDDM in several previous studies [19,22,25,31,49].
Of the six data sets analyzed in this study, only three had substantial numbers of clinical evaluations every few years for each participant (Pima, SLVDS, and BLSA). It is notable that two of the highest IGT-to-NIDDM incidence rates were found in the studies with multiple evaluations. In each of the studies analyzed, the diagnosis of NIDDM was obtained after only a single OGTT. Studies with frequent evaluations will diagnose NIDDM earlier, biasing these studies to apparently higher incidence. In these studies, participants are evaluated in the clinic frequently and, therefore, have the opportunity to be identified as diabetic before they die, move away, or become too ill to participate. However, the BLSA had the longest and most frequent follow-up, but had the lowest incidence rate observed. Similarly, the Nauru population was reevaluated after a substantial follow-up time (an average of 6 years) yet had a very high incidence rate. Thus, we think the differences in incidence rates are most likely due to true population differences rather than to methodological differences between the studies.
In conclusion, this combined analysis of six prospective studies found that fasting and post-load glucose concentrations and BMI measured at the time of IGT recognition were the most consistent and strongest predictors of the progression from IGT to NIDDM. Despite the strong association between NIDDM and a family history of diabetes, there was no consistent increase in the progression from IGT to NIDDM among those with a family history of diabetes. Similarly, sex was not a predictor of the progression from IGT to NIDDM in any of the six analyzed data sets. The relationship between age and the progression to NIDDM was inconsistent among the study populations. Among studies with the highest NIDDM incidence rates, the progression to NIDDM increased with age among the participants who had IGT at younger ages and decreased with age among those with IGT first recognized at older ages. In contrast, among the studies with lower progression rates, the rates tended to increase with increased age at the time of IGT recognition. Lastly, although BMI was positively associated with the progression to NIDDM in all six cohorts, among the populations with the highest rates of NIDDM, BMI was not associated with NIDDM progression when adjusted for baseline glucose levels.
This analysis indicates that persons with IGT are at high risk of NIDDM and that further assessment of risk can be made by other simple measurements. The ability to identify persons at high risk of NIDDM should facilitate clinical trials in diabetes prevention.
ACKNOWLEDGMENTS
This work was supported in part by the Diabetes Prevention Program National Institutes of Health Grant DK48489. The RBS was supported by NIH Grant DK31801; the SAHS, by NIH Grants HL24799 and HL36820; the SLVDS, by NIH Grant DK30747; and the Nauru study, by NIH Grant DK25446. The Pima Indian Study is conducted by the National Institute of Diabetes and Digestive and Kidney Diseases, and the BLSA is conducted by the National Institute on Aging. The authors gratefully acknowledge the collaboration of the Government of Nauru in the conduct of this study. Special thanks to Dr. John Lachin for his statistical expertise and comments and to Drs. Edward Boyko and Michael Engelgau for their comments.
Glossary
- BLSA
Baltimore Longitudinal Study of Aging
- IGT
impaired glucose tolerance
- NDDG
National Diabetes Data Group
- NHANES II
Second National Health and Nutrition Examination Survey
- OGTT
oral glucose tolerance test
- OR
odds ratio
- RBS
Rancho Bernardo Study
- RH
relative hazard
- SAHS
San Antonio Heart Study
- SLVDS
San Luis Valley Diabetes Study
- WHO
World Health Organization
- WHR
waist-to-hip ratio
REFERENCES
- 1.Harris MI, Hadden WC, Knowler WC, Bennett PH. Prevalence of diabetes and impaired glucose tolerance and plasma glucose levels in U.S. population aged 20-74 yr. Diabetes. 1987;36:523–534. doi: 10.2337/diab.36.4.523. [DOI] [PubMed] [Google Scholar]
- 2.Geiss LS, Herman WH, Goldschmid MG, DeStefano F, Eberhardt MS, Ford ES, German RR, Newman JM, Olson DR, Sepe SJ, Stevenson JM, Vinicor F, Wetterhall SF, Will JC. Surveillance for diabetes mellitus: United States, 1980-1989. Morb Mortal Wkly Rep. 1993;42:1–20. [PubMed] [Google Scholar]
- 3.Kovar MG, Harris MI, Hadden WC. The scope of diabetes in the United States population. Am J Pub Health. 1987;77:1549–1550. doi: 10.2105/ajph.77.12.1549. [DOI] [PMC free article] [PubMed] [Google Scholar]
- 4.Tuomilehto J, Knowler WC, Zimmet P. Primary prevention of non-insulin-dependent diabetes mellitus. Diabetes/Metab Rev. 1992;8:339–353. doi: 10.1002/dmr.5610080403. [DOI] [PubMed] [Google Scholar]
- 5.Knowler WC, Narayan KMV, Hanson RL, Nelson RG, Bennett PH, Tuomilehto J, Schersten B, Pettitt DJ. Preventing non-insulin-dependent diabetes. Diabetes. 1995;44:483–488. doi: 10.2337/diab.44.5.483. [DOI] [PubMed] [Google Scholar]
- 6.American Diabetes Association Screening for diabetes. Diabetes Care. 1990;13:7–9. [Google Scholar]
- 7.Barrett-Connor E. Epidemiology, obesity and non-insulin-dependent diabetes mellitus. Epidemiol Rev. 1989;11:172–181. doi: 10.1093/oxfordjournals.epirev.a036035. [DOI] [PubMed] [Google Scholar]
- 8.Jarrett RJ. Epidemiology and public health aspects of non-insulin-dependent diabetes mellitus. Epidemiol Rev. 1989;11:151–171. doi: 10.1093/oxfordjournals.epirev.a036034. [DOI] [PubMed] [Google Scholar]
- 9.Everhart JE, Knowler WC, Bennett PH. In National Diabetes Data Group: Diabetes in America; U.S. Government Printing Office; Washington, DC: Incidence and risk factors for non-insulin-dependent diabetes. 1985(NIH Publication No. 85-1468)
- 10.O’Sullivan JB, Mahan CM. Blood sugar levels, glycosuria and body weight related to development of diabetes mellitus. JAMA. 1965;194:117–122. [PubMed] [Google Scholar]
- 11.Harris MI. Impaired glucose tolerance in the U.S. population. Diabetes Care. 1990;12:464–474. doi: 10.2337/diacare.12.7.464. [DOI] [PubMed] [Google Scholar]
- 12.O’Sullivan JB, Mahan CM. Prospective study of 352 young patients with chemical diabetes. N Engl J Med. 1968;278:1038–1041. doi: 10.1056/NEJM196805092781904. [DOI] [PubMed] [Google Scholar]
- 13.Kobberling J, Kattermann R, Arnold A. Follow-up of “non-diabetic” relatives of diabetics by retesting oral glucose tolerance after 5 years. Diabetologia. 1975;11:451–456. doi: 10.1007/BF00429915. [DOI] [PubMed] [Google Scholar]
- 14.Jarrett RJ, Keen H, Fuller JH, McCartney M. Worsening to diabetes in men with impaired glucose tolerance (“borderline diabetes”) Diabetologia. 1979;16:25–30. doi: 10.1007/BF00423146. [DOI] [PubMed] [Google Scholar]
- 15.Sartor G, Schersten B, Carlstrom S, Melander A, Norden A, Persson G. Ten-year follow-up of subjects with impaired glucose tolerance: prevention of diabetes by tolbutamide and diet regulation. Diabetes. 1980;29:41–49. doi: 10.2337/diab.29.1.41. [DOI] [PubMed] [Google Scholar]
- 16.Sigurdsson G, Gottskalksson G, Thorsteinsson T, Davidsson D, Olafsson O, Samuelsson S, Sigfusson N. Community screening for glucose intolerance in middle-aged Icelandic men. Acta Med Scand. 1981;210:21–26. doi: 10.1111/j.0954-6820.1981.tb09770.x. [DOI] [PubMed] [Google Scholar]
- 17.Keen H, Jarrett RJ, McCartney P. The ten-year follow-up of the Bedford survey (1962-1972): glucose tolerance and diabetes. Diabetologia. 1982;22:73–78. doi: 10.1007/BF00254832. [DOI] [PubMed] [Google Scholar]
- 18.Jarrett RJ, Keen H, McCartney P. The Whitehall Study: ten year follow-up report on men with impaired glucose tolerance with reference to worsening to diabetes and predictors of death. Diabetic Med. 1984;1:279–283. doi: 10.1111/j.1464-5491.1984.tb01973.x. [DOI] [PubMed] [Google Scholar]
- 19.Kadowaki T, Miyake Y, Hagura R, Akanuma Y, Kajinuma H, Kuzuya N, Takaku F, Kosaka K. Risk factors for worsening to diabetes in subjects with impaired glucose tolerance. Diabetologia. 1984;26:44–49. doi: 10.1007/BF00252262. [DOI] [PubMed] [Google Scholar]
- 20.King H, Zimmet P, Raper LR, Balkau B. The natural history of impaired glucose tolerance in the Micronesian population of Nauru: a six-year follow-up study. Diabetologia. 1984;26:39–43. doi: 10.1007/BF00252261. [DOI] [PubMed] [Google Scholar]
- 21.Ramachandran A, Snehalatha C, Naik RAS, Mohan V, Shobana R, Viswanathan M. Significance of impaired glucose tolerance in an Asian Indian population: a follow-up study. Diabetes Res Clin Pract. 1986;2:173–178. doi: 10.1016/s0168-8227(86)80019-5. [DOI] [PubMed] [Google Scholar]
- 22.Saad MF, Knowler WC, Pettitt DJ, Nelson RG, Mott DM, Bennett PH. The natural history of impaired glucose tolerance in the Pima Indians. N Engl J Med. 1988;319:1500–1506. doi: 10.1056/NEJM198812083192302. [DOI] [PubMed] [Google Scholar]
- 23.Schranz AG. Abnormal glucose tolerance in the Maltese: a population-based longitudinal study of the natural history of NIDDM and IGT in Malta. Diabetes Res Clin Pract. 1989;7:7–16. doi: 10.1016/0168-8227(89)90038-7. [DOI] [PubMed] [Google Scholar]
- 24.Tukuitonga CP. Progress of impaired glucose tolerance to diabetes mellitus among Niueans. NZ Med J. 1990;103:351–353. [PubMed] [Google Scholar]
- 25.Charles MA, Fontbonne A, Thibult N, Warnet JM, Rosselin GE, Eschwege E. Risk factors for NIDDM in white population: Paris prospective study. Diabetes. 1991;40:796–799. doi: 10.2337/diab.40.7.796. [DOI] [PubMed] [Google Scholar]
- 26.Yamada T, Aizawa T, Nagasawa Y, Ishihara M, Komatsu M, Komiya I, Shinoda T, Takasu N. Ten-year follow-up of Japanese overweight subjects with impaired glucose tolerance: identification of a diabetes-prone subpopulation. Intern Med. 1992;31:877–884. doi: 10.2169/internalmedicine.31.877. [DOI] [PubMed] [Google Scholar]
- 27.Motala AA, Omar MAK, Gouws E. High risk of progression to NIDDM in South-African Indians with impaired glucose tolerance. Diabetes. 1993;42:556–563. doi: 10.2337/diab.42.4.556. [DOI] [PubMed] [Google Scholar]
- 28.Nijpels G, Popp-Snijders C, Bouter LM, Heine RJ. The natural history of impaired glucose tolerance: the Hoorn Study (Abstract) Diabetologia. 1994;37(Suppl 1):A26. doi: 10.1007/BF00400421. [DOI] [PubMed] [Google Scholar]
- 29.Sosenko JM. A prospective study of the progression of IGT to NIDDM (Abstract) Diabetes. 1994;43(Suppl 1):212A. [Google Scholar]
- 30.Rios JM, Gomez R, Roman V, Villa A, Berez-E B, Gomez-Perez F, Rull JA. High rate of progression of impaired glucose tolerance to diabetes in a genetically susceptible population (Abstract) Diabetes. 1995;44(Suppl 1):184A. [Google Scholar]
- 31.Kahn SE, Leonetti DL, Prigeon RL, Boyko EJ, Bergstrom RW, Fujimoto WY. Proinsulin as a marker for the development of NIDDM in Japanese-American men. Diabetes. 1995;44:173–179. doi: 10.2337/diab.44.2.173. [DOI] [PubMed] [Google Scholar]
- 32.Shimokata H, Muller DC, Fleg JL, Sorkin J, Ziemba AW, Andres R. Age as independent determinant of glucose tolerance. Diabetes. 1991;40:44–51. doi: 10.2337/diab.40.1.44. [DOI] [PubMed] [Google Scholar]
- 33.Wingard DL, Barrett-Connor EL, Scheidt-Nave C, McPhillips JB. Prevalence of cardiovascular and renal complications in older adults with normal or impaired glucose tolerance or NIDDM: a population-based study. Diabetes Care. 1993;16:1022–1025. doi: 10.2337/diacare.16.7.1022. [DOI] [PubMed] [Google Scholar]
- 34.Haffner SM, Stern MP, Mitchell BD, Hazuda HP, Patterson JK. Incidence of type II diabetes in Mexican Americans predicted by fasting insulin and glucose levels, obesity and body fat distribution. Diabetes. 1990;39:283–288. doi: 10.2337/diab.39.3.283. [DOI] [PubMed] [Google Scholar]
- 35.Dowse GK, Zimmet PZ, Finch CF, Collins VR. Decline in incidence of epidemic glucose intolerance in Nauruans: implications for the “Thrifty Genotype.”. Am J Epidemiol. 1991;133:1093–1104. doi: 10.1093/oxfordjournals.aje.a115822. [DOI] [PubMed] [Google Scholar]
- 36.Hamman RF, Marshall JA, Baxter J, Kahn LR, Mayer EJ, Orleans M, Murphy JR, Lezotte DC. Methods and prevalence of non-insulin-dependent diabetes mellitus in a biethnic Colorado population: the San Luis Valley Diabetes Study. Am J Epidemiol. 1989;129:295–311. doi: 10.1093/oxfordjournals.aje.a115134. [DOI] [PubMed] [Google Scholar]
- 37.Knowler WC, Pettit DJ, Saad MF, Bennett PH. Diabetes mellitus in the Pima Indians: incidence, risk factors and pathogenesis. Diabetes Metab Rev. 1990;6:1–27. doi: 10.1002/dmr.5610060101. [DOI] [PubMed] [Google Scholar]
- 38.World Health Organization . Diabetes Mellitus: Report of a WHO Study Group. World Health Organization; Geneva: 1985. [PubMed] [Google Scholar]
- 39.Fajans SS. Diagnostic tests for diabetes mellitus. In: Williams RH, editor. Diabetes. Paul B. Hoeber Inc.; New York: 1960. pp. 397–399. [Google Scholar]
- 40.Committee on Statistics of the American Diabetes Association Standardization of the oral glucose tolerance test. Diabetes. 1969;18:299–310. doi: 10.2337/diab.18.5.299. [DOI] [PubMed] [Google Scholar]
- 41.Knowler WC, Bennett PH, Hamman RF, Miller M. Diabetes incidence and prevalence in Pima Indians: a 19-fold greater incidence than in Rochester, Minnesota. Am J Epidemiol. 1978;108:497–505. doi: 10.1093/oxfordjournals.aje.a112648. [DOI] [PubMed] [Google Scholar]
- 42.Hosmer DW, Lemeshow S. Applied Logistic Regression. John Wiley and Sons; New York: 1989. [Google Scholar]
- 43.Cox DR, Oakes D. Analysis of Survival Data. London, Chapman and Hall: 1984. [Google Scholar]
- 44.SAS Institute Inc. SAS/STAT User’s Guide, Version 6. 4th ed. SAS Institute Inc.; Cary, NC: 1989. [Google Scholar]
- 45.Ohlson LO, Larsson B, Svardsudd K, Welin L, Eriksson H, Wilhelmsen L, Bjorntorp P, Tibblin G. The influence of body fat distribution on the incidence of diabetes mellitus: 13.5 years of follow-up of the participants in the study of men born in 1913. Diabetes. 1985;34:1055–1058. doi: 10.2337/diab.34.10.1055. [DOI] [PubMed] [Google Scholar]
- 46.Warne DK, Charles MA, Hanson RL, Jacobsson LTH, McCance DR, Knowler WC, Pettitt DJ. Comparison of body size measurements as predictors of NIDDM in Pima Indians. Diabetes Care. 1995;18:435–439. doi: 10.2337/diacare.18.4.435. [DOI] [PubMed] [Google Scholar]
- 47.Marshall JA, Shetterly S, Hoag S, Hamman RF. Dietary fat predicts conversion from impaired glucose tolerance to NIDDM: the San Luis Valley Diabetes Study. Diabetes Care. 1994;17:50–56. doi: 10.2337/diacare.17.1.50. [DOI] [PubMed] [Google Scholar]
- 48.Tsunehara CH, Leonetti DL, Fujimoto WY. Animal fat and cholesterol intake is high in men with IGT progression to NIDDM (Abstract) Diabetes. 1991;40(Suppl 1):427A. [Google Scholar]
- 49.Haffner SM, Miettinen H, Gaskill SP, Stern MP. Decreased insulin secretion and increased insulin resistance are independently related to the 7-year risk of non-insulin dependent diabetes mellitus in Mexican Americans. Diabetes. 1995;44:1386–1391. doi: 10.2337/diab.44.12.1386. [DOI] [PubMed] [Google Scholar]


