Abstract
We have designed and built an inexpensive, high-resolution, tomographic imaging system, dubbed the multi-module, multi-resolution system, or M3R. Slots machined into the system shielding allow for the interchange of pinhole plates, enabling the system to operate over a wide range of magnifications and with virtually any desired pinhole configuration. The flexibility of the system allows system optimization for specific imaging tasks and also allows for modifications necessary due to improved detectors, electronics, and knowledge of system construction (e.g., system sensitivity optimization). We provide an overview of M3R, focusing primarily on system design and construction, aperture construction, and calibration methods. Reconstruction algorithms will be described and reconstructed images presented.
Keywords: small, animal SPECT, hardware optimization, pinhole apertures, multi-pinhole apertures
I. INTRODUCTION
The range and breadth of small-animal imaging studies associated with molecular imaging are rapidly growing1,2 and an increasing number of imaging systems have been built in response to this growth.3–8 Many laboratories would benefit from access to a relatively inexpensive, high-resolution, small-animal SPECT imager. We believe M3R may serve as a prototype for such a system.
In general, an imaging system maps a continuous object f(r) to a discrete data vector g via the imaging equation
| (1) |
where ℋ is a continuous-to-discrete (CD) operator representing the imaging system, n is the noise, and bold symbols denote vectors. One of our goals is to objectively determine the best ℋ (e.g., optimum magnification and pinhole configuration). Note that g is not an image for tomographic systems. Generally, a reconstruction step, represented by the operator ℴ, is required to produce an image θ, where θ = ℴ(g).
To properly optimize an imaging system, one must first identify a relevant task to be performed and then determine a figure of merit by which to measure the ability of the system to perform that task.9 Tasks are often separated into two types: classification and estimation. In classification tasks, the observer is categorizing an image into one of a finite number of possible outcomes. One example is where there are two possible outcomes: signal plus background (lesion present) or background alone (lesion absent). For estimation tasks, the observer is attempting to quantify some particular image parameter, such as tumor size. M3R fulfills the imaging needs for many biomedical imaging tasks of both types. In addition, M3R allows the user to tailor ℋ to optimize system performance for a specific task.
The remainder of the paper is structured as follows. Section II describes the design and construction of M3R and its associated pinhole apertures. Section III discusses the procedures we employ to calibrate the instrument. Section IV introduces reconstruction methods and presents a gallery of images obtained using M3R. The final section outlines ongoing and future projects centered around M3R and provides a brief discussion of system capabilities and conclusions.
II. DESIGN AND CONSTRUCTION
A. System shielding and assembly
The desire to perform objective system optimization led to the design of a four-camera SPECT imaging system capable of operating at several different magnifications and with nearly any desired pinhole structure. Each of the four cameras in the system has its own set of slots, meaning that four unique apertures may be used at any time. Different combinations of these apertures (i.e., single cameras, combinations of two or three cameras, or all four cameras) yield 15 possible simultaneous aperture configurations. Cerrobend® was chosen as the construction material for the body of the imaging system. The composition of Cerrobend is 50% bismuth, 26.7% lead, 13.3% tin, and 10% cadmium. The density of Cerrobend is 9.38 g/cm3 and its linear attenuation coefficient is ~19.0 cm−1 at 140 keV. It possesses several characteristics making it a more attractive shielding material than alternatives such as lead and tungsten. It provides the necessary attenuation, machines easily, is inexpensive, and has a melting point of only 58° C. Its workability allowed us to do much of the casting and machining in our own shop. Grooves were machined into the base and lid of the structure so that the notched support columns lock into place. This feature provided added stability while also insuring a gamma-ray-tight structure; background count rates typically hover around 20 counts per second. Additionally, an aluminum plate and handle were affixed to the lid of the structure to allow for easy removal. The central area of the structure accommodates mice and phantoms while holes in the base and lid allow for access to load and manipulate these objects.
Four modular scintillation cameras manufactured to our specifications by Scionix of the Netherlands are used in M3R. Each camera has a 117 mm2, 5 mm thick sodium iodide crystal, 8 mm thick light guide, and nine 38 mm Hamamatsu R980 photomultiplier (PMT) tubes. Each camera is individually housed in a laminated lead and aluminum shielding and abuts one port on the M3R aperture as shown in Fig. 1. Other components of the system include an (x, y, z) translation stage used for calibration procedures, a rotation stage used for tomographic data acquisition, front-end and back-end electronics, and power supplies for both the electronics and cameras.
Fig. 1.
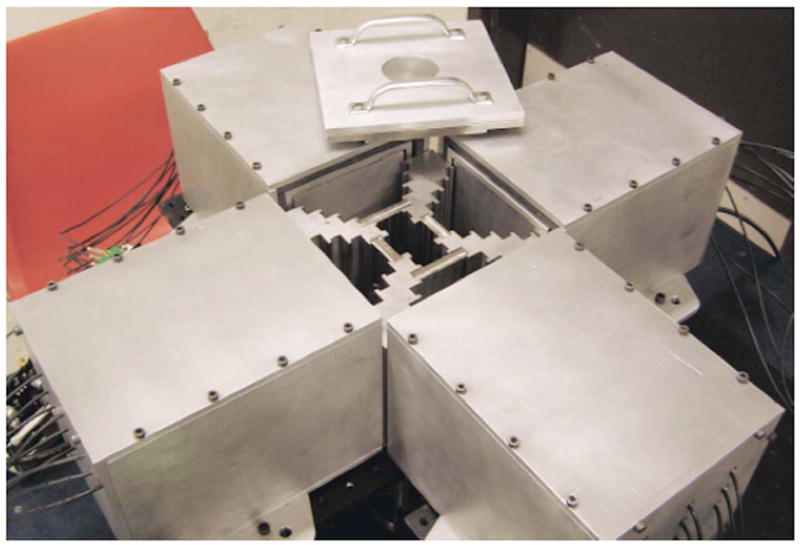
M3R with scintillation cameras in place and the lid removed. Each camera is individually shielded with lead. As shown, two plates are in the highest magnification position (m=3.33) and two plates are in the second-highest magnification position (m=1.6). Cables running from the PMTs to the electronics are visible.
B. Aperture construction
As shown in Figs. 2(a) and 2(b), there are five pinhole plate slots for each camera, providing for either magnification or minification depending on slot selection. Several pinhole plates have been manufactured for initial use in the system. Their properties—including number of pinholes, magnification, diameter, sensitivity (relative to the most sensitive plate), and construction material—are shown in Table I. The plates contain anywhere from one to nine pinholes ranging in diameter from 0.25 to 1 mm and having opening angles ranging from 60° to 85°.
Fig. 2.
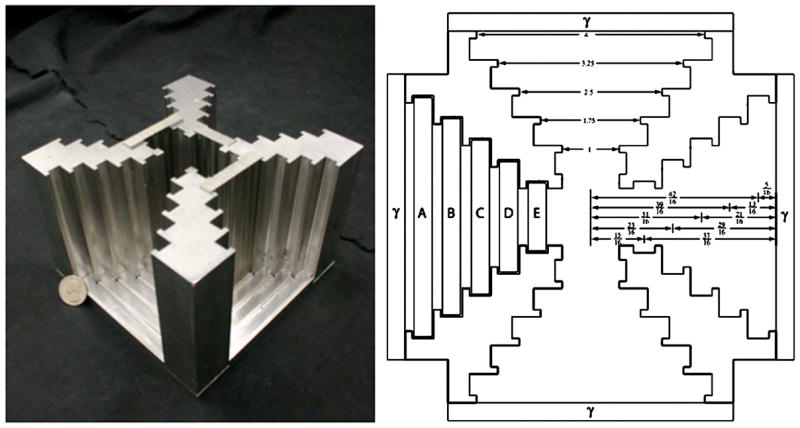
(a) The M3R shielding aperture and base with three pinhole plates in place. Cameras abut each of the four ports and a lid locks onto the top of the assembly. (b) A top view of the shielding assembly design. Example pinhole plates are shown on the left side of the figure and a representation of a gamma camera is shown at each port. Distances given are in inches.
Table I.
Pinhole plates built for M3R. The table includes magnification, number of pinholes, pinhole diameter, opening angle, pinhole pattern, sensitivity, (normalized to the most sensitive aperture), and material where Ku stands for Kulite and W-Cu stands for tungsten-copper. The apertures have been numbered for reference later in the manuscript.
| Aperture no. | Magnification | No. | Diameter (mm) | Sensitivity | Angle (deg) | Material |
|---|---|---|---|---|---|---|
| 1 | 1.60 | 5 | 1 | 0.65 | 85.4 | Ku |
| 2 | 3.33 | 1 | 1 | 0.34 | 85.4 | Ku |
| 3 | 1.60 | 1 | 1 | 0.10 | 85.4 | Ku |
| 4 | 3.33 | 4 | 1 | 1.00 | 85.4 | Ku |
| 5 | 2.47 | 9 | 0.25 | 0.05 | 60.0 | W-Cu |
| 6 | 3.33 | 1 | 0.5 | 0.20 | 75.0 | W-Cu |
| 7 | 2.47 | 4 | 0.5 | 0.52 | ~70.0 | W-Cu |
While virtually any pinhole pattern may be reasonably applied to an M3R pinhole aperture, a discrete set of magnifications naturally arises because the plates sit in slots. Although it is possible to machine pinholes at various depths in a plate, it is easiest to place pinholes at either one face of the plate or in the plate center. For this reason, there are a few specific magnifications most typically associated with M3R. These magnifications and their corresponding slots are described in Table II. Note that plates placed in the remaining slots are possible and would result in minification.
Table II.
Magnifications typically used in M3R and their corresponding slots and location on the pinhole plate. Other magnifications are possible but not typically used because of construction considerations.
| Magnification | Slot | Pinhole location |
|---|---|---|
| 3.33 | 1 | Front face |
| 2.47 | 1 | Center |
| 1.89 | 1 | Back face |
| 1.60 | 2 | Front face |
| 1.26 | 2 | Center |
| 1.00 | 2 | Back face |
Two materials were used for the different pinhole apertures. The first material used was K1700, a Kulite® tungsten alloy containing 90% tungsten by weight. It has a density of 17 g/cm3 and the alloy materials include iron, copper, and nickel (percentages not available).10 Assuming equal parts by weight of iron, nickel, and copper, the linear attenuation coefficient at 140 keV is ~29.2 cm−1. The second material used for aperture construction was a tungsten-copper (80/20 by weight) alloy with a density of ~14.91 g/cm3 and a linear attenuation coefficient at 140 keV of ~23.1 cm−1.
The initial set of aperture plates created for M3R contained only on-axis 1 mm pinholes. These apertures were made in Kulite and all pinholes were machined on a plate face. They were used to perform preliminary studies involving 2D signal detection11 and the first measured M3R system matrices. The results indicated the potential gain in using cameras of different magnifications and pinhole configurations for signal detection. This hard material required the use of an array of countersinks for gradual material removal before finishing with a 1 mm drill bit. Aperture 1 is pictured in Fig. 3(a) and a measured projection image of a point source acquired with this aperture is shown in Fig. 4(a).
Fig. 3.

(a) Aperture 1 made out of Kulite with five on-axis 1 mm pinholes on the face of the plate. (b) Aperture 5 made out of 80/20 tungsten-copper alloy with nine on-axis 0.25 mm pinholes in a gold foil in the center of the plate. (c) Aperture 7 made out of 80/20 tungsten-copper alloy with four angled 0.5 mm pinholes in a rotated diamond pattern in press-fit 80/20 tungsten-copper rods.
Fig. 4.
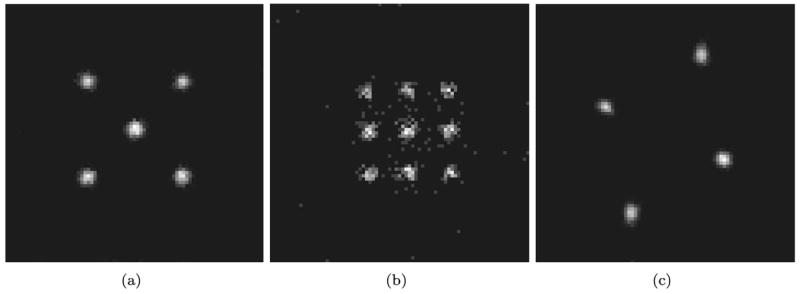
(a) Measured projection of a point signal through aperture 1. (b) Measured projection of a point signal through aperture 5. (c) Measured projection of a point signal through aperture 7.
More sophisticated machining techniques were developed for other M3R apertures. One aperture that required specialized construction methods was the nine pinhole, 0.25 mm diameter aperture. The procedure began by registering two plates with precision dowel pins. Once registered, the plate edges were squared and surfaced as a unit and counter-sink screws were added. The plates were separated and a small (19 μm deep), square depression was cut into the inside face of one of the plates. Countersinks were machined into the outer face of each plate at the pinhole locations. A small (20 μm thick) gold foil was inserted into the square depression between the plates and they were reattached. A 0.25 mm drill bit was used to penetrate the gold foil and create a keel edge. This aperture is pictured in Fig. 3(b) and a measured projection image of a point source acquired with this aperture is shown in Fig. 4(b).
Another aperture to require specialized techniques was the four-pinhole, 0.5 mm diameter aperture. The pinholes in this aperture are arranged in a skew diamond pattern rotated at 22.5°. Further, each pinhole is angled towards the center of object space and the diamond is narrower than it is tall to maximize sensitivity to the object space while minimizing sensitivity to out-of-field activity. Different keel edge lengths were used for pinholes along the long axis and short axis of the diamond to aid in this sensitivity tailoring. Angled clearance holes were placed in a rectangular tungsten-copper blank and pinholes were machined into a 0.5 in. tungsten-copper rod. The cylindrical pinhole rod sections were press-fit into the clearance holes. The faces of the plate were surfaced to remove excess rod material. This aperture is pictured in Fig. 3(c) and a measured projection image of a point source acquired with this aperture is shown in Fig. 4(c).
III. CALIBRATION
A. Mean detector response function
When a gamma-ray photon strikes the scintillation crystal at the entrance face of the camera, the photoelectric effect transfers the energy of the gamma ray to an electron, which then interacts with the scintillator to produce a cascade of relatively low energy photons.12 These photons pass through a light guide whose purpose is to allow the photons to be distributed more widely across the PMTs. The process of using these PMT outputs to point to a location of photoelectric interaction within the scintillator is known as position estimation. We employ a statistical approach to position estimation, taking advantage of the Poisson nature of the processes involved.9 The processes through which an incident gamma ray is transformed into a set of PMT signals are described in a maximum-likelihood sense by the scaled Poisson model given by
| (2) |
where k is the PMT number, ℴk is the nearest integer to the quotient of voltage divided by gain for the kth PMT (resulting in units of photoelectrons) produced by the incident gamma ray, and n̄k is the mean number of photoelectrons incident on the kth PMT for a gamma ray incident at pixel (x, y). With the assumption that PMT gain noise is zero-mean, the mean of ℴk is equal to the mean number of photoelectrons n̄k and may be substituted into the above expression.
The likelihood expression often becomes more manageable following monotonic transformation. In this case, the transformation used is the natural logarithm and the resulting expression is known as the log likelihood. Our modular cameras contain nine PMTs (K=9). The final log likelihood expression [found by taking the log of Eq. (2)] for the ML position estimation is given by
| (3) |
where ℴk is the PMT output of the kth PMT for the event in question, o is a nine-vector composed of the ℴk, and ℴ̄k(x, y) is the mean PMT output divided by gain for the kth PMT at a given location on the camera face (x, y).
The task in ML position estimation is finding the (x, y) that maximizes the log-likelihood λ(x, y). The (x, y) that maximizes the likelihood represents the most likely point of incidence on the camera face for the gamma ray in question. Note that the ℴk! term may be neglected as it is constant [not dependent on (x, y)] for any given event but is required when applying filtering techniques such as likelihood windowing.13 The ML estimation process is repeated for every event acquired in an exposure and a projection image is constructed by binning each event into its proper location on the camera face.
The mean detector response function (MDRF) is a matrix containing the mean PMT outputs ō(x, y) for a collection of (x, y) points on the camera face. The process of collecting the MDRF involves stepping a collimated source in a uniform grid over the camera face.14 A typical MDRF will consist of a 79×79 grid covering the camera face in 1.5 mm steps. At each point on the grid, the nine PMT output values are stored for each of 5000 events. A mean file is generated (containing the values used in the above log-likelihood expression) by finding the average PMT output values for each of the points on the grid.
To generate images, ML position-estimation methods are applied to list-mode data using a contracting grid-search algorithm.15 This technique enables rapid position estimation (over 60 000 events per second with likelihood windowing on an Apple G5 processor) and is currently being developed in hardware for real-time position estimation. ML position estimation techniques allow more complete use of the camera face, which is particularly important for modular scintillation cameras.
B. System matrix
In practice, it is necessary to generate a discrete-to-discrete (DD) matrix approximation H of the CD operator ℋ introduced in Eq. (1). This matrix approximation is generated through a calibration procedure we refer to as a PSF measurement and modifies the imaging equation to
| (4) |
where the dimension of g is the product of the MDRF dimension M, the number of cameras C, and the number of angles A. The dimension of f is N×1, where N is the number of voxels measured during the PSF. The dimension of H is then MCA×N. The term PSF is used because an approximate point source is stepped through object space and the response of the system to the source is recorded at every location.14 However, because we are measuring the response of a system that is linear but not shift-invariant, the term PSF does not imply a true point-spread function.9
The preparation of a point-like source marks the first step in a typical PSF run. In order to construct a source that is both subresolution (what we are considering point-like) and strong enough to deliver a large number of counts per second for the duration of the PSF measurement, a collection of 100–150 μm chromatographic beads is saturated with source and carefully epoxied to the tip of a slender carbon fiber rod. The source is scanned in object space over a cubic lattice with a cylindrical support region, taking small (e.g., 0.9 mm) steps and acquiring a predetermined number of events (e.g., 5000) at each location. The response of the system to the source is recorded in list-mode at each point in object space. This collection of data, following position estimation, represents the PSF of the system.
The number of events collected at each location is limited by the half-life of the point source and the desired number of measured PSF voxels. An improvement in noise statistics results from increased exposure time at each voxel, but a more thorough characterization of the system response to the object space is gained by increasing the number of measured voxels.
The resulting measured PSF has dimensions of MC×N. A typical PSF for M3R would cover a cylindrical object space measuring 30 mm in diameter and 40 mm in height. Measured in 0.9 mm steps, N=41 888 voxels in this object space. With C=4 and M =792, the overall PSF would be a matrix of dimensions 24 964×41 888. One way to visualize the PSF conceptually is to consider the matrix for a single camera. Each column of the single-camera PSF represents the detector response (which can be viewed as a projection image) to source in a different voxel in object space. Each row of the single-camera PSF represents the response of a single pixel in the detector to the point source as it moves through space. This response can be viewed as a cone of sensitivity, originating at the detector and passing through the pinhole out into object space.
Note that the PSF pertains to only one angle while the H matrix represents the system response for every camera to every point in object space over all angles. Therefore, the final H matrix has dimensions of MCA×N, where A is the number of angles. Even with a reasonable number of angles, such as A=40, the final H matrix would contain nearly 30 billion elements. Fortunately, the H matrix is also quite sparse, a trait that we take full advantage of when reconstructing.
The measurement of the PSF represents a limitation to the rapidity with which the M3R system configuration may be modified. A typical PSF requires 12–24 h for completion depending on source activity and voxel spacing. Image processing code handles the position estimation and interpolation steps in 3–6 h. A subtle point in PSF acquisition for M3R arises due to disparity in aperture sensitivity. Because we collect events for all cameras over identical time intervals, the number of counts collected for each camera will be proportional to that aperture’s sensitivity. The acquisition time is set to insure adequate collection of counts on the least sensitive aperture. Therefore, the higher-sensitivity apertures will acquire more counts and, thus, have better noise statistics in their PSF.
IV. IMAGING
A. Reconstruction
Whereas most clinical systems rotate the imaging apparatus around the object, in small-animal SPECT, it is sometimes more convenient to rotate the object while keeping the imaging system stationary. M3R utilizes the latter form of movement, employing a rotary stage situated underneath the system assembly. It should be noted that the next generation M3R-like system will be oriented horizontally and the system will be rotated as opposed to the object. Maximum-likelihood expectation maximization (MLEM) algorithms and ordered-subset MLEM (OSEM) have been used to reconstruct image data. The MLEM equation is given by
| (5) |
where θ̂(k) is the kth iteration of the estimate of the original object, s is the system sensitivity, g is the projection data, and H is the system matrix. In OSEM, the angles are split into uniform subsets, and the estimate of the object is updated after processing each subset of angles.
B. Interpolation and postprocessing
As described above, we directly measure system response. The obvious advantage of such an approach is that it provides a real representation of the system’s response to source emissions from various points in object space, compensating for camera imperfections, mechanical tolerances, and pinhole penetration. However, several obstacles exist that complicate the PSF acquisition procedure. Challenges include the preparation of a truly point-like source, mechanical issues in moving the source through all of object space quickly and stably, and the large data volumes.
One possible method by which to minimize these obstacles is through interpolation. The acquisition of the PSF only becomes difficult when the response to a large number of points in object space is required. However, we have found that the response to this large number of points can be estimated from a PSF consisting of values measured on a much sparser grid. Further, a sparser grid of points in object space enables the point source to remain at each point for a longer period of time, resulting in a less noisy PSF.
At least two techniques currently exist for single-pinhole PSF interpolation.14 However, neither of these techniques extend well to multiple-pinhole geometries. In order to overcome these difficulties, code was written to split out individual pinhole projections from the multiple-pinhole PSFs. By using the system geometry to predict projection locations for each pinhole, we were able to separate the projections of individual pinholes in a multiple-pinhole PSF. The individual pinhole projections were interpolated using the single-pinhole techniques. The resulting interpolated single-pinhole PSFs were then recombined to form the interpolated multiple-pinhole PSF.
The first object reconstructed was a hot-rod resolution phantom similar to the micro Jaszczak phantom. The phantom consists of a series of columns ranging in diameter from 1.7 to 1.2 mm, decreasing in 0.1 mm steps. A cluster of columns exists for each diameter, and the center-to-center spacing for adjacent columns is twice the diameter of the columns in that particular cluster as shown in Fig. 5. Data were collected from this hot rod phantom using apertures 1, 2, 4, and 5 listed in Table I. Reconstructions shown are from experimental data with apertures 2 and 4 having ~40 000 and ~90 000 counts per projection (after likelihood windowing) respectively. The reconstruction parameters used to generate the images in Figs. 6 and 7 include 80 angles (rotational steps of the object) organized into eight subsets for OSEM with 25 iterations (for a total of 200 updates).
Fig. 5.
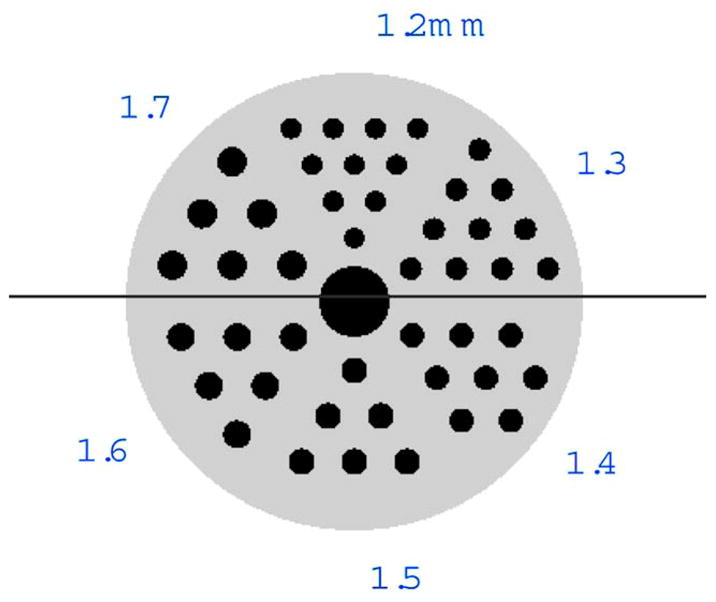
Hot-rod phantom used in the reconstruction study. The phantom consists of clusters of columns ranging in diameter from 1.7 to 1.2 mm, decreasing in 0.1 mm steps. Each column in a given cluster is separated by two times the diameter of that cluster’s columns.
Fig. 6.
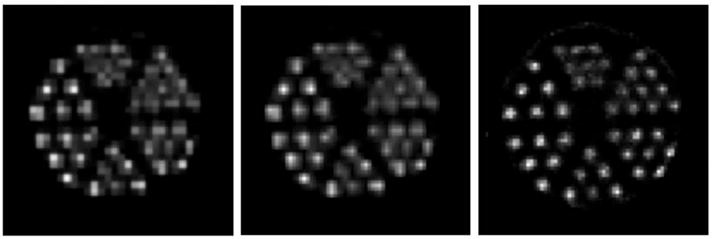
(a) Slice of an OSEM reconstruction of the hot-rod phantom performed using original H matrix. (b) The same reconstructed slice as is shown in (a) but interpolated in postprocessing to match the dimensions of a reconstruction performed using an interpolated system matrix. (c) The same reconstructed slice but from a reconstruction performed using the interpolated system matrix.
Fig. 7.
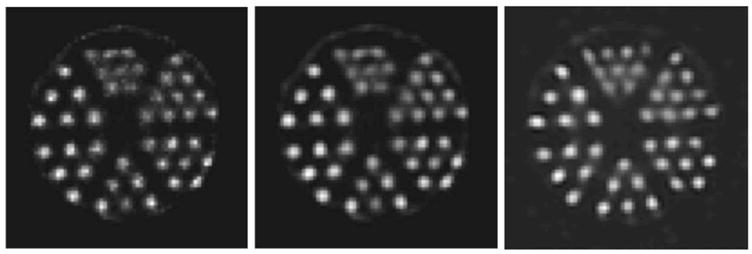
(a) Slice of an OSEM reconstruction of the hot-rod phantom performed using an interpolated system matrix with aperture 2. (b) The same reconstructed slice as is shown in (a) but following postprocessing with a Butterworth filter. (c) The same slice as is shown in (a) but from a reconstruction performed using apertures 2 and 4 and postprocessed with a Butterworth filter.
The improvement in resolution achieved through PSF interpolation is evident in the three images shown in Fig. 6. The image on the left is a slice from a reconstruction performed using the uninterpolated system matrix. The dimensions of that slice are N×N where N=34. The image on the right is a slice from a reconstruction that used the same projection data and the same reconstruction parameters but used an interpolated system matrix. Because an interpolated system matrix was used, the dimensions of the slice on the right are (2N − 1) × (2N − 1). The image in the middle is included to illustrate the improvement achieved through use of the interpolated system matrix. The middle image is simply the same slice as is shown in Fig. 6(a) interpolated to match the dimensions of the image in Fig. 6(c). These figures indicate a qualitative improvement in reconstruction gained through interpolation of the measured system matrix.
Butterworth filters have been shown to improve observer performance for certain tasks.16 Figure 7 provides a qualitative comparison of the interpolated reconstructions with the use of a Butterworth filter. The filter parameters used were N=8 with fcutoff=0.19 pixels−1. Figure 7(a) is the same slice as shown in Fig. 6(c). Figure 7(b) is the same slice as is shown in Fig. 7(a) after Butterworth filtering. To this point, all reconstructions shown have been for a single camera. Qualitative improvements result from the use of multiple cameras. Figure 7(c) shows the same object reconstructed using apertures 2 and 4. Refer to Table I for system configuration parameters.
V. DISCUSSION AND CONCLUSIONS
Several motivations existed for the design and construction of M3R, including the desire for an inexpensive, high-resolution, tabletop tomographic, small-animal SPECT system. We have begun to operate M3R successfully in this capacity and it now serves as a viable candidate for small-animal imaging studies and as a prototyping platform for future small-animal imaging systems. One of M3R’s strongest features is the ability to modify its H matrix to maximize performance. As new software techniques and hardware upgrades are explored, we will be able to simply and inexpensively modify M3R system components to take advantage of these advances. These improvements will also tend to increase M3R’s ability to perform specific tasks as measured using objective, task-based metrics. The ability to optimize system hardware for a specific task is something that, to this point, has been possible only in theory.17–19 M3R represents an ideal platform for applying these hardware optimization techniques to a physical system.
Future work will comprise a variety of hardware evaluation studies, including observer studies focused on signal detection and estimation using both projection data and reconstructed images. Future work will also include detailed descriptions of other qualitative and quantitative methods developed for aperture evaluation in M3R.
Acknowledgments
This work was supported under NIH/NIBIB Grant Nos. R01-EB002146 and P41-EB002035.
Contributor Information
Jacob Y. Hesterman, College of Optical Sciences, University of Arizona, 1630 E. University Blvd., Tucson, Arizona 85721
Matthew A. Kupinski, College of Optical Sciences and Department of Radiology, University of Arizona, 1630 E. University Blvd., Tucson, Arizona 85721
Lars R. Furenlid, Department of Radiology, University of Arizona, 1609 N. Warren Ave., Bldg 211, Tucson, Arizona 85724
Donald W. Wilson, Department of Radiology, University of Arizona, 1609 N. Warren Ave., Bldg 211, Tucson, Arizona 85724
Harrison H. Barrett, College of Optical Sciences and Department of Radiology, University of Arizona, 1630 E. University Blvd., Tucson, Arizona 85721
References
- 1.Meikle SR, Kench P, Kassiou M, Banati RB. Small animal SPECT and its place in the matrix of molecular imaging technologies. Phys Med Biol. 2005;50:R45–R61. doi: 10.1088/0031-9155/50/22/R01. [DOI] [PubMed] [Google Scholar]
- 2.Massoud TF, Gambhir SS. Molecular imaging in living subjects: seeing fundamental biological processes in a new light. Genes Dev. 2003;17:545–580. doi: 10.1101/gad.1047403. [DOI] [PubMed] [Google Scholar]
- 3.Schramm N, Ebel G, Engeland U, Schurrat T, Behe M, Behr T. High-resolution SPECT using multipinhole collimation. IEEE Trans Nucl Sci. 2003;50(3):315–320. [Google Scholar]
- 4.Beekman FJ, van der Have F, Vastenhouw B, van der Linden AJ, van Rijk PP, Burbach JPH, Smith MP. U-SPECT-I: A novel system for submillimeter-resolution tomography with radiolabeled molecules in mice. J Nucl Med. 2005;46(7):1194–1200. [PubMed] [Google Scholar]
- 5.Furenlid LR, Wilson DW, Chen YC, Kim H, Pietraski PJ, Crawford MJ, Barrett HH. FastSPECT II: A second-generation high-resolution dynamic SPECT imager. IEEE Trans Nucl Sci. 2004;51(3):631–635. doi: 10.1109/TNS.2004.830975. [DOI] [PMC free article] [PubMed] [Google Scholar]
- 6.Funk T, Depres P, Barber WC, Shah KS, Hasegawa BH. A multipinhole small animal SPECT system with submillimeter spatial resolution. Med Phys. 2006;33(5):1259–1268. doi: 10.1118/1.2190332. [DOI] [PubMed] [Google Scholar]
- 7.Zimmerman R, Moore S, Mahmood A. Nuclear Science Symposium Conference Record, 2004 IEEE. Vol. 4. Performance of a triple-detector, multiple-pinhole SPECT system with iodine and indium isotopes; pp. 2427–2429. [Google Scholar]
- 8.Tsui B, Wang Y, Yoder B, Frey E. Micro-SPECT. Biomedical Imaging; Proceedings, 2002 IEEE International Symposium; 2002. pp. 373–376. [Google Scholar]
- 9.Barrett HH, Myers KJ. Foundations of Image Science. Wiley; Hoboken, NJ: 2004. [Google Scholar]
- 10.Kulite data sheet, H. C. Starck, Co.
- 11.Hesterman J, Kupinski M, Furenlid L, Wilson D. Experimental task-based optimization of a four-camera variable-pinhole small-animal SPECT system. Proc SPIE. 2005;5749:300. doi: 10.1117/12.594386. [DOI] [PMC free article] [PubMed] [Google Scholar]
- 12.Wilkinson F., III . Emission Tomography: The Fundamentals of PET and SPECT. Chap. 13. Academic; New York: 2004. pp. 229–254. [Google Scholar]
- 13.Chen J. Scatter rejection in gamma cameras for use in nuclear medicine. Biomed Eng Appl Basis Commun. 1997;9:20–26. [Google Scholar]
- 14.Chen Y-C, Furenlid LR, Wilson DW, Barrett HH. Small-Animal SPECT Imaging. Chap. 12. Springer; New York: 2005. pp. 195–201. [Google Scholar]
- 15.Furenlid L, Hesterman J, Barrett HH. Real-time data acquisition and maximum likelihood estimation for gamma cameras. Proc of 14th IEEE-NSS Real-Time Conf. 2005:498–501. doi: 10.1109/RTC.2005.1547506. [DOI] [PMC free article] [PubMed] [Google Scholar]
- 16.Frey EC, Gilland KL, Tsui BMW. Application of task-based measures of image quality to optimization and evaluation of three-dimensional reconstruction-based compensation methods in myocardial perfusion SPECT. IEEE Trans Med Imaging. 2002;21(9):1040–1050. doi: 10.1109/TMI.2002.804437. [DOI] [PubMed] [Google Scholar]
- 17.Kupinski MA, Hoppin JW, Clarkson E, Barrett HH. Ideal-observer computation in medical imaging with use of Markov-chain Monte Carlo techniques. J Opt Soc Am A. 2003;20(3):430–438. doi: 10.1364/josaa.20.000430. [DOI] [PMC free article] [PubMed] [Google Scholar]
- 18.Chen L, Barrett HH. Optimizing lens-coupled digital radiographic imaging systems based on model observers’ performance. In: Chakraborty DP, Krupinski EA, editors. Medical Imaging 2003: Image Perception, Observer Performance, and Technology Assessment. SPIE; Bellingham, WA: 2003. pp. 63–70. [Google Scholar]
- 19.Gross K, Kupinski MA, Peterson T, Clarkson E. Optimizing a multiple-pinhole SPECT system using the ideal observer. In: Chakraborty D, Krupinski EA, editors. Medical Imaging 2003: Image Perception, Observer Performance and Technology Assessment. SPIE; Bellingham, WA: 2003. pp. 314–322. [Google Scholar]


