Abstract
Crystal structures of the Synechocystis BLUF phototaxis photoreceptor Slr1694 have been solved in two crystal forms, a monoclinic form at 1.8 Å resolution and an orthorhombic form at 2.1Å resolution. In both forms, the photoreceptor is comprised of two pentamer rings stacked face to face. Twenty total subunits in the two asymmetric units of these crystal forms display three distinct tertiary structures that differ in length of the 5th beta strand and in orientation of Trp91, a conserved Trp residue near the FMN chromophore. Fluorescence spectroscopic analysis on Slr1694 in solution is consistent with motion of Trp91 from a hydrophobic environment in the dark state to a more hydrophilic environment in the light-excited state. Mutational analysis indicates that movement of Trp91 is dependent on occupancy of the hydrophobic Trp binding pocket with a nearby Met. These different tertiary structures may be associated with absorption in the blue region of the spectrum.
Introduction
Blue light regulates phototactic movement in photosynthetic and non-photosynthetic bacteria (1), algae and even the chloroplast organelle (2, 3). Avoidance of blue light by the cyanobacterium Synechocystis sp. PCC6803 and the alga Euglena gracilis involves photoreceptors that contain BLUF1 (sensors of blue-light using FAD) domains that use FAD or FMN as a light-absorbing chromophore (4, 5). BLUF-domain proteins have been observed in a variety of photosynthetic and non-photosynthetic organisms and are known to control such processes as blue-light phototaxis and blue-light regulation of photosynthesis gene expression (1, 6).
The most extensively characterized BLUF protein is AppA that functions as a blue-light-sensing antirepressor of photosynthetic gene expression (7). Illumination of the flavin in AppA initiates a fully reversible photocycle in which rearrangement of a hydrogen bond network between the flavin and adjacent residues is promoted and the conformation of the peptide backbone is altered (7-10). Spectral analyses of several BLUF-containing proteins show that they exhibit a similar 10 nm spectral shift upon illumination (7, 10-14). However, BLUF-containing proteins vary in the half-lives of their photocycles, ranging from 15 min for the antirepressor AppA (7) to 5 sec for the cyanobacterial phototaxis photoreceptor Slr1694 from Synechocystis (9, 15).
The crystal structure of the AppA BLUF domain in the dark state (16), coupled with spectroscopic analysis (10), indicated that photoactivation involves the rearrangement of a hydrogen bond network between several conserved residues and the flavin. FTIR studies on both AppA and Slr1694 indicate that light excitation promotes the breaking of a hydrogen bond between conserved Gln and Trp residues and formation of a new hydrogen bond from Gln to the C4ëO position of flavin (1, 9, 15). In this study, we present crystallographic evidence that the blue light photoreceptor Slr1694 exhibits three different tertiary structures involving the sole Trp residue and the 5th beta strand of their beta sheet. Spectral and mutational evidence suggests that these differences might be related to flavin excitation upon blue light absorption, and hence to signaling.
EXPERIMENTAL PROCEDURES
Protein Expression and Purification
The Slr1694 protein of Synechocystis sp. PCC6803 was overexpressed in E.coli BL21(DE3) (Novagen) as described previously (15). Protein containing Se-Met was expressed by induction with 1 mM isopropyl β-D-thiogalactopyranoside at 23° for 16h in M9 minimum medium supplemented with 60 mM Se-Met. Slr1694 was purified by chitin affinity chromatography (New England Biolabs) followed by size exclusion chromatography on Superose 12 (Pharmacia) in 20 mM Tris-HCl (pH 8.0) and 0.1 M NaCl. The purity of Slr1694 was >95% based on the results of Coomassie Blue-stain SDS-PAGE and MALDI-TOF. MALDI-TOF analysis also confirmed full incorporation of Se-Met into the peptide.
Crystallization
Purified Slr1694 was concentrated to ∼6 mg/ml using a microsep centrifugal device (Pall). Crystals were grown in the monoclinic space group P21 using the hanging drop method, in 0.1 M tri-sodium citrate and 20% PEG3350; crystals were also grown in the orthorhombic space group P21212, in 0.4 M NH4Ac, 0.1 M Bis-Tris (pH 6.5), 20% PEG3350 and 10% ethylene glycol. All crystals were grown in the dark to avoid light excitation of the chromophore.
Data Collection
All X-ray diffraction data were collected on crystals frozen in liquid nitrogen at 105 K, using a MAR165 CCD detector on BioCARS beamline 14ID-B at the Advanced Photon Source, Argonne National Laboratory. MAD data sets were collected on a single Se-Met crystal of the monoclinic form at wavelengths of 0.97982, 0.97915 and 0.96113Å. Native data were collected at 1.12714 Å. All crystals were handled under low light conditions.
Data Processing and Refinement
Diffraction data were processed with the HKL2000 software package (17). Initial phases were determined using the Se-Met derivative data collected on monoclinic crystal at 0.97982Å by the single-wavelength anomalous dispersion (SAD) method with SOLVE (18) at 2.7Å resolution. The density was then modified using RESOLVE (19). The BLUF domain from AppA was used as the starting model and then extended and adjusted against the experimental electron density using XtalView (20). The initial model revealed a decamer composed of two pentamers packed face to face. Clear density was evident for the FMN cofactor in all ten monomers. All refinement was done using the CCP4 program Refmac5 (21). After five cycles of NCS phased refinement to 2.7 Å resolution, the NCS restraints were released. The final decamer model was refined to 1.8 Å resolution against the native crystal data set. The structure of the orthorhombic form was solved at 2.1A resolution by molecular replacement using phaser (22), in which one monomer of the monoclinic structure served as the starting model. Root-mean-square deviation (RMSD) comparative analysis of individual subunits was carried out using SuperPose (version 1.0) (23). Coordinates for the monoclinic and orthorhombic forms have been deposited in the Protein Data Bank under accession codes 2HFN and 2HFO, respectively.
Mutant construction
Tryptophan and methionine residues at position 91 and 93 of Slr1694 respectively, were replaced separately by alanine, by PCR primer mutagenesis using Pyrobest DNA polymerase (TaKaRa). The primers used were Slr1694-F (9), Slr1694-R (9), Slr1694-W91A-F (5’-ACTTCGAGGTTGCGTCTATGCAAG-3’), Slr1694-W91A-R (5’-CTTGCATAGACGCAACCTCGAAGT-3’), Slr1694-M93A (5’-AGGTTTGGTCTGCGCAAGCGATCA-3’), and Slr1694-M93A-R (5’-TGATCGCTTGCGCAGACCAAACCT-3’). The Slr1694-W91A-F and Slr1694-W91A-R, and Slr1694-M93A-F and Slr1694-M93A-R primers are the two complementary primer pairs that yield the specific W91A and M93A mutations, respectively (underlined). The first PCR step was achieved with the two primer pairs Slr1694-F/Slr1694-W91A-R (and/or Slr1694-M93A-R) and Slr1694-R/Slr1694-W91A-F (and/or Slr1694-M93A-F), using the isolated plasmid pTYSlr1694 (15) as template DNA. The two DNA fragments from the first PCR were mixed and then used as template for the second PCR amplification using the primer pair Slr1694-F/Slr1694-R. The second PCR product was digested with NdeI and EcoRI, and cloned into NdeI-EcoRI-cut pTYB12 vector (New England BioLabs) and subsequently sequenced to check for mutant incorporation and overall sequence fidelity. The resulting plasmid pTYSlr1694-W91A (and/or pTYSlr1694-M93A) was used to transform E. coli strain BL21(DE3) (Novagen), and the resulting strain was used to express Slr1694 W91A (and/or M93A) mutant protein.
Fluorescence Spectroscopy
All fluorescence measurements were performed at 4° on 50 mM protein samples in 20 mM Tris (pH 8.0) and 0.1 M NaCl, with a Perkin-Elmer LS 50B luminescence spectrometer. Samples were incubated in the dark for 10 min before taking dark-state spectra. Light activation was obtained by continuous illumination with a 150 W halogen lamp at an intensity of 1000 μmol m−2 s−1 for 1 min.
RESULTS
Slr1694 Crystals, Protein Fold and Tertiary Structure
Monoclinic P21 space group crystals of full length Slr1694 protein consisting of residues 1 to 152, plus three additional amino-terminal residues derived from the expression vector, were grown under dim light/dark conditions with initial phasing accomplished using SAD data collected to 2.7Å resolution on Se-Met crystals. Final model refinement was performed against a native dataset collected to 1.8Å resolution and resulted in an Rwork of 24%, Rfree 26% (Table 1). Density was visible for all residues spanning Ser2 to Tyr140. Crystals in the orthorhombic P21212 space group were also obtained for similar residues (Ser2 to Tyr140) with a native data set collected to 2.1 Å resolution and refined to Rwork 24%, Rfree 28% (Table 1). The final model for the monoclinic form contains 1449 residues, ten FMN molecules and 153 water molecules.
Table 1.
Crystallographic data and refinement statistics
| native | native | Se derivative | |
|---|---|---|---|
| Space group | P21212 | P21 | P21 |
| Wavelength (Å) | 0.82653 | 1.12714 | 0.97982 |
| Resolution (Å) | 48−2.1 | 50−1.8 (1.86−1.80)a | 50−2.7 (2.80−2.70) |
| a, b, c (Å); α, β, γ (°) | 119.4, 147.7, 96.04, 90, 90, 90 | 90.9, 118.1, 97.1, 90, 110.8, 90 | 90.4, 117.6, 96.7, 90, 111, 90 |
| Redundancy | 2.6 | 1.1 | 5.2 |
| Completeness (%) | 90.83 | 97.4 (99.4) | 99.0 (91.0) |
| R merge b | 0.049 | 0.055 (0.587) | 0.079 (0.373) |
| Rwork / Rfreec | 0.237/0.286 | 0.240/0.267 | |
| No. of ordered waters | 129 | 153 | |
| No. of atoms | 11646 | 11652 | |
| B-factor (Å2) | 42.5 | 38.9 | |
| RMSD bond lengths (Å) | 0.014 | 0.012 | |
| RMSD bond angles (deg) | 1.558 | 1.4 |
All values in parentheses are for the last shell.
Rmerge=Σ(|I—<I>|)/Σ (I) for all data.
R=Σ∥Fobs—Fcalc /Σ|Fobs| for all data. Rfree uses 5% of data for the test set.
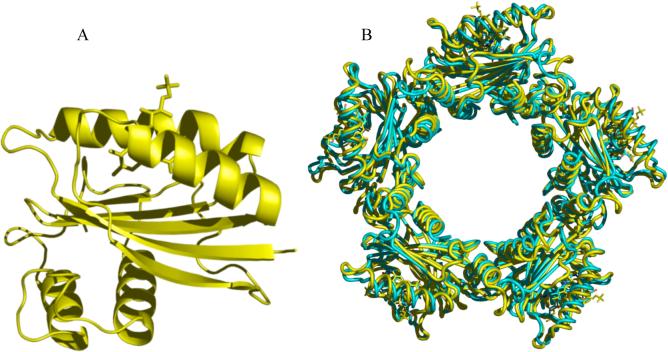
The core BLUF domain structure (residues Tyr4 to Ile96) has an α–β fold in which the flavin isocyclic ring is sandwiched between two flanking α–helices that are capped on one side by a β–sheet (Figure 1A). This BLUF domain structure is closely similar to the BLUF domain in AppA and in Tll0078 (16, 24). The RMSD values between corresponding Cα atoms in Slr1694 (residues 4−96), and AppA (residues 17 − 109) is 1.6 Å and between Slr1694 and Tll0078 (residues 4 − 96) is 0.7 Å. No structure for full-length AppA has been solved so structural information beyond its core BLUF domain is unavailable. However, the full-length Slr1694 and Tll0078 structures both have carboxyl terminal extensions (Glu104 to Ile139) comprised of similar antiparallel α–helices, that contact the β-sheet of the BLUF domain.
Figure 1. Structure of Slr1694.
A) A single subunit with its flavin is shown in stick representation; B) the ring structure of Slr1694 (yellow) superimposed on the ring structure of Tll0078 (cyan).
Slr1694 crystallizes as a decamer in both the monoclinic and orthorhombic crystal forms with the asymmetric unit comprised of two pentamer rings that exhibit quasi-52 point group symmetry (Figure 1B). This decamer structure is similar to that found in crystals of the closely-related, BLUF-domain-containing protein Tll0078 (24). In the Slr1694 structure, the isocyclic rings of the flavins are oriented on the outside edges of the stacked rings with the two carboxyl terminal α-helices located on the inside face of the rings, flanking the central opening of diameter 30 Å.
Differences in the Flavin Binding Pocket among Subunits
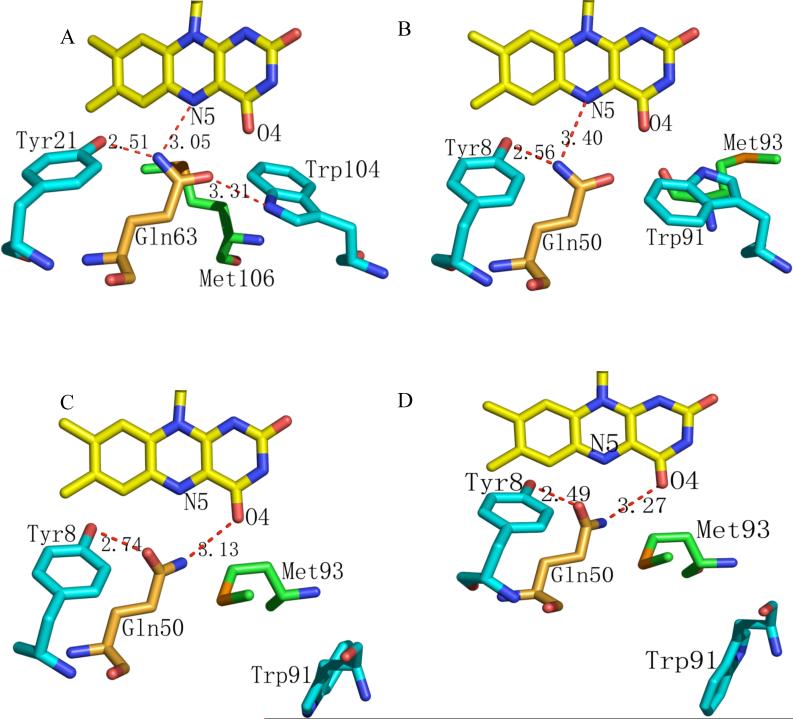
Since similar light-minus-dark difference spectra are found in AppA and other BLUF-containing proteins such as Slr1694 and Tll0078, different members of the BLUF family may have similar responses to light (15, 24). The best-studied BLUF photoreceptor is AppA where it is proposed that light absorption initiates rearrangement of a conserved hydrogen-bond network that exists between FAD, Tyr21, Gln63 and Trp104 (9, 16) (Fig. 2a). Indeed, inspection of the Slr1694 structure shows that residues analogous to AppA Tyr21 and Gln63 (Tyr8 and Gln50 in Slr1694) are located in the same general position and appear to form the same hydrogen bonds as in AppA (Figure 2B). However, the location of Trp91 in Slr1694 (the residue analogous to Trp104 in AppA) differs. In nine of the ten crystallographically-independent subunits in the monoclinic Slr1694 crystals, Trp91 has swung away from the flavin toward the inner central hole where it is exposed to the solvent. We designate this as the “Trp91 out” orientation (Figure 2C). In these subunits, Met93 also moves to occupy a position close to Gln50 and the flavin ring, similar to the location of Trp104 in AppA. Remarkably, in the tenth subunit that packs tightly against an adjacent pentamer ring from the neighboring asymmetric unit, Trp91 and Met93 occupy positions similar to those observed in AppA. Specifically, in this subunit Trp91 is located near the flavin and Gln50, which we designate as the “Trp91 in” orientation, and Met93 has moved away from the flavin (Figure 2B). The relative locations of Trp91 and Met93 were consistent in data collected from 5 different monoclinic Slr1694 crystals (data not shown), even though these crystals were presumably exposed to slightly different light conditions during crystal growth, mounting and X-ray data collection.
Figure 2. Conformation of hydrogen-bond-forming residues in the flavin binding pocket that undergo alterations.
A) Tyr21, Gln63 Met106 and Trp104 in AppA in the putative dark state conformation. B) The corresponding residues Tyr8, Gln50, Met93 and Trp91 in Slr1694 in the “Trp91 in” conformation that represents the putative, pseudo-dark state. C) These Slr1694 residues in the “Trp91 out” conformation that represents a putative light-excited state (see text). D) The corresponding residues in Tll0078, also in a putative light-excited state.
In the orthorhombic crystal form of Slr1694, grown under different solvent conditions from the monoclinic form, eight subunits exhibit the “Trp91 out” orientation and two, the “Trp91 in” orientation. One of the “Trp91 in” subunits also packs tightly against the neighboring pentamer ring, as observed in the monoclinic crystals. Interestingly, the second “Trp91 in” subunit is located on the adjacent pentamer ring, directly across from the first “Trp91 in” subunit.
RMSD analysis of individual subunits of Slr1694
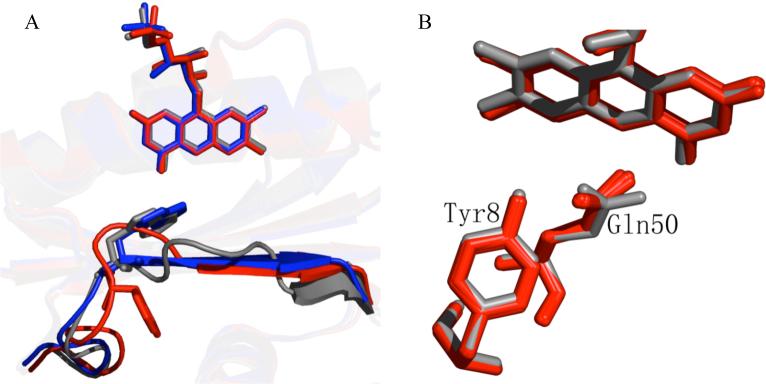
We performed RMSD analysis among the 20 crystallographically-independent subunits present in the monoclinic and orthorhombic crystals to identify more quantitatively the conformational differences among them. Averaging all twenty subunits gives a RMSD of 0.8 Å on all atoms including flavin, indicating that their tertiary structures are closely similar. However, using one subunit as a reference for pairwise superpositions revealed three classes of subunit structures (Figure 3A). The largest class (class I) has 17 subunits with the “Trp91 out” orientation accompanied by an intermediate length of the 5th β strand spanning four residues, Gln94 to Thr97 (Figure 3A red). The RMSD on all atoms among these 17 subunits is 0.71 Å. Two subunits are in a second class (class II) which have the “Trp91 in” orientation accompanied by a short 5th β strand spanning three residues, Ile96 to Val98 (Figure 3A gray). The RMSD between these two subunits is 0.75 Å. When these two class II subunits are averaged and compared to an average of the 17 class I subunits, the RMSD between these two classes increases to 1.6 Å. One subunit from the orthorhombic crystal is in a separate class (class III) that has the “Trp91 in” orientation accompanied by a long 5th β strand spanning five residues, Trp91 through Ala95, similar in length to the 5th β strand of AppA (Figure 3A blue). When this class III subunit is compared to the average of the 17 class I subunits, the RMSD is 1.7Å and when compared to an average of the 2 class II subunits, the RMSD is 1.5 Å. In addition to differing in the orientation of Trp91 and the length of the 5th β strand, these three subunit classes exhibit small conformational differences in the loop between the 4th and 5th β strands that contains both Trp91 and Met93.
Figure 3. Comparison of the structural changes that occur in Slr1694 subunits in the monoclinic and orthorhombic crystal forms.
A) Differences in the location of Trp91 and the fifth beta strand in the “Trp91 in” conformation (gray and blue) and the “Trp91 out” conformation (red). B) Twist of Gln50 in the “Trp91 in” conformation (gray) compared to the other nine subunits (red) in the monoclinic crystal form.
Fluorescence Analysis of Trp91 Movement During Photoexcitation
In subunits with the “Trp91 in” orientation, the Trp indole ring is completely buried with the amide backbone exposed to the outer surface of the ring (Figure 4A). In contrast, in subunits with the “Trp91 out” orientation, the indole ring is swung away from the flavin and is clearly solvent-exposed at the outer ring surface (Figure 4B). Typically, Trp fluorescence is quenched and the wavelength of its emission maximum red-shifted when this residue is exposed to polar solvents. Since Trp91 is the only tryptophan in Slr1694, measurement of Trp fluorescence examines any reorientation and change in environment of this residue that could occur as a result of flavin excitation by blue light.
Figure 4. Alternate locations of Trp91 (cyan) relative to the flavin, depicted in a space-filling model.
A) The buried location of Trp91 in the “Trp91 in” conformation. B) The solvent-exposed location of Trp91 in the “Trp91 out” conformation.
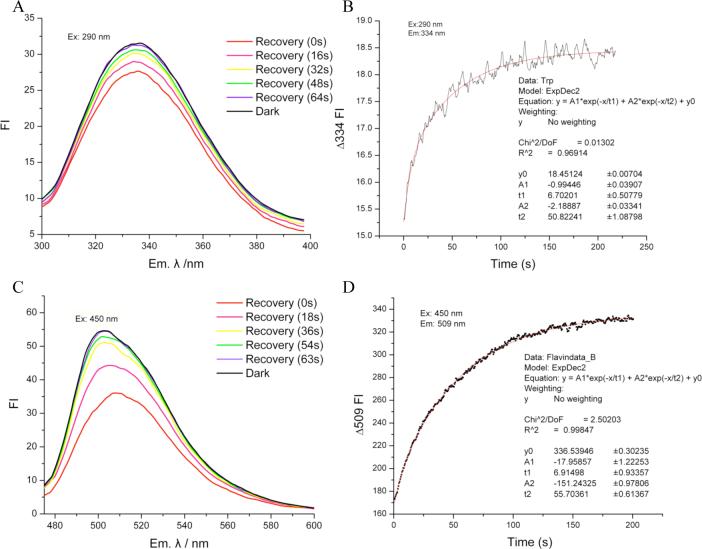
Figure 5 shows the fluorescence emission analysis of wild type Slr1694 in solution. Both Trp fluorescence quenching and a 2 nm red-shift in the λmax of its emission peak are observed upon excitation (Figure 5A). This suggests that Trp91 moves to a more polar environment as a consequence of blue light excitation of the flavin. Furthermore, light-induced quenching also suggests that the dark state of Slr1694 most likely positions Trp91 near the flavin in the “Trp91 in” orientation similar to that of the AppA structure. Conversely, the “Trp91 out” orientation is likely to represent the light- excited state.
Figure 5. Fluorescence spectra of Slr1694 in solution.
A) Tryptophan fluorescence emission recovery after excitation at 290 nm. B) Kinetics of tryptophan fluorescence recovery at 334 nm after excitation at 290 nm C) Kinetics of flavin fluorescence emission after excitation at 450 nm D) Kinetics of flavin fluorescence recovery at 509 nm after excitation at 450 nm.
What is rather unexpected is that Trp and flavin fluorescence both recover bi-exponentially (Table 2). A fast recovery phase of Trp and flavin fluorescence (τ = 6.7 and 6.9 sec, respectively) mimics the τ = 9.2 sec rate of recovery of the ground state flavin absorption spectrum. Interestingly, there is also a slow recovery phase for both the Trp and flavin fluorescence with τ = 50 and 55 sec respectively, significantly longer than the monophasic τ = 9 sec recovery observed for the flavin absorption spectrum.
Table 2.
Spectral properties of Slr1694 and its mutants
| |
τ 1/2 Δ 495 Abs.a |
τ 1/2 Δ Fl(Trp91)b |
τ 1/2 Δ Fl(Flavin)c |
|---|---|---|---|
| Slr1694 | 9.20±0.02s | τ 1=6.7±0.51s | τ 1=6.9±0.9s |
| |
|
τ 2=50.1±1.1s |
τ 2=55.7±0.6s |
| W91A | 1.6±0.3s | NT | NT |
| M93A | 7.53±0.03s | locked in dark state | τ 1=3.81±0.05s |
| τ 2=51.5±3.7s |
half decay time of absorbance change at 495nm from light state
half time of fluorescence emission change of Tryptophan (excited at 290 nm, emission at ∼334 nm)
half time of fluorescence emission change of flavin (excited at 450 nm, emission at ∼509 nm)
Trp91 and Met93 affect the kinetics of the Slr1694 photocycle
We undertook mutational analysis to assess further the roles of Trp91 and Met93 in the Slr1694 photocycle. Both residues were replaced separately by Ala (W91A and M93A, respectively) and the absorbance and fluorescence spectral characteristics of the purified, mutant proteins were examined. The W91A and M93A mutants in solution retain the 10 nm shift in the flavin absorbance spectrum upon light excitation observed with wild type Slr1694 protein (data not shown), from which we infer that hydrogen bonding to Trp91 does not affect flavin absorbance. However, recovery of the ground state is slightly faster for both mutants; τ = 7.5 sec in M93A and 1.6 sec in W91A, compared with 9.0 sec in wild-type protein. Since W91A lacks any Trp, fluorescence analysis could not be undertaken for that mutant; however, analysis of M93A revealed no change in Trp fluorescence between dark and light-excited protein, which suggests there is no movement of Trp91. Thus, the M93A mutant is still capable of undergoing a photocycle but is unable to elicit movement of Trp91.
DISCUSSION
Conformational variability among BLUF domains
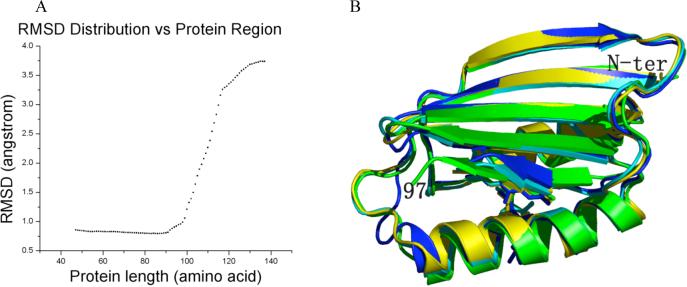
An unusual feature of the present results is the difference in tertiary structures among certain subunits of Slr1694. Although the two helices remain in nearly identical positions in all subunits, there are significant differences between individual subunits in the position of Trp91, Met93, the loop between the 4th and 5th beta strand and the length and position of the 5th beta strand (Figure 6B).
Figure 6. The core structure of BLUF proteins.
A) RMSD between Cα atoms for different lengths of BLUF proteins starting from the amino terminus. B) The core structure of the BLUF proteins (yellow, Slr1694; cyan, Tll0078; blue, BlrB; green, AppA).
A distributive RMSD analysis among the 20 subunits of Slr1694, 10 subunits of Tll0078 (PDB code 1XOP (24)), 2 subunits of BlrB (PDB code 2BYC (13)) and 3 subunits of AppA (PDB code 1YRX (16)) shows that the 35 crystallographically-independent BLUF domains in these proteins are essentially identical in structure (RMSD 0.8A or less among all atoms) from their N-termini through residue 90 in Slr1694 (Figure 6A). There is a significant rise in RMSD beginning at Trp91, which lies within the loop between the fourth and 5th β-strand, to residue 97 at the end of the 5th β-strand. This rise occurs despite the fact that residues 91 through 96 still constitute part of the conserved, ferredoxin-like fold that defines the core BLUF domain spanning residues 4 to 96 (1, 16). A further sharp rise in RMSD occurs C-terminal to residue 97, arising from sequence divergence of these four proteins that extends beyond the core domain (Figure 6A). Of the 35 crystallographically-independent subunits in these four proteins, 6 are in the “Trp91 in” orientation and 29 are in the “Trp91 out” orientation. Notably, all ten subunits of Tl10078 are in the “Trp91 out” orientation. The fact that the first 90 residues in these different BLUF proteins appear invariant in tertiary structure, in contrast with the variability observed for residues 91 to 97, suggests that movement of these latter residues could constitute an output signal.
What is the origin of this structural variability? The presence of some variability is not surprising since signaling proteins must display signal-dependent conformational changes that arise from atomic displacement and/or changes in dynamics. Signaling states must be readily accessible from the ground state, separated from it by a free energy barrier lower in height than the free energy derivable from the signal (photon absorption in the case of photosensors, ligand binding in the case of chemosensors). In the case of the BLUF domains in Slr1694, there are two possible origins for the observed structural variability: the effects of crystallization solvent and intermolecular interactions imposed by the crystal lattices, and the effects of the signal, photon absorption. To maximize population of the “dark” state, we deliberately grew crystals in the dark and handled them throughout under dark or low light conditions. However, most subunits in the two Slr1694 crystal forms exhibit the “Trp91 out”, solvent-exposed orientation, which in solution is associated with the “light” or excited state, as evidenced by our Trp fluorescence analysis. Either the majority of the subunits are trapped in a dark, light-insensitive conformation, an explanation at odds with our fluorescence analysis in solution or crystal growth favors a conformation of the majority of the subunits in a “light” state that cannot respond further to light. In absence of Trp fluorescence emission properties exhibited by individual frozen Slr1694 crystals, which may differ from solution state Slr1694, the best working hypothesis is that the latter holds and that the “Trp91 out” orientation indeed corresponds to the light-excited state, and the “Trp91 in” orientation to the dark state.
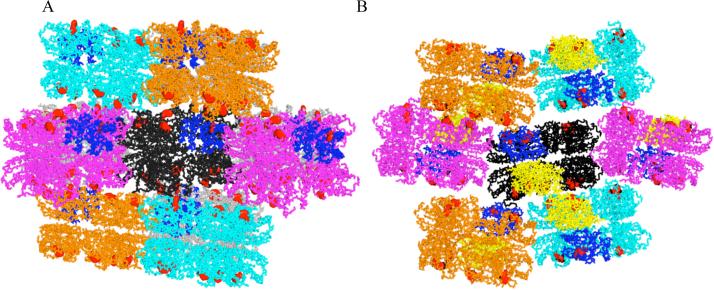
Why is only one subunit of the monoclinic Slr1694 structure in a pseudo-dark state? Inspection of the crystal lattice shows that each set of stacked pentameric rings that constitutes an asymmetric unit is present in a lattice in tilted orientation (Figure 7A). The tilt of each set of stacked pentamer rings is such that one subunit in one asymmetric unit is in close contact with a pentamer in a neighboring asymmetric unit (blue subunit in Figure 7A) and it is this “pinched” subunit that orients Trp91 towards the flavin (Trp in). If we model a pentamer in which we replace the “Trp in” subunit with a “Trp91 out” subunit, then the “Trp91 out” subunit physically impedes contact with the pentamer in the neighboring asymmetric unit. This suggests that packing in the crystal lattice constrains this particular subunit into the “Trp91 in” orientation.
Figure 7. Packing difference among asymmetric units in the monoclinic and orthorhombic crystals and their impact on Trp91 orientation (red).
A) Monoclinic crystal form in which the “Trp91 in” subunit (indicated in blue) is in contact with a subunit in a neighboring decamer. B) Orthorhombic crystal form in which the “Trp91 in” subunit in contact with a neighboring decamer is indicated in blue and the adjacent, unconstrained “Trp91 in” subunit is indicated in yellow.
Although crystal packing may exert major influence on the subunit conformations, it is not the only factor. In the orthorhombic crystal form, two subunits exhibit the “Trp91 in” conformation. In this different crystal lattice the set of stacked pentamer rings that constitutes an asymmetric unit adopt a zig-zag stacking pattern (Figure 7B), in which one subunit in the asymmetric unit is in close contact with a neighboring asymmetric subunit. As is the case of the “Trp in” subunit in the monoclinic crystals, the subunit that is “pinched” by protein stacking in the orthorhombic crystals also exhibits Trp91 in the “Trp in” orientation (blue subunit in Figure 7B). Interestingly, a second subunit in the orthorhombic crystal also exhibits Trp91 in the “Trp in” orientation (yellow subunit in Figure 7B). This subunit is relatively unconstrained as it is not tightly packed against any other subunits. However, this second “Trp in” subunit is located on a separate pentamer ring, directly across from the pinched subunit that has the “Trp in” orientation. This result suggests that there may be an allosteric interaction between subunits in the two adjacent pentamer rings that comprise the decamer, and that this interaction also contributes to “Trp91 in” vs. “Trp91 out” orientations.
Finally, we also examined intermolecular interactions in Tll0078 crystals that contain all ten subunits in the “Trp91 out” orientation. In these crystals, all rings pack in a parallel orientation such that Trp91 is free to move between the “Trp91 out” and “Trp91 in” orientations (PDB code 1XOP (24)).
Emerging details of the BLUF photocycle
Several new pieces of information from this study complement prior structural and spectral analysis of AppA (8, 10, 16) and illuminate the mechanism of the BLUF photocycle. Collectively these results indicate that Tyr8, Gln50 and Trp91 in Slr 1694 form a hydrogen-bond network with the flavin. In the dark state, it is likely that the amine group (ε2N) of Gln50 forms hydrogen bonds to both the hydroxyl of Tyr8 and N5 of the flavin (10, 16); and the carboxyl of Gln50 (ε 1O) forms a hydrogen bond to N1 of Trp91 (ε1N) (10, 16). Upon light absorption by the flavin, a transient flavin radical forms (10) that may initiate rearrangement of the flavin-Gln50 hydrogen bond: the side chain of Gln50 rotates ∼180°, breaks its hydrogen bond to Trp91 and forms a new hydrogen bond with the C(4)$#xFF1D;O position of the flavin. (Gln50 and Trp91 are equivalent to Gln63 and trp104 in AppA). Our results support this model and in addition, provide evidence that Trp91 and Met93 undergo significant conformational reorientation that affects the structure of the loop prior to the 5th beta strand and the length and position of this strand. We also confirm that the conserved Gln50 residue differs in orientation between the “Trp91 in” and “Trp91 out” subunits, which supports the model we described above (Figure 3B).
Since our optical data on wild type protein and the W91A mutant show that Trp91 is not essential for the 10 nm shift in the Slr1694 absorption spectrum upon absorption of blue light, it is unlikely that this residue is directly involved in any electron or proton transfer events between Tyr8, Gln50 and the flavin that promote this spectral shift. This is not surprising since Trp at this position is not universally conserved among BLUF proteins (1, 6). The kinetics of the photocycle is, however, affected by the presence of Trp91 with W91A mutants exhibiting faster photocycles in both Slr1694 (Table 2) and in the corresponding mutant in AppA (10). A faster photocycle is also observed in the M93A mutant. These results suggest that the ability of Gln50 to form a hydrogen bond to Trp91 affects the kinetics of the photocycle. Based on the absence of Trp91 fluorescence quenching in M93A, the photocycle in this mutant does not appear to be accompanied by displacement of Trp91 into a polar environment. Thus, it appears that this mutation has uncoupled the generation of a spectral shift caused by light-induced hydrogen bond rearrangement with the flavin, from the downstream output event (Trp movement).
Finally, the relatively fast monophasic decay of the flavin absorbance spectrum (τ 1/2= 9.2 sec; Table 2) is contrasted by slower biphasic decays observed for flavin (τ1/2=7 and 50 sec; Table 2) and Trp fluorescence (τ1/2=7 and 56 sec; Table 2). One interpretation is that decay from the light excited state may initially involve rapid (7 to 9 sec) movement of Trp91 from the “out” orientation to a transient intermediate state followed by a slower (50 to 56 sec) continued reorganization of the hydrogen bond network to a stable dark state that has Trp 91 hydrogen bonded to the C(4)$#xFF1D;O position of the flavin as observed in the AppA structure.
Acknowledgements
We thank Dr. Bogdan Dragnea for help in analyzing the kinetics of the photocycle in several Slr1694 mutants.
Abbreviations
- BLUF
blue-light sensing using FAD
- MAD
multiwavelength anomalous diffraction
- SAD
single-wavelength anomalous dispersion
- NCS
noncrystallographic symmetry
Footnotes
This study was supported by National Institutes of Health grants GM40941 to C. E. B. and GM36452 to K. M. BioCARS is supported by NIH grant RR07707 to K. M.; the Advanced Photon Source is supported by the Department of Energy.
The atomic coordinates for Slr1694 monoclinic and orthorhombic forms have been deposited in the Protein Data Bank under accession codes 2HFN and 2HFO, respectively.
REFERENCES
- 1.Masuda SB, C.E. The antirepressor AppA uses the novel flavin-binding BLUF domain as blue-light absorbing photoreceptor to control photosystem synthesis. Handbook of Photosensory Receptors. 2005 [Google Scholar]
- 2.Briggs WR, Huala E. Blue-light photoreceptors in higher plants. Annu Rev Cell Dev Biol. 1999;15:33–62. doi: 10.1146/annurev.cellbio.15.1.33. [DOI] [PubMed] [Google Scholar]
- 3.Gauden M, Yeremenko S, Laan W, van Stokkum IH, Ihalainen JA, van Grondelle R, Hellingwerf KJ, Kennis JT. Photocycle of the flavin-binding photoreceptor AppA, a bacterial transcriptional antirepressor of photosynthesis genes. Biochemistry. 2005;44:3653–62. doi: 10.1021/bi047359a. [DOI] [PubMed] [Google Scholar]
- 4.Masuda S, Ono TA. Biochemical characterization of the major adenylyl cyclase, Cya1, in the cyanobacterium Synechocystis sp. PCC 6803. FEBS Lett. 2004;577:255–8. doi: 10.1016/j.febslet.2004.09.086. [DOI] [PubMed] [Google Scholar]
- 5.Iseki M, Matsunaga S, Murakami A, Ohno K, Shiga K, Yoshida K, Sugai M, Takahashi T, Hori T, Watanabe M. A blue-light-activated adenylyl cyclase mediates photoavoidance in Euglena gracilis. Nature. 2002;415:1047–51. doi: 10.1038/4151047a. [DOI] [PubMed] [Google Scholar]
- 6.Gomelsky M, Klug G. BLUF: a novel FAD-binding domain involved in sensory transduction in microorganisms. Trends Biochem Sci. 2002;27:497–500. doi: 10.1016/s0968-0004(02)02181-3. [DOI] [PubMed] [Google Scholar]
- 7.Masuda S, Bauer CE. AppA is a blue light photoreceptor that antirepresses photosynthesis gene expression in Rhodobacter sphaeroides. Cell. 2002;110:613–23. doi: 10.1016/s0092-8674(02)00876-0. [DOI] [PubMed] [Google Scholar]
- 8.Kraft BJ, Masuda S, Kikuchi J, Dragnea V, Tollin G, Zaleski JM, Bauer CE. Spectroscopic and mutational analysis of the blue-light photoreceptor AppA: a novel photocycle involving flavin stacking with an aromatic amino acid. Biochemistry. 2003;42:6726–34. doi: 10.1021/bi030055o. [DOI] [PubMed] [Google Scholar]
- 9.Masuda S, Hasegawa K, Ono TA. Light-induced structural changes of apoprotein and chromophore in the sensor of blue light using FAD (BLUF) domain of AppA for a signaling state. Biochemistry. 2005;44:1215–24. doi: 10.1021/bi047876t. [DOI] [PubMed] [Google Scholar]
- 10.Dragnea V, Waegele M, Balascuta S, Bauer C, Dragnea B. Time-resolved spectroscopic studies of the AppA blue-light receptor BLUF domain from Rhodobacter sphaeroides. Biochemistry. 2005;44:15978–85. doi: 10.1021/bi050839x. [DOI] [PMC free article] [PubMed] [Google Scholar]
- 11.Okajima K, Yoshihara S, Fukushima Y, Geng X, Katayama M, Higashi S, Watanabe M, Sato S, Tabata S, Shibata Y, Itoh S, Ikeuchi M. Biochemical and functional characterization of BLUF-type flavin-binding proteins of two species of cyanobacteria. J Biochem (Tokyo) 2005;137:741–50. doi: 10.1093/jb/mvi089. [DOI] [PubMed] [Google Scholar]
- 12.Rajagopal S, Key JM, Purcell EB, Boerema DJ, Moffat K. Purification and initial characterization of a putative blue light-regulated phosphodiesterase from Escherichia coli. Photochem Photobiol. 2004;80:542–7. doi: 10.1562/2004-06-16-RA-203. [DOI] [PubMed] [Google Scholar]
- 13.Jung A, Domratcheva T, Tarutina M, Wu Q, Ko WH, Shoeman RL, Gomelsky M, Gardner KH, Schlichting I. Structure of a bacterial BLUF photoreceptor: insights into blue light-mediated signal transduction. Proc Natl Acad Sci U S A. 2005;102:12350–5. doi: 10.1073/pnas.0500722102. [DOI] [PMC free article] [PubMed] [Google Scholar]
- 14.Ito S, Murakami A, Sato K, Nishina Y, Shiga K, Takahashi T, Higashi S, Iseki M, Watanabe M. Photocycle features of heterologously expressed and assembled eukaryotic flavin-binding BLUF domains of photoactivated adenylyl cyclase (PAC), a blue-light receptor in Euglena gracilis. Photochem Photobiol Sci. 2005;4:762–9. doi: 10.1039/b505792b. [DOI] [PubMed] [Google Scholar]
- 15.Masuda S, Hasegawa K, Ishii A, Ono TA. Light-Induced structural changes in a putative blue-light receptor with a novel FAD binding fold sensor of blue-light using FAD (BLUF); Slr1694 of Synechocystis sp. PCC6803. Biochemistry. 2004;43:5304–13. doi: 10.1021/bi049836v. [DOI] [PubMed] [Google Scholar]
- 16.Anderson S, Dragnea V, Masuda S, Ybe J, Moffat K, Bauer C. Structure of a novel photoreceptor, the BLUF domain of AppA from Rhodobacter sphaeroides. Biochemistry. 2005;44:7998–8005. doi: 10.1021/bi0502691. [DOI] [PMC free article] [PubMed] [Google Scholar]
- 17.Minor Z. O. a. W. Processing of X-ray diffraction data collected in oscillation mode. Methods in Enzymology. 1997;276:307–326. doi: 10.1016/S0076-6879(97)76066-X. [DOI] [PubMed] [Google Scholar]
- 18.Terwilliger TC, Berendzen J. Automated MAD and MIR structure solution. Acta Crystallogr D Biol Crystallogr. 1999;55(Pt 4):849–61. doi: 10.1107/S0907444999000839. [DOI] [PMC free article] [PubMed] [Google Scholar]
- 19.Terwilliger TC. Maximum-likelihood density modification. Acta Crystallogr D Biol Crystallogr. 2000;56(Pt 8):965–72. doi: 10.1107/S0907444900005072. [DOI] [PMC free article] [PubMed] [Google Scholar]
- 20.McRee DE. XtalView/Xfit--A versatile program for manipulating atomic coordinates and electron density. J Struct Biol. 1999;125:156–65. doi: 10.1006/jsbi.1999.4094. [DOI] [PubMed] [Google Scholar]
- 21.Murshudov GN, Vagin AA, Dodson EJ. Refinement of macromolecular structures by the maximum-likelihood method. Acta Crystallogr D Biol Crystallogr. 1997;53:240–55. doi: 10.1107/S0907444996012255. [DOI] [PubMed] [Google Scholar]
- 22.McCoy AJ, Grosse-Kunstleve RW, Storoni LC, Read RJ. Likelihood-enhanced fast translation functions. Acta Crystallogr D Biol Crystallogr. 2005;61:458–64. doi: 10.1107/S0907444905001617. [DOI] [PubMed] [Google Scholar]
- 23.Maiti R, Van Domselaar GH, Zhang H, Wishart DS. SuperPose: a simple server for sophisticated structural superposition. Nucleic Acids Res. 2004;32:W590–4. doi: 10.1093/nar/gkh477. [DOI] [PMC free article] [PubMed] [Google Scholar]
- 24.Kita A, Okajima K, Morimoto Y, Ikeuchi M, Miki K. Structure of a cyanobacterial BLUF protein, Tll0078, containing a novel FAD-binding blue light sensor domain. J Mol Biol. 2005;349:1–9. doi: 10.1016/j.jmb.2005.03.067. [DOI] [PubMed] [Google Scholar]


