

Abstract
Ongoing optimization of proteomic methodologies seeks to improve both the coverage and confidence of protein identifications. The optimization of sample preparation, inclusion of technical replicates (repeated instrumental analysis of the same sample), and biological replicates (multiple individual samples) is crucial in proteomic studies to avoid the pitfalls associated with single point analysis and under-sampling. Phosphopeptides were isolated from HeLa cells and analyzed by nano-reversed phase liquid chromatography electrospray ionization tandem mass spectrometry (nano-RP-LC-MS/MS). We observed that a detergent-based protein extraction approach, followed with additional steps for nucleic acid removal, provided a simple alternative to the broadly used Trizol extraction. The evaluation of four technical replicates demonstrated measurement reproducibility with low percent variance in peptide responses at approximately 3%, where additional peptide identifications were made with each added technical replicate. The inclusion of six technical replicates for moderately complex protein extracts (approximately 4000 uniquely identified peptides per dataset) affords the optimal collection of peptide information.
Keywords: Comparative phosphoproteomics, Immobilized metal-ion affinity chromatography (IMAC), Mass spectrometry, 50 μm ID reversed phase column, 1D SDS-PAGE, Non-metal nano-HPLC
Introduction
Reversible phosphorylation of serine, threonine, and tyrosine residues in proteins represents a prominent mechanism in eukaryotes for regulating cellular processes involving signal transduction.1 Analytical approaches utilizing mass spectrometry (MS) have become broadly applied to identify protein phosphorylation sites.2-5 Because of the often low stoichiometry of the phosphoproteome within a cell (≤ 1%), an enrichment step is a necessary requirement to identify low abundance phosphopeptides from complex mixtures.
One of the most widely used enrichment techniques is immobilized metal-ion affinity chromatography (IMAC),6-8 which has been optimized over the years for high specificity enrichment and recovery of phosphopeptides.4,9,10 Since the presence of nucleic acids in proteomic samples interferes with this enrichment step by competing with phosphopeptides for available binding sites in the IMAC stationary phase, sample preparation methods upstream of IMAC enrichment are highly important.
Trizol extraction is the most commonly used protein extraction method in IMAC applications.9, 11-13 The Trizol approach effectively removes nucleic acids that reduce phosphopeptide recovery and provides an increase in method sensitivity during IMAC enrichment. However, the Trizol method involves multiple steps, including phase separation and precipitation to remove RNA and DNA and collect protein. Minor variations in sample handling during this procedure can undermine both uniform protein recovery among samples and sample quality. Furthermore, as a precipitation-based approach, it may result in selective protein loss.14
Herein, we describe a study in which samples were prepared using a detergent-based cell lysis method followed by in-solution or in-gel digestion and IMAC enrichment to explore the phosphoprotein coverage of HeLa cell lysates. Samples were also prepared using Trizol extraction. Compared with Trizol extraction, detergent-based extraction such as with the Roche Complete lysis approach is fast, requires a single, easily reproduced step, and gives a good protein yield, but requires additional steps to remove nucleic acids prior to IMAC enrichment. In this study, several simple steps were taken during phosphopeptide sample preparation to facilitate nucleic acid removal. The effect of these sample preparation steps, as well as the inclusion of both technical replicates (repeated instrumental analysis of the same sample) and biological replicates (multiple individual samples) on proteome coverage were evaluated, as these experimental design parameters are crucial to avoid the pitfalls associated with single point analysis and under-sampling.
Materials and Methods
Cell Culture
HeLa cells were grown in Dulbecco’s Modified Eagle Medium (DMEM) with high glucose (Invitrogen, Carlsbad, CA) supplemented with 10% fetal bovine serum (FBS) (Clontech, Mountain View, CA) and 100 units/mL Penicillin and 100 μg/mL Streptomycin (Invitrogen) at 37 °C in 5% CO2.
HeLa Cell Protein Extraction
Two sets of samples were prepared. In the first set (Biological replicate 1), 5 nearly confluent 100 mm plates of cells were extracted with Trizol, and 5 matched plates of cells were solubilized with Roche lysis buffer. The sample solubilized with Roche Complete Lysis-M was then split into two equal portions. One portion was subjected to in-solution tryptic digestion, while the other portion was subjected to SDS-PAGE and in-gel tryptic digestion. For the second sample (Biological replicate 2), 5 nearly confluent 100 mm plates of cells were again solubilized with Roche lysis buffer and divided into two portions for either in-solution digest or in-gel digest.
Trizol Extraction
Trizol reagent (Invitrogen, Inc., Carlsbad, CA) was used to extract protein, according to the manufacturer’s suggested protocol with the exception that the initial Trizol volume was doubled (∼2 mL Trizol reagent/5 × 106 cells). We have previously shown that this protocol modification enhances the protein yield.11 The protein pellet was resuspended in 8 M urea, and the proteins were then reduced and alkylated with DTT and iodoacetamide, respectively. The denatured and alkylated proteins were digested with modified trypsin at a 1:20 ratio for 4 h at 37 °C after 2-fold dilution with 50 mM NH4HCO3 (pH 7.4). After 5-fold further dilution, a second trypsin digestion at a 1:20 ratio was performed overnight at 37 °C. The digestion was stopped by adding acetic acid to a final pH of ∼3.5 to 4. A C18 RP peptide Macrotrap SPE cartridge (Michrom BioResources, Inc., Auburn, CA) was used to desalt the tryptic digests. The tryptic peptides were then converted to peptide methyl esters according to the general procedure of White et al.12 except that a second methyl esterification step was performed to ensure complete esterification. Samples were reconstituted in IMAC loading solutions that consisted of 1:1:1 methanol/acetonitrile/0.01% acetic acid at a ratio of 100 μL solution to 100 - 200 μg peptides. This extraction set was analyzed using LC-LTQ-FT MS (Thermo Fisher Scientific, Bremen, Germany).
Roche Complete Lysis-M, EDTA-free Extraction
HeLa cells were lysed and extracted using the Roche Complete Lysis-M, EDTA-free kit (Roche Applied Science, Mannheim, Germany) according to the manufacturer’s guidelines. Phosphatase Inhibitor Cocktail Set I and Set II (EMD Biosciences, San Diego, CA) were added to the extracts, following the manufacturer’s protocol. For the first portion split (described above), urea was added to the extract to a final concentration of 8 M, and the proteins were reduced, alkylated, and digested as described above. Following tryptic digestion, ultracentrifugation (166,000 × g for 30 min at 4 °C) was used to deplete nucleic acids from the sample prior to SPE desalting. Following SPE desalting, extracts were methyl esterified and the phosphopeptides enriched using IMAC, as described below. Biological replicate 1 was analyzed using LC-LTQ-FT MS, while Biological replicate 2 was analyzed using LC-LTQ-Orbitrap MS (Thermo Fisher Scientific, Bremen, Germany).
1D SDS-PAGE Clean-up
To remove nucleic acids from the second portion split, as well as to investigate sample clean-up and recovery, samples of the total cell lysates prepared with the Roche Complete Lysis-M, EDTA-free kit were separated using 1D SDS-PAGE as a preparatory stage, as described elsewhere.13 Briefly, the separations were performed according to the manufacturer’s guidelines using a Mini-PROTEAN 3 Cell (Bio-Rad, Hercules, CA) and 1-mm thick Ready Gel Tris-HCl gels with a 4 to 20% gradient acrylamide composition (Bio-Rad). Precision Plus Protein Standards (Bio-Rad) ranged from 10 to 250 kDa. Prior to gel loading, the protein samples were mixed with a dye solution that contained the reducing agent Bond-Breaker TCEP (Pierce, Rockford, IL) and heated at 95 °C for 4 min. Approximately 3 mg of extracted protein determined by the BCA Protein Assay (Pierce, Rockford, IL) were subjected to SDS-PAGE on two gels (1.5 mg per gel) at a constant voltage of 200 V. Gels were fixed, stained, destained, and then stored until analyzed.13
In-gel Reduction, Alkylation, Digestion, and Extraction of Peptides
Multiple identical lanes were pooled for each of the two gels, and the resulting two gel samples were digested. Details of in-gel reduction, alkylation, digestion, and peptide extraction have been described elsewhere.13 A C18 RP peptide Macrotrap SPE cartridge (Michrom BioResources, Inc., Auburn, CA) was used to desalt the in-gel tryptic digests. Peptides were converted to methyl esters as described above, and the samples were then reconstituted in IMAC loading solution (1:1:1 methanol/acetonitrile/0.01% acetic acid) at a ratio of 100 μL to 100 - 200 μg of peptide. The first biological replicate Roche extract sample was analyzed using LC-LTQ-FT MS while the second biological replicate sample was analyzed using LC-LTQ-Orbitrap MS.
Phosphopeptide Enrichment Using IMAC
Phosphopeptides were enriched using an IMAC protocol that includes advances and optimizations recently summarized by Ross et al.15 with the exception of using thionyl chloride during the methyl esterification process. Also, we employed a custom-packed IMAC Macrotrap cartridge with a 50 μL bed volume (Michrom BioResources, Inc., Auburn, CA) for phosphopeptide enrichment. The column was 1) stripped with 500 μL 50 mM EDTA (adjusted to pH 9 to 10 with ammonium hydroxide) at a flow rate of 50 μL/min; 2) washed with 1000 μL nanopure water at 100 μL/min; 3) activated with 375 μL 100 mM FeCl3 at 25 μL/min; 4) washed to remove excess metal ions with 400 μL 0.1% acetic acid at 50 μL/min; 5) loaded with approximately 1.5 mg sample at 4 μL/min; 6) washed with 400 μL wash buffer (100 mM NaCl, 1% acetic acid, and 25% acetonitrile) at 25 μL/min; 7) re-equilibrated with 300 μL of 0.01% acetic acid; and 8) eluted with 250 μL of 50 mM Na2HPO4 (pH ∼8.5). The eluate was immediately acidified with acetic acid to a pH of ∼4.
RP/Nano-HPLC Separation
Peptide mixtures from HeLa cell extracts were separated using an automated dual-column phosphoproteome nano-HPLC platform assembled in-house. All portions of the separation system that come in contact with peptide mixtures with the exception of the autosampler syringe (but including the valve apparatus and transfer lines) are non-metal to minimize the loss of phosphopeptides. The platform includes two 103-mL syringe pumps (Model 100DM, Teledyne Isco, Inc., Lincoln, NE) controlled using a single series D controller and a 1.5 mL mobile phase mixer, which was built in-house. One pump is dedicated to mobile phase A and is operated at 1000 psi, and the other is dedicated to mobile phase B and is operated at 1500 psi. Eight, 2-position Valco valves (Valco Instruments Co., Houston, TX) are used, including a 6-port injection valve with a 10 μL sample loop, two 4-port valves for mobile phase and mixer purge selection, and a 10-port and two 4-port valves for directing the sample to either of two pairs of SPE and analytical columns. Two 4-port valves are used to connect the pump to either the fluidic system or to a pair of refill reservoirs. With the two-column design, samples can be loaded, desalted and analyzed using one pair of SPE and analytical columns while the other pair is being re-equilibrated, which allows for continuous sample analysis. The SPE pre-columns are prepared from 150 μm i.d., ∼10 cm long fused silica capillaries packed in-house with 5 μm ODS-AQ C18 material (YMC Co., Ltd., Kyoto, Japan) to a bed length of 4 cm. The SPE pre-columns are double fritted (one kasil chemical frit at each end) due to the procedural backwashing of the SPE columns directly after sample loading and prior to analytical column separation. The two analytical separation columns consist of 50 μm i.d. fused silica (Polymicron Technologies Inc., Phoenix, AZ), 40-cm long capillaries packed in-house with 5 μm ODS-AQ C18 reversed phase material. The tips coupled to the columns for electrospray are 10 μm i.d. open tubular fused silica that have been etched with HF for uniform tip bevel and opening.16 The SPE pre-column and tips are connected to the analytical column using PicoClear unions (New Objective, Inc., Woburn, MA). An in-house constructed rack assembly supports the valve and column system and was fitted to a PAL autosampler (Leap Technologies, Carrboro, NC) for automated sample loading and analysis.
Peptide samples were loaded onto the SPE pre-column and backwashed with 0.1 M acetic acid in nano-pure water. A voltage of 2.3 kV is applied at the split ‘tee’ at the head of the column instead of at the union between column and the electrospray ionization (ESI) tip to minimize loss of phosphopeptides. The ESI tips are positioned at the MS inlet, using a set of encoding translation stages (Newport, Irvine, CA). All components of the LC system are controlled by in-house software that runs on a laptop computer that communicates with the various hardware components via a 16-port USB HUB and that triggers MS data acquisition using a contact closure connection.
The HPLC mobile phases consisted of 0.1 M acetic acid in nano-pure water (A), and 70% acetonitrile/0.1 M acetic acid in nano-pure water (B). The system was equilibrated at 1000 psi for 20 min with 100% mobile phase A. Next, an exponential gradient was created by valve switching from pump A to B, which displaced mobile phase A in the mixer with mobile phase B. The gradient was controlled by the split flow (∼9 μL/min) under constant pressure conditions. The final composition of mobile phase B was approximately 70% by the end of the HPLC run (180 min).
LC-LTQ-FT MS/MS
A linear ion trap/Fourier transform hybrid MS was used for product ion spectral dataset collection. Data-dependent datasets were collected for the 10 most abundant species after each high resolution MS scan by the LTQ-FT (100,000 resolution and mass scan range of 400 to 2000 m/z).
LC-LTQ-Orbitrap MS/MS
A linear ion trap/Orbitrap hybrid MS was used for product ion spectral dataset collection. Data-dependent datasets were collected for the 10 most abundant species after each high resolution MS scan by the LTQ-Orbitrap (100,000 resolution and mass scan range of 300 to 2000 m/z). Datasets were also collected with high mass accuracy precursor scans by the LTQ-Orbitrap, data-dependent MS/MS of the top 5 peptides, followed by MS3 of the neutral loss peak in the MS2 scan that was associated with a precursor peak loss corresponding to phosphate loss [i.e., a neutral loss of 32.7 Da (3+), 49.0 (2+), 65.4, and 98.0 (1+)]. To enhance identification of phosphopeptides, datasets were collected following an additional gas phase separation17 within the MS, which entails scanning for shorter, predefined m/z ranges, i.e., 300 to 850, and 750 to 1575, both with the precursor scan at 100,000 resolution.
Peptide Identification and False Discovery Rate Determination
To identify peptides, all data collected from LC-MS/MS analyses (LC-LTQ-FT MS/MS and LC-LTQ-Orbitrap MS/MS) were analyzed using SEQUEST and the following search criteria for phosphorylated peptides: static methyl esterification on D, E, and C terminus of the peptides in conjunction with dynamic phosphorylation of S, T and Y residues; all searched as full tryptic cleavage products. As the precursor masses were collected with high mass accuracy, the SEQUEST parameter file also contained a search criteria cutoff of ± 1.5 Da for the precursor masses. A no enzyme search was performed for the standard extract. Data were searched against the Human International Protein Index (IPI) database (Version 3.20 containing 61,225 protein entries; available at www.ebi.ac.uk/IPI).
To determine the false discovery rate (FDR), the IPI database was searched as a decoy database, i.e., the reversed human IPI was appended to the forward database and included in the SEQUEST search. The FDR was estimated from the forward and reverse (decoy) filtered matches and was calculated as a ratio of two times the number of false positive peptide identifications to the total number of identified peptides.18 For phosphorylated peptide search results (fully tryptic only), the following filtering criteria were applied for an FDR ≤ 5%: 1+ CS, XCorr ≥ 1.4; 2+ CS, XCorr ≥ 2.4; 3+ and 4+ CS, XCorr ≥ 3.3; all charge states with DelCn2 ≥ 0.13. All phosphopeptide filtering criteria included a mass error cutoff within +/- 6.5 ppm. For the standard protein extract the following filtering criteria were applied for an FDR ≤ 5%: 1+ CS, DelCn2 ≥ 0.1, XCorr ≥ 1.5, both partially and fully tryptic ends; 2+ CS, DelCn2 ≥ 0.1, XCorr ≥ 2.2, fully tryptic ends; 2+ CS, DelCn2 ≥ 0.1, XCorr ≥ 4.0, partially tryptic ends; 3+ CS, DelCn2 ≥ 0.1, XCorr ≥ 2.9, fully tryptic ends; 3+ CS, DelCn2 ≥ 0.1, XCorr ≥ 4.6, partially tryptic ends.
High confidence identifications were obtained using the accurate mass and time tag approach and in-house developed programs Viper and MultiAlign that have been described elsewhere.19
Results and Discussion
Protein Extraction and Preparation
An overview of the methodologies used in this study is illustrated in Figure 1. In all methods, normal HeLa cells were lysed prior to protein extraction and solubilization. Key differences included the use of the detergent-based Roche Complete lysis kit versus Trizol lysis and extraction, and incorporation of 1D SDS-PAGE to separate extracted proteins. Ultracentrifugation was used to facilitate removal of nucleic acids from the protein digest in the detergent extraction approach prior to SPE cleanup (i.e., desalting and further removal of nucleic acids). After centrifugation and decanting, a clear gelatinous substance was observed as a pellet on the bottom of the centrifuge tubes comprised of nucleic acids. We observed high recovery of peptides (98%) following ultracentrifugation; however, when ultracentrifugation was performed on the undigested extract, protein loss was greater and ranged from 15% to as high as 48%.
Figure 1.
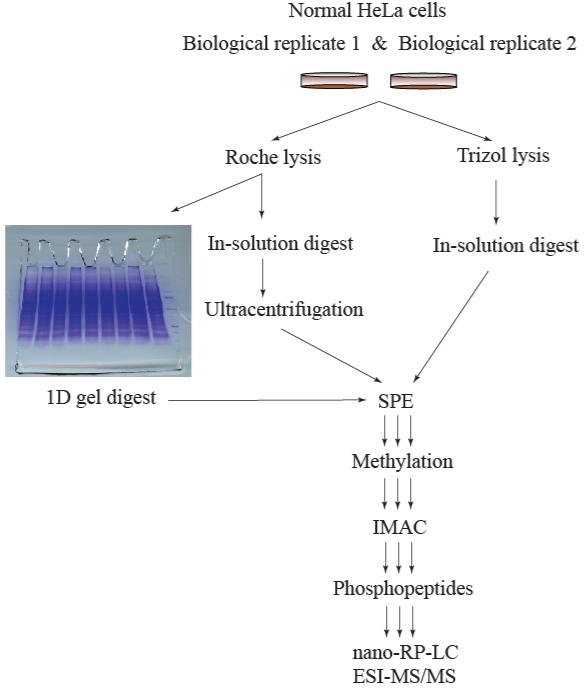
Overview of the methodology studied in the analysis of HeLa cell total proteome coverage. The initial step of the study comprises the lysis of the normal HeLa cells and subsequent protein extraction and solubilization. Key differences include the use of the Roche Complete lysis kit versus Trizol lysis and extraction, and incorporation of 1D SDS-PAGE separation of extracted proteins.
SDS-PAGE was also investigated as an alternative approach for removing nucleic acids.20, 21 A potential advantage of this gel-based approach is the ability to target specific molecular weight ranges of proteins for more comprehensive phosphopeptide identification without additional fractionation prior to digestion and IMAC enrichment. Another potential advantage includes a more efficient tryptic digest due to the enhanced accessibility of the protein backbone denatured into a linear orientation locked within the gel. Major disadvantages include low throughput, the labor intensive aspect of in-gel digestions, and generally low recoveries, i.e., 40.0 ± 16.8%, (n=4). However, the overall recovery of this approach should be comparable to other approaches for comprehensive phosphopeptide identification, since additional losses are also expected to occur during fractionation steps such as SCX that are often required when applying non-gel based approaches. For example, recoveries from SPE used for desalting/detergent clean-up steps were approximately 51.4 ± 15.6% (n=9, includes data from all three approaches).
HeLa Cell Phosphoproteome Methodology Comparison
Table 1 lists the results from phosphoproteomic analyses of the two biological replicates for the Roche Complete in-solution digest method and the Roche Complete in-gel digest method. These results highlight the complementary nature of the two extraction methodologies; a combined total of 651 phosphorylation sites and 597 unique phosphoproteins were identified. Spectra for the 597 phosphopeptides along with SEQUEST identification information are included in the SpectrumLook Software Package (see Supplementary Materials). Of the three types of sample processing procedures (Roche Complete in-solution digest, Roche Complete in-gel digest, and Trizol), the Roche Complete in-solution digest approach yielded the greatest number of phosphorylated protein identifications followed by the in-gel digest approach.
Table 1.
Phosphoproteomic comparison of total HeLa cell lysate methodology
| Biological Replicate 1 | Biological Replicate 2 | |||||||
|---|---|---|---|---|---|---|---|---|
| Number of unique | Roche In-Soln | Roche In-Gel | Trizol | Rep1 Total | Roche In-Soln | Roche In-Gel | Rep2 Total | Total |
| Phosphopeptides | 172 | 143 | 116 | 302 | 153 | 135 | 248 | 380 |
| Phosphorylated sites | 337 | 195 | 222 | 521 | 267 | 179 | 397 | 651 |
| Phosphoproteins | 311 | 294 | 260 | 498 | 313 | 301 | 459 | 597 |
The Venn diagrams in Figure 2 illustrate the overlap in unique phosphopeptides and phosphoproteins between the two extraction methods (Roche in-solution digest and the Trizol extraction) for sample 1. Approximately 57% of the unique phosphorylated peptides (74% of the phosphoproteins) identified in the Trizol sample were also identified in the Roche solution digest sample. This result suggests that the complement of proteins within the two extracts is similar, which is consistent with our observations for other samples prepared using the two methodologies. Unlike Trizol extraction, the Roche lysis approach does not require numerous protein precipitation steps that can result in poor recovery of precipitated proteins, and the good overlap in protein identification supports it as a reasonable alternative to Trizol extraction
Figure 2.
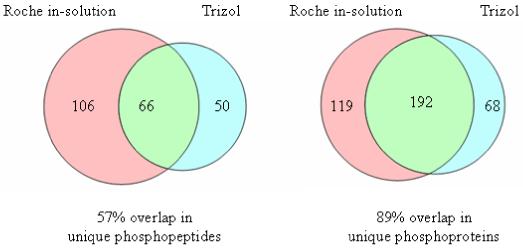
Venn diagrams comparing the overlap in unique phosphorylated peptides and proteins for the samples from the Roche in-solution digest and the Trizol extraction. There was a 57% overlap in unique phosphorylated peptides (left) and an 89% overlap in unique phosphorylated proteins between the two extraction methodologies.
The Babelomics22 bioinformatics suite of tools was used to compare subcellular locations and functions of the phosphorylated proteins identified from samples prepared using the different HeLa cell extraction and processing methods. No significant differences were observed with regard to molecular functions, biological processes, or subcellular component locations of the phosphorylated proteins in samples obtained from the three preparation methods.
Comparison of Phosphoproteome Coverage in Samples from In-solution and In-gel Digests
The analysis of biological replicates provides an opportunity to compare the reproducibility of phosphorylated protein identifications as a function of the method used for extraction and digestion. A set of Venn diagrams in Figure 3 illustrates the extent of overlap in unique phosphopeptide and phosphorylated protein identifications measured between the two biological replicates. An overlap of 53% in phosphopeptides and 64% in phosphoproteins identified between biological replicates is observed for the in-solution digest samples (Fig 3a). Similarly, the overlap between biological replicates for the in-gel digest is 55% for phosphopeptides and 70% for phosphorylated proteins (Fig. 3b). However, the overlap between the in-solution digest of one biological replicate with that of the in-gel digest of the second replicate decreases to 28% for unique phosphopeptides and 40% for phosphorylated proteins, as illustrated in Fig. 3c. When the unique phosphorylated peptides and proteins identified in the in-solution and the in-gel digestion samples are combined, a 64% overlap in phosphopeptides and a 72% overlap in phosphorylated proteins between the two biological replicates are obtained (Fig. 3d). This increase in the number of overlapped phosphopeptides/proteins indicates that these two sample preparation methods provide complementary coverage and in combination offer more comprehensive coverage of the HeLa cell phosphoproteome.
Figure 3.
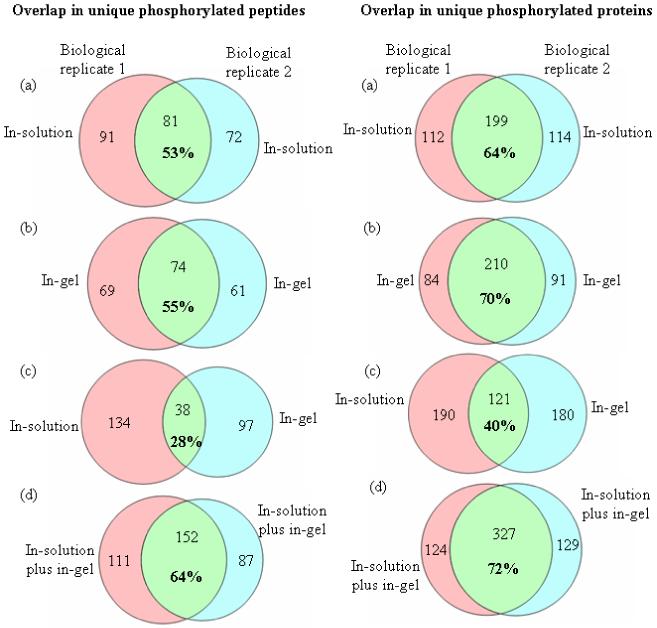
Venn diagrams of the overlap in unique phosphorylated peptides (left), and unique phosphorylated protein identifications (right) between the two biological replicates. The combination of the two sample preparation approaches, Roche in-solution digest and Roche in-gel digest, gives a more comprehensive coverage of the HeLa cell phosphoproteome.
The Effect of Performing Technical Replicates on Phosphoproteome Coverage
To investigate the influence of technical replicates on the phosphoproteome coverage, four technical replicates were obtained by repeatedly collecting nano-RP-LC-MS/MS datasets for each extraction methodology (the Trizol sample was measured and reported for Biological replicate 1 only). The individual dataset identifications (FDR <5%) were then sequentially added, and the total number of unique phosphopeptide identifications was determined.
With each technical replicate, new unique phosphorylated peptides were observed, demonstrating that new information was obtained with each analysis; for example, the number of unique phosphopeptides determined from Biological replicate 1 nano-RP-LC-MS/MS analysis were 96 (dataset 1), 110 (datasets 1-2), 161 (datasets 1-3), and 172 (datasets 1-4). No trends in the number of datasets versus total uniquely identified phosphorylated peptides were apparent from these four technical replicate analyses.
To investigate the contribution of successive technical replicates, quality control samples (peptides from a standard Shewanella extract) that had been analyzed with at least ten technical replicates were plotted versus the number of unique peptide identifications (Fig. 4). The trends for the Shewanella extract analyzed on an LTQ-Orbitrap mass spectrometer (Fig. 4a) and an 11T FTICR mass spectrometer23 (Fig. 4b) demonstrate that up to six technical replicates are required for optimal identifications at the sample complexity analyzed (∼4000 unique peptides per dataset identified). A more complex sample may require additional technical replicates for optimal identification
Figure 4.

(a) Ten technical replicates for a Shewanella extract analyzed on an LTQ-Orbitrap mass spectrometer (∼4000 unique peptides per dataset). (b) Ten technical replicates on an 11T-FTICR mass spectrometer (∼4000 unique peptides per dataset).
Figure 5 summarizes the influence of technical replicates at various stages of the different methods. The bottom of the figure lists the coefficient of variance (CV) for each of the four sets of technical replicates that were collected for each of the three extraction and digest methodologies. The CV value was generated from the aligned and normalized peptide intensities (log based) of the four technical replicates within a subset, keeping only unique phosphorylated peptides (FDR < 5%) identified with an incidence of ≥ 2 observances. The coverage values listed were derived by denoting the 597 phosphoproteins identified by the entire study as being the true population of the phosphoproteome, and then calculating the percent coverage using the identification values listed in Table 1. Note that the coverage, as well as the CV values, is similar for the 20 technical replicates.
Figure 5.
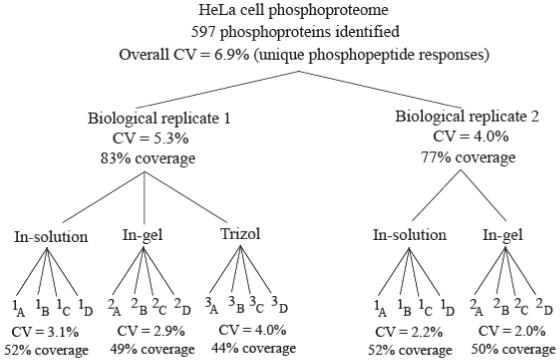
Influence of technical replicates on the different tiers of the study. The bottom tier lists the coefficient of variance (CV) for each of the four sets of technical replicates that were collected by nano-RP-LC-MS/MS. The middle tier lists the percent variance on the biological replicate level at 5.3% and 4.0% for replicates 1 and 2, respectively. The top tier lists the overall variance of the study at 6.9%. Coverage values were derived by denoting the 597 phosphoproteins identified by the study as the true population and calculating a percentage from the identification values listed in Table 1.
The low CV values demonstrate reproducibility within the replicated nano-RP-LC-MS/MS analysis. The percent variance at the biological replicate levels (level 2 of Fig. 5) are also both quite low at 5.3% and 4.0% for Biological replicates 1 and 2, respectively. The final, overall variance of the study resulted in a CV of 6.9% that includes the treatment of 20 technical replicates. In contrast, Wright et al.24 observed an average CV of ± 11% variation at the technical replicate level (triplicate injections) in a protein expression study using iTRAQ labeled peptides followed by capillary HPLC-ESI-qQ-TOF-MS/MS.
Conclusions
Cell lysis and protein extraction and solubilization methods influence both the amount and types of proteins that are identified by MS. Of the three methods investigated in this study (Roche Complete in-solution digest, Roche Complete in-gel digest, and Trizol), solubilization using the Roche Complete lysis kit in conjunction with either in-solution digestion or in-gel digestion gave the highest yield of phosphorylated protein identifications along with good reproducibility between biological replicates. Among the phosphorylated proteins identified from the Roche in-solution digest sample, ∼80% overlapped with those identified from the Trizol sample. The Roche in-solution method also yielded nearly 1.8-fold more non-overlapping phosphoprotein identifications, which supports this method as a good alternative to the Trizol extraction approach. The combined number of phosphoprotein identifications from in-solution digestion and in-gel digestion of the protein extract obtained with the Roche Complete lysis kit illustrates the advantage of combining different sample preparation strategies to obtain greater coverage of a cellular proteome.
The inclusion of biological replicates can confirm observations made in protein identifications, which increases confidence in observed proteome expression studies. Careful choice and execution of sample preparation methodologies allows the attainment of acceptable overlaps of the identified proteome in the biological replicates. While fractionation techniques can be applied to further reduce the sample complexity and increase the phosphoprotein coverage, technical replicates might still be required for comprehensive identifications. The inclusion of four technical replicates in this study, measured with CV < 5% in peptide responses, demonstrated that information is added with the addition of each technical replicate. For a moderately complex protein extract such as the Shewanella standard, six technical replicates appear optimal for information collection; for extracts of greater complexity, more technical replicates may be required.
Supplementary Material
Acknowledgements
This research was supported by NIH grant NS031221 and a grant from the Indiana Elks Charities Inc./Walther Cancer Institute to S.R. and by the NIH National Center for Research Resources (RR018522) to R.D.S. The Proteomics National Center for Research Resource is located at the Pacific Northwest National Laboratory (PNNL) within the Environmental Molecular Sciences Laboratory, a national scientific user facility sponsored by the U.S. Department of Energy (DOE) Office of Biological and Environmental Research. PNNL is operated by Battelle for the DOE under Contract DE-AC05-76RLO 1830.
References
- 1.Chalmers MJ, Kolch W, Emmett MR, Marshall AG, Mischak H. J. of Chromatogr. B. 2004;803:111–120. doi: 10.1016/j.jchromb.2003.09.006. [DOI] [PubMed] [Google Scholar]
- 2.McLachlin DT, Chait BT. Current Opinion in Chemical Biology. 2001;5:591–602. doi: 10.1016/s1367-5931(00)00250-7. [DOI] [PubMed] [Google Scholar]
- 3.Qian WJ, Goshe MB, Camp DG, II, Yu LR, Tang K, Smith RD. Anal. Chem. 2003;75:5441–5450. doi: 10.1021/ac0342774. [DOI] [PubMed] [Google Scholar]
- 4.Garcia BA, Shabanowitz J, Hunt DF. Methods. 2005;35:256–264. doi: 10.1016/j.ymeth.2004.08.017. [DOI] [PubMed] [Google Scholar]
- 5.Salih E. Mass Spectrometry Reviews. 2005;24:828–846. doi: 10.1002/mas.20042. [DOI] [PubMed] [Google Scholar]
- 6.Posewitz MC, Tempst P. Anal. Chem. 1999;71:2883–2892. doi: 10.1021/ac981409y. [DOI] [PubMed] [Google Scholar]
- 7.Cao P, Stults JT. Rapid Commun. Mass Spectrom. 2000;14:1600–1606. doi: 10.1002/1097-0231(20000915)14:17<1600::AID-RCM68>3.0.CO;2-V. [DOI] [PubMed] [Google Scholar]
- 8.Kocher T, Allmaier G, Wilm M. J. Mass Spectrom. 2003;38:131–137. doi: 10.1002/jms.422. [DOI] [PubMed] [Google Scholar]
- 9.Moser K, White FM. J. Proteome Res. 2006;5:98–104. doi: 10.1021/pr0503073. [DOI] [PubMed] [Google Scholar]
- 10.Stover DR, Caldwell J, Marto J, Root R, Mestan J, Stumm M, Ornatsky O, Orsi C, Radosevic N, Liao L, Fabbro D, Moran MF. Clin. Proteomics. 2004;1:069–080. [Google Scholar]
- 11.Yang F, Stenoien DL, Strittmatter EF, Wang JH, Ding LH, Lipton MS, Monroe ME, Nicora CD, Gristenko MA, Tang KQ, Fang RH, Adkins JN, Camp DG, Chen DJ, Smith RD. J. Proteome Res. 2006;5:1252–1260. doi: 10.1021/pr060028v. [DOI] [PubMed] [Google Scholar]
- 12.Ficarro SB, McCleland ML, Stukenberg PT, Burke DJ, Ross MM, Shabanowitz J, Hunt DF, White FM. Nat. Biotechnol. 2002;20:301–305. doi: 10.1038/nbt0302-301. [DOI] [PubMed] [Google Scholar]
- 13.Ham BM, Jacob JT, Cole RB. Anal Bioanal Chem. 2007;387:889–900. doi: 10.1007/s00216-006-1018-9. [DOI] [PMC free article] [PubMed] [Google Scholar]
- 14.de Souza GA, Godoy LMF, Mann M. Genome Biology. 2006;7:R72. doi: 10.1186/gb-2006-7-8-r72. [DOI] [PMC free article] [PubMed] [Google Scholar]
- 15.Ndassa YM, Orsi C, Marto JA, Chen S, Ross MM. J. Proteome Res. 2006;10:2789–2799. doi: 10.1021/pr0602803. [DOI] [PubMed] [Google Scholar]
- 16.Kelly RT, Page JS, Luo Q, Moore RJ, Orton DJ, Tang K, Smith RD. Anal. Chem. 2006;78:7796–7801. doi: 10.1021/ac061133r. [DOI] [PMC free article] [PubMed] [Google Scholar]
- 17.Yi EC, Marelli M, Lee H, Purvine SO, Aebersold R, Aitchison JD, Goodlett DR. Electrophoresis. 2002;23:3205–3216. doi: 10.1002/1522-2683(200209)23:18<3205::AID-ELPS3205>3.0.CO;2-Y. [DOI] [PubMed] [Google Scholar]
- 18.Elias JE, Gygi SP. Nat. Methods. 2007;4:207–214. doi: 10.1038/nmeth1019. [DOI] [PubMed] [Google Scholar]
- 19.Jaitly N, Monroe ME, Vladislav PA, Clauss TRW, Adkins JN, Smith RD. Anal. Chem. 2006;78:7397–7409. doi: 10.1021/ac052197p. [DOI] [PubMed] [Google Scholar]
- 20.Beausoleil SA, Jedrychowski M, Schwartz D, Elias JE, Villen J, Li J, Cohn MA, Cantley LC, Gygi SP. Proc Natl Acad Sci U S A. 2004;101:12130–12135. doi: 10.1073/pnas.0404720101. [DOI] [PMC free article] [PubMed] [Google Scholar]
- 21.de Souza GA, Godoy LMF, Mann M. Genome Biology. 2006;7:R72. doi: 10.1186/gb-2006-7-8-r72. [DOI] [PMC free article] [PubMed] [Google Scholar]
- 22.Al-Shahrour F, Minguez P, Vaquerizas JM, Conde L, Dopazo J. Nucleic Acids Research. 2005;33:W460–W464. doi: 10.1093/nar/gki456. Web Server issue. [DOI] [PMC free article] [PubMed] [Google Scholar]
- 23.Harkewicz R, Belov ME, Anderson DA, Pasa-Tolic L, Masselon CD, Prior DC, Udseth HR, Smith RD. J. Amer. Soc. Mass Spectrom. 2002;13:144–154. doi: 10.1016/S1044-0305(01)00343-9. [DOI] [PubMed] [Google Scholar]
- 24.Gan CS, Chong PK, Pham TK, Wright PC. J. Proteome Res. 2007;6:821–827. doi: 10.1021/pr060474i. [DOI] [PubMed] [Google Scholar]
Associated Data
This section collects any data citations, data availability statements, or supplementary materials included in this article.