

Abstract
Objective
To examine associations between nursing homes' quality and publication of the Nursing Home Compare quality report card.
Data Sources/Study Settings
Primary and secondary data for 2001–2003: 701 survey responses of a random sample of nursing homes; the Minimum Data Set (MDS) with information about all residents in these facilities, and the Nursing Home Compare published quality measure (QM) scores.
Study Design
Survey responses provided information on 20 specific actions taken by nursing homes in response to publication of the report card. MDS data were used to calculate five QMs for each quarter, covering a period before and following publication of the report. Statistical regression techniques were used to determine if trends in these QMs have changed following publication of the report card in relation to actions undertaken by nursing homes.
Principal Findings
Two of the five QMs show improvement following publication. Several specific actions were associated with these improvements.
Conclusions
Publication of the Nursing Home Compare report card was associated with improvement in some but not all reported dimensions of quality. This suggests that report cards may motivate providers to improve quality, but it also raises questions as to why it was not effective across the board.
Keywords: Quality report cards, Nursing Home Compare, long-term care, MDS
Quality report cards have become a major component of initiatives to enhance the quality of the American health care system. In addition to numerous private and state report cards, the Centers for Medicare and Medicaid Services (CMS) now provides web-based reports on the quality of health maintenance organizations (HMOs), nursing homes, home health agencies, hospitals, and renal dialysis clinics (CMS 2006).
The motivation for publishing report cards is the expectation that making information about quality easily accessible to patients will increase the sensitivity of demand for quality, and thus generate positive incentives for providers to invest in quality improvement (Mukamel and Mushlin 2001). Some argue that even in the absence of a demand response to report cards, providers who receive information about their performance relative to their peers will be motivated to improve quality because of professional pride, or if these providers are a nonprofit organization, because of their organizational mission (Gormley and Weimer 1999; Hibbard, Stockard, and Tusler 2005; Robinowitz and Dudley 2006). Thus, the anticipated impact of report cards is three-fold: (1) changing consumers' choices—a demand response; (2) incenting providers to improve quality—a supply response; (3) improving overall quality levels—an equilibrium result. The last two could be subverted if some providers choose responses that improve their published scores, but do not actually improve quality. Such responses typically would include “cream skimming,” i.e., selecting patients who are less frail and sick and therefore likely to have better health outcomes, or deception, i.e., manipulating documentation of data used for report cards (Gormley and Weimer 1999).
There is now a large body of empirical studies examining the demand response, with mixed conclusions (Marshall et al. 2000; Mukamel and Mushlin 2001; Schauffler and Mordavsky 2001; Dafny and Dravnove 2005; Werner and Asch 2005; Jin and Sorensen 2006). Some find no demand response and others find a statistically significant but relatively small response. Although there are important methodological reasons that may explain the inability of these studies to document a strong demand response even if it exists (Mukamel and Mushlin 2001; Mukamel, Weimer, and Mushlin 2007c), these studies do raise concerns that report cards may not generate sufficient incentives to motivate providers to offer higher quality.
There is less direct empirical evidence about providers' responses. Several studies based on surveys or case studies find that report cards spurred providers to improve their scores through enhanced and targeted quality-improvement programs (Scanlon et al. 2001; Hibbard, Stockard, and Tusler 2003; Barr et al. 2006; Mukamel et al. 2007b), although there seems to be high variability in the efficiency of these efforts (Pham, Coughlan, and O'Malley 2006). These studies generally rely on self-reports and as such are susceptible to response bias that is likely to result in overly optimistic conclusions about providers responding favorably to report cards.
A few studies have attempted to ascertain whether reports cards induced cream skimming. Physicians surveyed in Pennsylvania (Schneider and Epstein 1996) and in New York State (Narins et al. 2005), two states that publish physician-level risk-adjusted mortality scores for cardiac procedures, indicated that after report cards were introduced they were less likely to offer care to the most risky patients, because of concerns about the impact on their published scores.
The findings about the impact of report cards on quality levels are also mixed. While mortality rates of CABG patients have declined more in New York than in other states, a decline attributed to the presence of report cards (Peterson et al. 1998), similar trends were found during the same period in Massachusetts (Ghali et al. 1997), a state without a report card, thus raising questions about the causal relationship between the publication of the report card and improved outcomes (Epstein 2006). Some have argued that the improved mortality outcomes in New York State might be due to cream skimming by hospitals and surgeons, rather than true improvement in care (Werner and Asch 2005), although other findings seem to contradict this explanation (Peterson et al. 1998). Evidence about the effectiveness of HEDIS, a quality report card for health plans, suggests that quality has improved since the report was first published (Lied and Sheingold 2001; Trivedi et al. 2005). However, these studies also only document improvement trends in reported measures, and therefore cannot eliminate other explanations for the improvements that may have occurred during the same period. More robust evidence is provided by Hibbard, Stockard, and Tusler (2005), who find that obstetric and cardiac hospital outcomes have improved more for hospitals who participated in a public report card than those in a control group that did not. Moreover, they find more improvement among those who had poor scores in the report.
In this study, we provide evidence regarding the impact of the Nursing Home Compare report card published by CMS since 2002. We focus on the question of whether quality of care has improved following publication of the report. We hypothesize that the report card creates several incentives for nursing homes to take actions to improve quality (Zinn et al. 2008; Mukamel et al. 2007b). First, nursing homes may anticipate that their customers, either patients and their families or their agents (physicians and social workers), will pay attention to reported quality and will, therefore, expect shifts in demand toward the better scoring facilities. This creates incentives to undertake investments in quality improvement. Second, nursing homes may anticipate that state quality regulators will use the reports to identify areas for special attention in their annual inspection of the facility, and may therefore take action to prevent deficiencies. Third, facilities, in particular nonprofit nursing homes that regard provision of high-quality care as an important component of the organizational mission, may use the information in the report to guide quality improvement initiatives. Thus, we expect that following the Nursing Home Compare publication nursing homes have undertaken actions aimed at improving quality, and to the degree that these efforts have been successful, we would expect improvement in the quality measured and reported in the report card relative to the prereport card period. Specifically, we examine changes in five quality measures (QMs), comparing them in the period before publication of the report card to the period following.
To guard against the possibility of incorrectly attributing secular changes in the QMs to the publication of the report card, we examine the changes observed for the postreport period in relation to specific actions reported by nursing homes as taken in response to publication. This addresses the limitations of prior studies that failed to rule out alternative contemporaneous events as causing improvement in quality, and offers more robust evidence about the impact of these reports.
This study also has a more specific contribution because it is the first to investigate the impact of a report card on quality of nursing home care. Studies of report cards to date have focused on health plans, hospitals, or physicians. The response of nursing homes might, however, be different. Nursing homes treat a much more frail and clinically complex population, in a long-term rather than acute-care setting, with different processes of care, and different market conditions, including a much larger involvement of public payers (Mukamel and Spector 2003). All of these factors may differentially affect the effectiveness of report cards in the nursing home setting.
DESCRIPTION OF THE NURSING HOME COMPARE REPORT CARD
The Nursing Home Compare web-based report card was first published by CMS in November of 2002. The initial publication was widely publicized through full-page advertisements in all the major newspapers in the country. In six demonstration states—Colorado, Florida, Maryland, Ohio, Rhode Island, and Washington—an earlier version of the report was published in April of 2002. This early publication was also accompanied by a wide advertising campaign.
The report includes all facilities that are Medicare or Medicaid certified. It provides general information about the facility (e.g., ownership and hospital affiliation), the number of deficiency citations, and the ratio of staff hours to resident days. It includes information about several clinical QMs that are based on residents' health status, such as decline in functional status and prevalence of pressure ulcers and physical restraints. The QMs have changed over time. The first version included 10 measures. In 2004, it was expanded first to 14 and then to 15 measures, and most recently to 19. The QMs underwent extensive study and validation. The final set of QMs that were included in the initial publication, as well as those included in later versions of the report card, were adopted following recommendations by the National Quality Forum (2004). Because of concerns about the accuracy of the QMs when samples are small, CMS does not report a QM if the facility did not have a minimum number of residents eligible for that QM (30 for long-term and 20 for short-term care measures). The report is updated every quarter with new values for the QMs. To view the current version with definitions of all QMs see http://www.medicare.gov/NHCompare/home.asp. A more detailed description of the report card can be found in Zinn et al. (2005).
METHODS
Sample and Data
The study included respondents to a 10 percent random national survey of nursing homes. The sampling frame included all Medicare and Medicaid certified nursing homes that had at least one QM published in the first Nursing Home Compare report in November of 2002: 724 out of 1,502 or 48.2 percent of facilities responded. This is a typical response rate for recent surveys of top management and organizational representatives (Baruch 1999). The survey was conducted in early 2004, about a year after the first publication, and was addressed to the administrator of each facility. It inquired if the facility took any of 20 specific actions as a result of the publication of the report card. The actions (see Table 4) included: (1) initiation of quality improvement activities including development of new quality improvement programs (QIOs), changing priorities of existing programs and requesting help from the state Quality Improvement Organization (QIO); (2) changes in care protocols, development of new protocols, staff training, and reorganization of the work setting to empower staff; (3) changes in resources such as increased staffing or increased wages, reallocation of staff, and purchase of new equipment; and (4) changes in leadership, including medical and nursing directors. The survey also allowed administrators to write in any additional actions. Review of responses to this latter question confirmed that the 20 specific actions listed in the survey covered the gamut of activities undertaken by nursing homes. For a more detailed discussion of the survey see Mukamel et al. (2007b). We excluded 23 nursing homes that reported that they have never reviewed their published QMs, for a final sample of 701 facilities.
Table 4.
Analysis of the Impact of Specific Actionsa
| Action | Percent of Nursing Homes Taking Action (%) | Change in Level Due to Specific Action | ||
|---|---|---|---|---|
| Physical Restraints | Short-term Pain | Pressure Ulcers | ||
| Initiation of quality improvement activities | ||||
| Investigated reasons for scores | 63.3 | −0.75 | −1.17 | 0.43 |
| Changed priorities of existing quality assurance or quality improvement program to focus on QM's | 41.6 | −0.85 | −2.72** | 0.64 |
| Requested help from the QIO | 21.1 | −1.53** | −3.30** | −0.56 |
| Started an organized quality improvement program (e.g., TQM, CQI) | 17.8 | 0.47 | −4.33*** | 0.82* |
| Changes in protocols and work organization | ||||
| Changed existing care protocols | 36.3 | −0.42 | −4.70*** | 1.14** |
| Trained staff specifically for targeted QM | 36.3 | 0.60 | −4.57*** | 0.78* |
| Developed new care protocols | 28.9 | −1.60** | −0.05 | 0.17 |
| Changed work organization to empower workers | 19.0 | −0.76 | −2.83* | 1.20** |
| Revised job descriptions | 11.6 | 0.66 | −2.35 | 0.64 |
| Changes in resources | ||||
| Purchased new technology/equipment | 13.7 | −0.89 | −2.55* | 1.15** |
| Hired more staff | 9.6 | 1.22 | −0.39 | 0.99* |
| Reallocated staff from other activities to care related to this QM | 9.4 | 0.50 | 2.83 | 0.50 |
| Increased wages/benefits | 8.9 | −2.03** | −6.03*** | −0.08 |
| Other initiatives to hire/retain staff | 7.8 | −0.82 | −2.31 | 0.87 |
| Contracted for more staff | 1.7 | 0.87 | −3.11 | −0.84 |
| Changes in leadership | ||||
| Changed nursing director | 4.6 | −0.22 | −4.24* | 2.02*** |
| Changed ownership | 0.6 | 8.04*** | −4.59 | −0.15 |
| Changed medical director | 0.3 | −7.59*** | −2.81 | −2.91 |
| Other activities | ||||
| Increased private pay prices | 4.0 | −3.71*** | −3.02 | 1.08 |
| Changed the type of patient admitted | 3.6 | 0.44 | 5.92*** | 0.96 |
p≤.001.
.001<p≤.01.
.01<p<.05.
Survey responses were merged with QMs for each nursing home. As the analyses examined trends in these QMs from periods before and following publication of the reports, we calculated the QMs using the CMS algorithm and information from the Minimum Data Set (MDS) for the period 2001–2003. The MDS is a patient-level data set with information about the sociodemographic characteristics of each individual, the type of stay (long- or short-term stay), and health status, including activities of daily living (ADLs), pressure ulcers, diagnoses, weight changes, behavioral patterns, communication limitations, and specific treatments such as the use of physical restraints or catheters. These data are submitted by each nursing home to CMS every quarter and are used by CMS to create the published QMs. We calculated five of the QMs included in the initial publication for each quarter for the periods before and following the initial publication. These five measures were chosen from the original list of 10 QMs because they are recognized as important indicators of quality of care (Berlowitz et al. 2001; Rosen et al. 2001) and they could be reproduced consistently to match the QMs in the CMS reports. They included:
For Long-Stay Residents
The percent of residents whose ADLs changed in the past quarter by at least two units—either a change of one level in two ADLs or a change of two levels in one ADL.
The percent of residents with new infections.
The percent of residents with pressure ulcers.
The percent of residents who are physically restrained daily.
For Short-Stay Residents
The percent of residents with moderate pain daily or excruciating pain at any frequency.
The CMS algorithm applies specific exclusion criteria for each measure to determine the denominator, thus providing some degree of risk adjustment (Mukamel et al. 2007a). For example, the ADL measure excludes individuals who were comatose or have end-stage disease. The exact specification of each measure is described in the User Manual published by CMS (Abt Associates Inc. 2002). The QMs were calculated for each quarter based on the CMS-defined target assessment for that quarter.
Analyses
We performed analyses of changes in time trends in the QMs, comparing the trends pre- and postpublication. If the report card had an impact on quality, then following publication we expect either new trends toward improvement or acceleration of existing trends. The trend line could exhibit either a change in the slope or a one-time change in the level of the QM around the time of publication.
We performed three types of analyses. The first was a simple pre/postdesign that treated all nursing homes the same, irrespective of whether they reported taking any actions in response to the report card. Because this design cannot rule out changes in the QMs during the same period due to reasons other than publication of the reports, we then refined these models by allowing the changes in the QMs to vary depending on the actions that nursing homes reported as having undertaken in response to the publication of the report. All analyses were repeated separately for each of the five QMs.
Analysis I: The first set of models we estimated were
where QMi,t is the QM for facility i in quarter t. P is an indicator variable that obtains the value 1 in the postpublication period and 0 in the prepublication period. P captures changes in the levels of QMs. Pt is an interaction of time with the pre/postpublication variable and it captures changes in the slope of the trend line postpublication. D is a vector of facility fixed effects variables that capture any facility characteristics likely to influence the QMs in addition to the publication of the reports (e.g., the level of quality at the facility before publication).
Analysis II: The second set of models we estimated were
where Ni is the number of actions taken by facility i in response to the publication of the report card. We included both linear and quadratic terms for N to allow for diminishing returns to the number of actions taken. These models exclude the Pt interaction term because the models estimated in step I did not identify a significant change in the slope of the trend line for any of the QMs. This model allows the postperiod response to vary depending on the number of actions the facility took.
Analysis III: The third set of models we estimated were
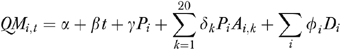 |
where Ai,k is a dichotomous variable indicating if facility i undertook any of 20 specific actions. It obtained the value 1 for each action k that was undertaken and was 0 otherwise. These models allow us to identify those specific actions that were significantly associated with changes in the QMs.
RESULTS
Table 1 provides descriptive statistics for the nursing homes included in the analyses, as well as survey nonresponders. While there were significant differences in terms of ownership, with responders more likely to be private nonprofit then for-profit, there were, with one exception, no significant differences in terms of quality at the time of the first publication of the report card. The one exception is a significantly higher infections QM, i.e., lower quality, for responders.
Table 1.
Descriptive Statistics and Comparison of Survey Responders and Nonresponders
| Responders (N=701) | Nonresponders (N=778) | |
|---|---|---|
| Quality† | ||
| Number of deficiencies | 6.0 (5.1) | 6.4 (5.3) |
| Percent of residents with loss of ability in basic daily living | 16.4 (8.2) N=612 | 15.8 (8.0) N=647 |
| Pressure ulcers | 8.3 (5.0) N=638 | 8.3 (5.2) N=676 |
| Physical restraints | 8.8 (9.9) N=638 | 9.2 (9.6) N=676 |
| Infections | 15.4 (7.5)**N=625 | 14.2 (7.4) N=645 |
| Pain for short-stay residents | 25.3 (14.2) N=479 | 27.1(15.4) N=512 |
| Region | ||
| New England (%) | 7 | 7 |
| Middle Atlantic (%) | 15 | 12* |
| East North Central (%) | 19 | 19 |
| West North Central (%) | 15 | 13 |
| South Atlantic (%) | 12 | 13 |
| East South Central (%) | 7 | 9 |
| West South Central (%) | 10 | 12 |
| Mountain (%) | 5 | 4 |
| Pacific (%) | 10 | 11 |
| Ownership | ||
| For-profit (%) | 48 | 57*** |
| Nonprofit—private (%) | 43 | 36*** |
| Nonprofit—public (%) | 9 | 7 |
| Other characteristics | ||
| Hospital based (%) | 11 | 14 |
| Percent occupancy | 87 (13) | 84 (16) |
| Number of certified beds | 112 (70) | 105 (65) |
Standard deviations for continuous variables in parentheses.
p<.001.
.001≤p<.01.
.01≤p<.05.
Sample size for each QM was different because not all facilities had a score reported.
Figure 1 shows (unadjusted) trends for each one of the QMs for all nursing homes in the nation for whom the QM was reported (samples ranging from about 9,000 to 15,000 depending on the QM). Each chart shows the national averages for the QM for four quarters before publication and four quarters after publication. Inspection of these data suggests that a change in trend toward improvement (i.e., lower levels) may have occurred for two of the QMs: physical restraints for long-term residents and pain for short-term residents.
Figure 1.

Trends in Quality Measures Pre- and Postreport Publication
Table 2 presents the results of the first set of analyses, modeling changes in the trends in QMs over time in the pre- and postpublication periods. Note that because all QMs measure adverse outcomes, negative changes indicate improvement. None of the five QMs exhibited a significant change in the slope of the trend line between the pre- and the postpublication period. Two of the QMs—physical restraints for long-term residents and pain for short-term residents—exhibited an improvement (decline) in the level of the QM at the time of publication for both the demonstration and the nondemonstration states. Surprisingly, the pressure ulcers QMs showed a significant deterioration (increase) in the QM level in the nondemonstration states. The two other QMs, based on ADLs and infections, did not exhibit any significant changes in trend.
Table 2.
Impact of Publication of Report Card on the QMs: A Pre/Post Analysisa
| QM | Time Trend | Change in Level | |||
|---|---|---|---|---|---|
| Pre | Post | Change | Demonstration States | Nondemonstration States | |
| Physical restraints | −0.32*** | −0.24*** | 0.09 | −0.92** | −0.74* |
| Short-term pain | −0.05 | 0.07 | 0.12 | −2.78*** | −2.54*** |
| Pressure ulcers | −0.07 | −0.02 | 0.05 | 0.47 | 0.56* |
| ADLs | −0.11 | −0.04 | 0.07 | 0.48 | 0.62 |
| Infections | −0.17 | 0.02 | 0.18 | −0.14 | 0.23 |
p≤.001.
.001<p≤.01.
.01<p<.05.
Table 3 presents the results of the second set of analyses, where the post response is allowed to differ by the number of actions taken. Note that because the previous analyses did not identify a significant change in the slope of the trend lines, these and the next set of analyses no longer include a Pt interaction term. The table shows the change in level calculated for facilities that reported having taken 1, 2, 3, 4, or 5 actions following the reports. There was significant improvement in the physical restraint QM for facilities taking two or more actions and in the pain QM for all facilities taking actions. The improvement increased as the number of actions increased. As suggested by Table 2, there was deterioration in the pressure ulcers QM but the level of deterioration was unrelated to the number of actions. There were no significant changes in the level of the ADL and infection QMs.
Table 3.
Analysis of the Impact of Number of Actions (N) Takena
| QM | Time Trend | Change in Level | ||||
|---|---|---|---|---|---|---|
| N = 1 | N = 2 | N = 3 (Median # of Actions) | N = 4 | N = 5 | ||
| Physical restraints | −0.27*** | −0.62 | −0.89** | −1.09*** | −1.22*** | −1.29*** |
| Short-term pain | 0.03 | −2.38*** | −2.48*** | −2.58*** | −2.68*** | −2.77*** |
| Pressure ulcers | −0.04 | 0.52* | 0.52* | 0.52* | 0.52* | 0.52* |
| ADLs | −0.06 | 0.64 | 0.40 | 0.22 | 0.12 | 0.08 |
| Infections | −0.05 | 0.16 | 0.06 | −0.01 | −0.06 | −0.08 |
p≤.001.
.001<p≤.01.
.01<p<.05.
Table 4 reports the change in the QM level as a function of each of 20 specific actions that nursing homes reported as having taken in response to the publication for the three QMs for which we found an overall significant change in level. The table also shows the percent of facilities that reported taking each action. For physical restraints, we found seven actions that were significantly (p<.05) associated with an improvement in the QM and one that was significantly associated with deterioration in the QM. For short-term pain, we found 11 actions that were significantly associated with improvement and one that was associated with deterioration, and for pressure ulcers we found six that were associated with deterioration and two that were associated with improvement. We note that by chance alone, at the .05 significance level, we would expect only one action to be significantly associated with a change in the level for each QM.
There did not seem to be consistent patterns between the actions that were significantly associated with improvement in physical restraint and those that were significantly associated with improvement in pain. However, many of the actions that led to improvement in the pain QM were associated with deterioration in the pressure ulcers QM for long-stay residents, in particular actions related to changes in care protocol, staff training, and changes in work organization.
DISCUSSION
In this paper, we report on the impact of the publication of the Nursing Home Compare quality report card. Results are based only on the five QMs included in this analysis and not all the measures included in the report card. We conclude that two of the five QMs we studied did not exhibit a significant change following publication while three did. While we find that these changes are linked to actions undertaken by the nursing homes in response to the publication, we note that the risk adjustment of the CMS QMs is limited, and therefore some of the changes may result from unaccounted changes in patient risks.
Several observations are noteworthy. First, all the changes we find are one-time changes in the level of the QMs around the time of publication and not changes in the slope of the trend line, suggesting that the publication effect was concentrated over a short period of time. For the physical restraint QM, we observe an improvement trend even before the publication, a trend that continues following the publication. The improvement attributable to the publication, of about 1 percentage point, is roughly equivalent to three times the annual decrement in the QM observed both before and after the publication, which was about 0.3 percentage points annually. Thus, the one time impact of the publication generated an improvement equivalent to about 3 years of improvement absent report cards.
Short-term pain did not exhibit an improvement trend either before or after the publication. It did, however, exhibit a much larger one-time effect than the physical restraint QM, of about 2.5 percentage points. Nonetheless, in relative terms, the impact of the report cards on these two QMs is similar. Considering the starting prevalence level of these two QMs, physical restraints at around 10 percent and pain at around 26 percent, the improvement in both is about a 10 percent decrease relative to the starting point.
The third QM to show a response to the publication, pressure ulcers, surprisingly showed deterioration rather than improvement. This finding, while counterintuitive at first glance, might reflect the early impact of attempts to improve quality. Testimonials from quality improvement professionals in nursing homes suggest that frequently the initial response to a perceived quality problem is to focus staff attention on it, which in turn leads to better documentation, and hence higher recorded rates of adverse outcomes. QMs may actually show a decrease in quality if staff records the presence of adverse outcomes more accurately. Once past this stage, quality improvement efforts may have the desired impact on QMs.
Why are the findings heterogeneous? Why do we find evidence that the report cards affect some QMs but not others? Nursing homes may be more knowledgeable about the process changes required to improve some areas or they may have already had a head start, as in the case of physical restraints, where an improvement trend seems to have begun before the publication. Perhaps for some QMs 1 year may not provide sufficient lead time for demonstrable change. This is plausible considering the range of activities that are required to achieve measurable improvement: understanding what contributes to a poor score, identification of corrective plan, implementation of such a plan, and finally having a sufficient cumulative impact to show an improvement in the measured QM. Our study evaluated the impact of report cards 1 year following publication. A study of more recent trends in the QMs could help determine if longer lead times are required before the full effect of report cards can be observed. It could also test our explanation of the observed deterioration in the pressure ulcers QM as the potential precursor to improvement.
Despite the improvement we observe in the physical restraint and the pain QMs, we note that both are still at nonnegligible levels a year following the publication of the report cards. Physical restraints levels average about 8 percent and pain for short-term residents average 23 percent. While it is probably unrealistic to expect zero prevalence rates for these outcomes, one might hope that outcomes can improve beyond these levels. Current data (shown on Nursing Home Compare, August 1, 2007) indicate further improvement since our study period. By 2007, the national average rates declined to 6 percent for physical restraints and to 21 percent for pain for short-term residents. The improvements since 2004 are slow relative to the one-time effect of the report cards, but it does suggest that nursing homes are continuing to improve the care they provide. Further study is required to determine whether these longer-term improvements can also be attributed to the report card or whether they were spurred by other activities designed to improve quality, such as state technical assistance programs (White et al. 2003) or the QIOs sponsored by CMS (Rollow et al. 2006).
We also note that several different actions were associated with improvement, suggesting that nursing homes may have chosen among different successful paths to better quality. Differences in the nature of quality problems across nursing homes may have favored different solutions. It is also possible that cultural and other organizational differences may have influenced choice of action (Shortell, Bennett, and Byck 1998; Zinn et al. 2005). Further research is required to gain insights into what type of actions are more likely to be undertaken by what type of nursing home, and which are more likely to be more successful in which environment.
The fact that not all actions led to improvement may reflect lack of knowledge among nursing homes as to what actions might be most effective. This would suggest that publication of quality report cards should be accompanied by educational efforts to help nursing homes identify the best ways to improve care. CMS has contracted with the QIOs to provide such help if requested, and indeed seeking help from a QIO in this study was associated with improvement, similar to findings by Rollow et al. (2006). Our findings suggest that efforts of the QIOs might be expanded and that nursing homes should be encouraged to avail themselves of these resources.
The coefficients for the number of actions (see Supplementary Material Table S2) were negative for the linear term and positive for the squared term. The negative linear coefficient implies that the more actions the facility undertook the more its quality improved. The squared positive coefficient indicates diminishing returns: as the number of actions increased the marginal improvement decreased. This suggests that a judicious use of resources should lead nursing homes to adopt only a few corrective actions, rather than attempting to adopt a large number of activities, possibly spreading their resources too thin.
In summary, the analyses presented here suggest that the Nursing Home Compare quality report card led to improvement in some but not all areas. By linking specific actions undertaken by nursing homes in response to the report card to changes in the QMs, we provide more robust evidence about the potential of report cards to influence quality improvement activities compared with prior studies, as well as information about actions and areas of care that are more likely to be influenced by report cards. The policy implications, as the findings, are mixed. Report cards seem to be effective in enhancing some aspects of quality. However, because they are not effective across the board they cannot be relied upon as the only policy instrument aimed at quality improvement.
Acknowledgments
The authors gratefully acknowledge funding from the National Institutes on Aging, Grant # AG023177.
Disclosures: None.
Disclaimers: None.
Supplementary material
The following supplementary material for this article is available online:
Estimated Model: 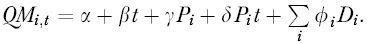
Estimated Model: 
Estimated Model: 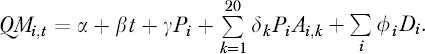
REFERENCES
- Abt Associates Inc. Quality Measures for National Public Reporting: User's Manual, September, 2002 (v1.1) Cambridge, MA: U.S. Department of Health & Human Services, Center for Medicare & Medicaid Services; 2002. [Google Scholar]
- Barr J K, Giannotti T E, Sofaer S, Duquette C E, Waters W J, Petrillo M K. Using Public Reports of Patient Satisfaction for Hospital Quality Improvement. Health Services Research. 2006;41(3, part 1):663–82. doi: 10.1111/j.1475-6773.2006.00508.x. [DOI] [PMC free article] [PubMed] [Google Scholar]
- Baruch Y. Response Rate in Academic Studies—A Comparative Analysis. Human Relations. 1999;52(4):421–38. [Google Scholar]
- Berlowitz D R, Brandeis G H, Anderson J J, Ash A S, Kader B, Morris J N, Moskowitz M A. Evaluation of a Risk-Adjustment Model for Pressure Ulcer Development Using the Minimum Data Set. Journal of American Geriatrics Society. 2001;49(7):872–6. doi: 10.1046/j.1532-5415.2001.49176.x. [DOI] [PubMed] [Google Scholar]
- Centers for Medicare and Medicaid Services. “Nursing Home Quality Initiatives” [accessed on December 1, 2006]. Available at http://www.cms.hhs.gov/QualityInitiativesGenInfo/
- Dafny L S, Dravnove D. Cambridge, MA: National Bureau of Economic Research; Do Report Cards Tell Consumers Anything They Don't Already Know? The Case of Medicare HMOs. [DOI] [PubMed] [Google Scholar]
- Epstein A J. Do Cardiac Surgery Report Cards Reduce Mortality? Medical Care Research and Review. 2006;63(4):403–26. doi: 10.1177/1077558706288831. [DOI] [PubMed] [Google Scholar]
- Ghali W A, Ash A S, Hall R E, Moskowitz M A. Statewide Quality Improvement Initiatives and Mortality after Cardiac Surgery [See Comments] Journal of the American Medical Association. 1997;277(5):379–82. [PubMed] [Google Scholar]
- Gormley W T, Weimer D L. Organizational Report Cards. Cambridge, MA: Harvard University Press; 1999. [Google Scholar]
- Hibbard J H, Stockard J, Tusler M. Does Publicizing Hospital Performance Stimulate Quality Improvement Efforts? Health Affairs (Millwood) 2003;22(2):84–94. doi: 10.1377/hlthaff.22.2.84. [DOI] [PubMed] [Google Scholar]
- Hibbard J H, Stockard J, Tusler M. Hospital Performance Reports: Impact on Quality, Market Share, and Reputation. Health Affairs. 2005;24(4):1150–60. doi: 10.1377/hlthaff.24.4.1150. [DOI] [PubMed] [Google Scholar]
- Jin G Z, Sorensen A T. Information and Consumer Choice: The Value of Publicized Health Plan Ratings. Journal of Health Economics. 2006;25(2):248–75. doi: 10.1016/j.jhealeco.2005.06.002. [DOI] [PubMed] [Google Scholar]
- Lied T R, Sheingold S. HEDIS Performance Trends in Medicare Managed Care. Health Care Financial Review. 2001;23(1):149–60. [PMC free article] [PubMed] [Google Scholar]
- Marshall M N, Shekelle P G, Leatherman S, Brook R H. The Public Release of Performance Data: What Do We Expect to Gain? Journal of the American Medical Association. 2000;283(14):1866–74. doi: 10.1001/jama.283.14.1866. [DOI] [PubMed] [Google Scholar]
- Mukamel D, Glance L G, Li Y, Weimer D, Spector W D, Zinn J S, Mosqueda L. Does Risk Adjustment of the CMS Quality Measures for Nursing Homes Matter? Medical Care. 2007a doi: 10.1097/MLR.0b013e31816099c5. in press. [DOI] [PMC free article] [PubMed] [Google Scholar]
- Mukamel D, Spector W D, Zinn J S, Huang L, Weimer D, Dozier A. Nursing Homes' Response to the Nursing Home Compare Report Card. Journal of Gerontology Series B: Psychological Sciences and Social Sciences. 2007b;62(4):S218–25. doi: 10.1093/geronb/62.4.s218. [DOI] [PubMed] [Google Scholar]
- Mukamel D, Weimer D, Mushlin A. Intrepreting Market Share Changes as Evidence for Effectiveness of Quality Report Cards. Medical Care. 2007c;45(12):1227–32. doi: 10.1097/MLR.0b013e31812f56bb. [DOI] [PubMed] [Google Scholar]
- Mukamel D B, Mushlin A I. The Impact of Quality Report Cards on Choice of Physicians, Hospitals and HMOs: A Midcourse Evaluation. Joint Commission Journal on Quality Improvement. 2001;27(1):20–7. doi: 10.1016/s1070-3241(01)27003-5. [DOI] [PubMed] [Google Scholar]
- Mukamel D B, Spector W D. Quality Report Cards and Nursing Home Quality. Gerontologist. 2003;43(special issue 2):58–66. doi: 10.1093/geront/43.suppl_2.58. [DOI] [PubMed] [Google Scholar]
- Narins C R, Dozier A M, Ling F S, Zareba W. The Influence of Public Reporting of Outcome Data on Medical Decision Making by Physicians. Archives of Internal Medicine. 2005;165(1):83. doi: 10.1001/archinte.165.1.83. [DOI] [PubMed] [Google Scholar]
- National Quality Forum. National Voluntary Consensus Standards for Nursing Home Care: A Consensus Report. Washington, DC: National Quality Forum; 2004. [Google Scholar]
- Peterson E D, DeLong E R, Jollis J G, Muhlbaier L H, Mark D B. The Effects of New York's Bypass Surgery Provider Profiling on Access to Care and Patient Outcomes in the Elderly. Journal of the American College of Cardiology. 1998;32(4):993. doi: 10.1016/s0735-1097(98)00332-5. [DOI] [PubMed] [Google Scholar]
- Pham H H, Coughlan J, O'malley A S. The Impact of Quality-Reporting Programs on Hospital Operations. Health Affairs (Millwood) 2006;25(5):1412–22. doi: 10.1377/hlthaff.25.5.1412. [DOI] [PubMed] [Google Scholar]
- Robinowitz D L, Dudley R A. Public Reporting of Provider Performance: Can Its Impact Be Made Greater? Annual Review of Public Health. 2006;27:517–36. doi: 10.1146/annurev.publhealth.27.021405.102210. [DOI] [PubMed] [Google Scholar]
- Rollow W, Lied T R, McGann P, Poyer J, Lavoie L, Kambic R T, Bratzler D W, Ma A, Huff E D, Ramunno L D. Assessment of the Medicare Quality Improvement Organization Program. Annals of Internal Medicine. 2006;145(5):342–53. doi: 10.7326/0003-4819-145-5-200609050-00134. [DOI] [PubMed] [Google Scholar]
- Rosen A, Wu J, Chang B H, Berlowitz D, Rakovski C, Ash A, Moskowitz M. Risk Adjustment for Measuring Health Outcomes: An Application in VA Long-Term Care. American Journal of Medical Quality. 2001;16(4):118–27. doi: 10.1177/106286060101600403. [DOI] [PubMed] [Google Scholar]
- Scanlon D P, Darby C, Rolph E, Doty H E. The Role of Performance Measures for Improving Quality in Managed Care Organizations. Health Services Research. 2001;36(3):619–41. [PMC free article] [PubMed] [Google Scholar]
- Schauffler H H, Mordavsky J K. Consumer Reports in Health Care: Do They Make a Difference? Annual Review of Public Health. 2001;22:69–89. doi: 10.1146/annurev.publhealth.22.1.69. [DOI] [PubMed] [Google Scholar]
- Schneider E C, Epstein A M. Influence of Cardiac-Surgery Performance Reports on Referral Practices and Access to Care. New England Journal of Medicine. 1996;335:251. doi: 10.1056/NEJM199607253350406. [DOI] [PubMed] [Google Scholar]
- Shortell S M, Bennett C L, Byck G R. Assessing the Impact of Continuous Quality Improvement on Clinical Practice: What It Will Take to Accelerate Progress. Milbank Quarterly. 1998;76(4):593–624. doi: 10.1111/1468-0009.00107. 510. [DOI] [PMC free article] [PubMed] [Google Scholar]
- Trivedi A N, Zaslavsky A M, Schneider E C, Ayanian J Z. Trends in the Quality of Care and Racial Disparities in Medicare Managed Care. New England Journal of Medicine. 2005;353(7):692–700. doi: 10.1056/NEJMsa051207. [DOI] [PubMed] [Google Scholar]
- Werner R M, Asch D A. The Unintended Consequences of Publicly Reporting Quality Information. Journal of the American Medical Association. 2005;293(10):1239–44. doi: 10.1001/jama.293.10.1239. [DOI] [PubMed] [Google Scholar]
- White A, Manard B, Moore T, Hurd D, Landino C, Harvell J. State Nursing Home Quality Improvement Programs: Site Visit and Synthesis Report. Cambridge, MA: Abt Associates Inc; 2003. [Google Scholar]
- Zinn J S, Spector W D, Hsieh L, Mukamel D B. Do Trends in the Reporting of Nursing Home Compare Quality Measures Differ by Nursing Home Characteristics? Gerontologist. 2005;45(6):720–30. doi: 10.1093/geront/45.6.720. [DOI] [PubMed] [Google Scholar]
- Zinn J S, Spector W D, Weimer D, Mukamel D. Strategic Orientation and Nursing Home Response to Public Reporting of Quality Measures: An Application of the Miles and Snow Typology. Health Services Research. 2008 doi: 10.1111/j.1475-6773.2007.00781.x. in press. [DOI] [PMC free article] [PubMed] [Google Scholar]
Associated Data
This section collects any data citations, data availability statements, or supplementary materials included in this article.
Supplementary Materials
Estimated Model:
Estimated Model:
Estimated Model: