

Abstract
Myo1b is a widely expressed myosin-I isoform that concentrates on endosomal and ruffling membranes and is thought to play roles in membrane trafficking and dynamics. It is one of the best characterized myosin-I isoforms and appears to have unique biochemical properties tuned for tension sensing or tension maintenance. We determined the key biochemical rate constants that define the actomyo1b ATPase cycle at 37 °C and measured the temperature dependence of ATP binding, ADP release, and the transition from a nucleotide inaccessible state to a nucleotide accessible state (k-alpha). The rate of ATP binding is highly temperature sensitive, with an Arrhenius activation energy 2-3 fold greater than other characterized myosins (e.g, myosin-II and myosin-V). ATP hydrolysis is fast, and phosphate release is slow and rate limiting with an actin dependence that is nearly identical to the steady-state ATPase parameters (Vmax and KATPase). ADP release is not as temperature dependent as ATP binding. The rates and temperature dependence of ADP release are similar to k-alpha suggesting a similar structural change is responsible for both transitions. We calculate a duty ratio of 0.08 based on the biochemical kinetics. However, this duty ratio is likely to be highly sensitive to strain.
Myosin-Is are the single-headed, low-molecular-weight members of the myosin superfamily that are proposed to link cellular membranes with the actin cytoskeleton. Myosin-I isoforms bind phosphoinositides directly (1) and function in several important cellular processes, including membrane retraction, macropinocytosis, phagocytosis, membrane trafficking, cell-cell adhesion, and mechanical signal transduction (2-8).
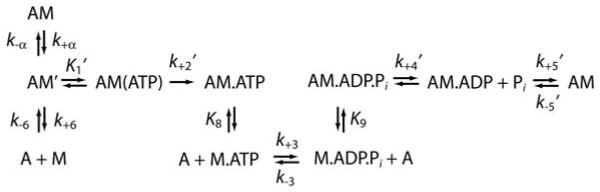
The biochemical mechanisms of long-tail and short-tail myosin-I isoforms have been studied (9-12), with myo1b being the best characterized short-tail isoform (13-15). The myo1b ATPase mechanism (Scheme 1) is notable in that (a) the maximum rate of ATP binding and population of the myo1bIQ weakly-bound states is > 30-fold slower than myosin-II, (b) nucleotide-free myo1b is in equilibrium between a state that binds nucleotide (AM′) and a state that does not bind nucleotide (AM), (c) the rate of transition between AM and AM′ (k+α) states is similar to the rate of ADP release (k+5′), and (d) ADP release is slow and is accompanied by a rotation of the lever arm.
Scheme 1.
We proposed that the strikingly slow actomyo1b ATPase rate constants are a property of all short-tail myosin-I isoforms (11, 16). However, it has been shown recently that short-tailed Dictyostelium myosin-IE (not to be confused with vertebrate long-tail myo1e (11)) has kinetic rate constants that are substantially faster than vertebrate short-tail isoforms (12). Because of experimental convenience, nearly all kinetic characterizations of myosin ATPase cycles have been performed at temperatures between 18 – 25 °C, which is the range in which Dictyostelium cells live. There is no complete kinetic characterization of any vertebrate unconventional myosin at physiological temperature (37 °C), and it is possible that myosin-I rate constants are highly temperature sensitive. Therefore, it is important to determine the kinetic lifetimes of the myo1b intermediates at physiological temperature.
In this study, we determined the rate constants that define the rat myo1b ATPase cycle at 37 °C, and we provide the first measurement of the rates of ATP hydrolysis and phosphate release for myo1b. Our characterization has allowed us to calculate the myo1b duty ratio at physiological temperature and determine thermodynamic parameters of ATP binding and ADP release.
Materials and Methods
Reagents, Proteins, and Buffers
2′-Deoxy-methyanthraniloyl-labeled ATP (mantATP) was synthesized as described (17). ADP and ATP concentrations were determined spectrophotometrically before each experiment by absorbance at 259 nm, ε259 = 15,400 M-1cm-1. MantATP concentrations were determined by absorbance at 255 nm, ε255 = 23,300 M-1cm-1 (17).
Rabbit skeletal muscle actin was prepared and gel filtered (18). Actin concentrations were determined by absorbance at 290 nm, ε259 = 26,600 M-1cm-1. Actin was labeled with pyrenyl iodoacetamide (pyrene-actin) and gel filtered (19). All actin was stabilized with a molar equivalent of phalloidin (Sigma). Calmodulin (CaM) was expressed in bacteria and purified as described (20).
Steady-state and transient experiments were performed in KMg25 buffer (10 mM Mops, 25 mM KCl, 1 mM MgCl2, 1 mM EGTA, 1 mM DTT). The pH of the buffer was adjusted to pH 7.0 at 25 °C, and changed by less than 0.1 °C when the temperature was increased to 37 °C. Free CaM (1 μM) was included in all solutions that contain myo1bIQ (21).
Myosin-I Expression and Purification
A construct consisting of the motor domain and first IQ motif of rat myo1b (myo1bIQ) was expressed in Sf9 cells and purified as described (21). The concentration of myo1bIQ was determined using the Coomassie Plus reagent (Pierce) using bovine serum albumin (BSA) as a standard. Based on previous work that validates myosin active-site concentrations (9, 10, 22, 23), BSA is an appropriate protein standard. Final stock concentrations were typically 5 – 10 mg/ml, and were stored at -20 °C in 50% glycerol. Preparations of four liter cultures yielded 4 – 15 mg of protein.
Kinetic Measurements
Transient kinetic measurements were made with an Applied Photophysics (Surrey, U.K.) SX.18MV stopped-flow. A 400 nm long-pass filter (Oriel) was used to monitor pyrene (λex = 365 nm) and mantATP (λex = 295 nm) fluorescence. The time courses in the figures show the average of 1 - 4 individual traces. Transients were fitted to exponential functions using the software supplied with the stopped-flow. Unless stated otherwise, all concentrations are given as final after mixing.
Solutions of actomyo1b contained apyrase (0.01 U/mL) when loaded into the stopped flow to ensure the mixtures were free of contaminating ADP and ATP. This apyrase concentration was high enough to remove contaminating nucleotide, but not high enough to interfere with the kinetic measurements. Solutions used for determining the rate of association of myo1bIQ with pyrene-actin included 0.3 U/mL apyrase.
Transient phosphate (Pi) release was measured by stopped-flow using the coupled assay system containing the fluorescently labeled mutant of the phosphate binding protein (PiBP) using an excitation wavelength of 425 nm and a 440 nm long-pass filter (24, 25). To remove contaminating phosphate, the instrument lines were incubated with 1 mM 7-methylguanosine and 0.2 U/mL nucleoside phosphorylase overnight. Stopped-flow solutions contained 100 μM 7-methylguanosine and 0.004 U/mL nucleoside phosphorylase. Measurements were made in sequential mixing mode at 37 °C. Myo1bIQ (10 μM) was mixed with 5 μM ATP in the first mix and aged for 7 s, resulting in concentrations of 5 μM myo1bIQ and 2.5 μM ATP. Myo1bIQ and ATP was then mixed with actin, resulting in final concentrations of 2.5 μM myo1bIQ, 1.25 μM ATP, and 0 – 80 μM actin. PiBP was included in all solutions, and was present at a final concentration of 5 μM after mixing. Errors reported are standard errors in the fits.
Kinetic modeling was performed using the reaction outlined in scheme 1, where A is actin and M is myosin. The temperature dependence of the rates of ATP binding and ADP release were analyzed according to the Arrhenius relation:
| (eq.1) |
where R is the gas constant (8.31451 J·mol-1K-1), T is the temperature in Kelvin, Ea is the activation energy, and A is the pre-exponential factor. The standard enthalpy change of the isomerization of the AM to AM′ states (Kα) was determined from a van't Hoff plot:
| (eq.2) |
ΔH° is the enthalpy and ΔS° is the entropy.
Results
Myo1bIQ Binding to Actin Filaments
A ∼75% fluorescence quenching upon strong binding of myo1bIQ to pyrene-actin allowed us to monitor the association of myo1bIQ with actin (k-6; Scheme 1). Time courses of myo1bIQ binding to actin at 37 °C follow single exponentials, and the observed rates depend linearly on the actin concentration (Figure 1). Data were modeled as:
Figure 1. Kinetics of myo1bIQ association with actin filaments.

(Top) Actin concentration dependence of the observed rate (kobs) of pyrene-actin binding to myo1bIQ in KMg25 at 37 °C. A 5:1 actin to myo1bIQ ratio was maintained for each actin concentration. The solid line is a linear fit to the data. (Bottom) Time course of pyrene-actin fluorescence increase after mixing 2.0 μM pyrene-actomyo1bIQ with 100 μM unlabeled actin (final concentrations). The smooth line is the best fit of the data to a single exponential rate (kobs= A(1-e-k·t)).
where A* represents the unquenched fluorescent state of pyrene-actin. A linear fit to the data yields an apparent second-order rate constant of k-6 = 8.2 ± 0.32 μM-1s-1 (Table I).
Table 1.
Rate and Equilibrium Constants for the Myo1b ATPase Cycle at 37 °C.a
| Actin Binding | Phosphate Release | ||
|
|
|
||
| k+6 (s-1) | 0.0044 ± 0.00010b | k+4′ (s-1) | 0.58 ± 0.056g |
| k-6 (μM-1s-1) | 8.2 ± 0.32b | K9 (μM) | 53 ± 9.8g |
| K6 (nM) | 0.54 ± 0.024c | ||
| ADP Release | |||
|
|
|||
| ATP Binding | K5′ (μM) | 0.84 ± 0.068b | |
|
|
|||
| 1/K1′ (μM) | 330 ± 25b | k+5′ (s-1) | 6.7 ± 0.064b |
| k+2′ (s-1) | 500 ± 15b | k-5′ (μM-1 s-1) | 8.0 ± 0.65c |
| K1′k+2′ (μM-1 s-1) | 1.5 ± 0.12c | ||
| K1′k+2′ (μM-1 s-1) | 1.2 ± 0.041b,d | Nucleotide-Free Isomerization Step | |
|
|
|||
| K1′k+2′ (μM-1 s-1) | 0.64 ± 0.020e | Kα | 3.7 ± 0.65b |
| k+α (s-1) | 13 ± 1.0b | ||
| ATP Hydrolysis | k-α (s-1) | 3.5 ± 0.67c | |
|
|
|||
| k3app (s-1) | 41 ± 4.9f | ||
KMg25 (10 mM MOPS (pH 7.0), 25 mM KCl, 1 mM EGTA, 1 mM DTT, 1 mM MgCl2, 37 °C) + 1 μM CaM.
Pyrene-actin fluorescence
Calculated
Determined from a linear fit of the data at low ATP concentrations
Light scattering in the presence of mantATP
MantATP
Phosphate-binding protein.
The rate of dissociation of myo1bIQ from pyrene-actin (k+6; Scheme 1) was measured by competition with 50-fold excess of unlabeled actin (Figure 1). The time course fit a single exponential function with a rate k+6 = 0.0044 ± 0.00010 s-1 (Table I). The actomyo1bIQ dissociation constant (K6) calculated from the dissociation and association rates (k+6/k-6) is K6 = 0.54 ± 0.024 nM (Table I).
ATP-Induced Population of the Weakly-Bound States
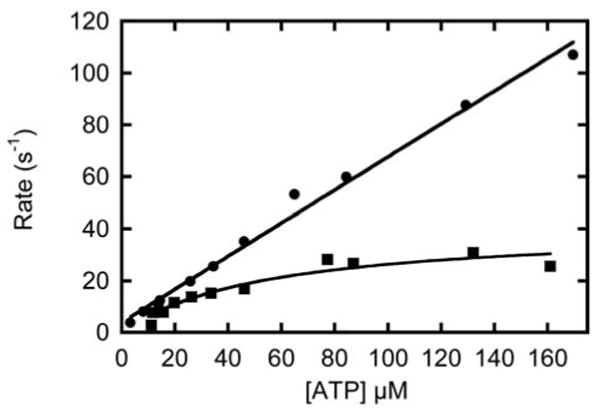
Pyrene-actin fluorescence was used to measure the rate of ATP binding and population of the weakly bound states at 10 – 37 °C. Mixing actomyo1bIQ with ATP resulted in a transient increase in pyrene-actin fluorescence. No lag phase was present, and the transients were best fit to the sum of two exponential rates with positive amplitudes (Figure 2). The rates of the fast phases were hyperbolically related to the ATP concentration (Figure 3, left column), whereas the rates of the slow phases were independent of ATP concentrations greater than 500 μM (Figure 3, center column).
Figure 2. Temperature dependence of ATP binding to actomyo1bIQ.

Pyrene-fluorescence transients obtained by mixing 1.0 μM actomyo1bIQ with 60 μM ATP at 10 – 37 °C.
Figure 3. MgATP induced population of weakly bound actomyo1bIQ states.

Pyrene-fluorescence transients obtained by mixing 1.0 μM actomyo1bIQ with various ATP concentrations at 10 – 37 °C were fitted to double exponential functions (kobs= Afast(1-e-kfast·t) + Aslow(1-e-kslow·t)). The rates of the (left column) fast phases and (center column) slow phases are plotted as a function of ATP concentration. (Right column) Normalized amplitudes of the (●) fast and (■) slow phases are plotted as a function of ATP concentration. The solid lines through the data in the left column are the best fits of the rates of the fast phases to eq. 3.
Geeves et al (14) modeled the fast phase of the increase in pyrene-actin fluorescence as ATP binding to the AM state and subsequent population of the AM.ATP state (K1′k+2′), and proposed that the slow phase reports the transition from a nucleotide-insensitive AM state to a AM′ state that can bind ATP (k+α) as follows:
where A* represents the unquenched fluorescent state of pyrene-actin. We analyzed the ATP dependence of the fast phase as:
| (eq.3) |
where, K1′ is a rapid equilibrium and k+2′ is a rate-limiting isomerization to the high fluorescence AM.ATP state. Values for K1′ and k+2′ at 10 – 37 °C are given in Table 1. K1′ is relatively insensitive to temperature, while k+2′ varies > 80-fold between 10 – 37 °C. An Arrhenius plot of K1′k+2′ is linear and yields an activation energy (Ea) of 111 kJ/mol (Figure 4; Table 3).
Figure 4. Temperature dependence of ATP binding and ADP release.

Arrhenius plots of the natural log of the rates of (top) ATP binding (K1′k+2′) and (center) ADP release (k+5′) versus inverse temperature (283 - 310 K) for (●) myo1bIQ, (■) myosin-II (28), (♦) myosin-V (30), and (×) myosin-VI (30). The center plot also includes the temperature dependence of (○) k+α for myo1bIQ Solid lines are linear fits of the data to the Arrhenius equation (eq. 1) yielding Ea's given in Table 3. (Bottom) van't Hoff plot of Kα showing non-linearity at temperatures > 31 °C. The solid line is a linear fit of the 283 - 304 K data to the van't Hoff equation (eq. 2), yielding ΔH° = 81 kJ/mol.
Table 3.
Thermodynamic Parameters for ATP Binding, ADP Release, and k+α
| Temperature Dependence of ATP Binding | |||
|
| |||
| Ea for K1′k+2′ (kJ/mol) | Ea for k+2′ (kJ/mol) | ||
|
|
|||
| aMyo1bIQ | 111 | 124 | |
| bMyosin-II | 42.4 | N.D. | |
| cMyosin-V | 35.8 | 74.9 | |
| cMyosin-VI | 47.5 | 33.8 | |
| Temperature Dependence of k+5′ and k+α′ | |||
|
| |||
| Ea (kJ/mol) | |||
|
|
|||
| aMyo1bIQ (k+ α) | 89.1 | ||
| aMyo1bIQ (k+ 5′) | 103 | ||
| cMyosin-V (k+5′) | 83.3 | ||
| cMyosin-VI (k+5′) | 58.6 | ||
At high ATP concentrations (> 500 μM), the rate of the slow phase reports the isomerization of AM to AM′ (k+α), and the ratio of the amplitudes (Figure 3, right column) of the fast phase to the slow phase reports the equilibrium constant between AM and AM′ (14). Values for Kα, k+α, and k-α at 10 – 37 °C were determined by averaging points acquired at ATP concentrations > 1 mM at each temperature (Table 2). Kα varies ∼10-fold, while k+α ranges from 0.53 s-1 at 10 °C to 13 s-1 at 37 °C (Table 2). An Arrhenius plot of k+α is linear with an Ea of 89.1 kJ/mol (Figure 4; Table 3). At low ATP concentrations, the rate of the slow phase shows an apparent ATP concentration dependence. This dependence is due the fact that the slow rate of ATP binding at low ATP concentrations is ≤ k+α.
Table 2.
Temperature Dependence of ATP Binding and ADP Releasea
| 37 °C | 31 °C | 25 °C | 18 °C | 10 °C | |
|---|---|---|---|---|---|
|
|
|||||
| 1/K1′ (μM) | 330 ± 25 | 420 ± 15 | 380 ± 10 | 260 ± 26 | 250 ± 53 |
| k+2′ (s-1) | 500 ± 15 | 240 ± 3.7 | 82 ± 0.86 | 23 ± 0.85 | 5.7 ± 0.28 |
| K1′k+2′ (μM-1s-1)b | 1.5 ± 0.12 | 0.57 ± 0.022 | 0.22 ± 0.062 | 0.088 ± 0.0094 | 0.023 ± 0.0050 |
| Kα | 3.7 ± 0.65 | 5.6 ± 0.25 | 3.2 ± 0.077 | 1.3 ± .024 | 0.55 ± 0.092 |
| k+α (s-1) | 13 ± 1.0 | 9.3 ± 1.0 | 4.3 ± 0.35 | 1.7 ± 0.023 | 0.53 ± 0.0071 |
| k-α (s-1)b | 3.5 ± 0.67 | 1.7 ± 0.19 | 1.3 ± 0.11 | 1.3 ± 0.030 | 0.96 ± 0.16 |
| k+5′ (s-1) | 6.7 ± 0.064 | 3.9 ± 0.036 | 1.8 ± 0.014 | 0.59 ± 0.0041 | 0.16 ± 0.0011 |
KMg25 (10 mM MOPS (pH 7.0), 25 mM KCl, 1 mM EGTA, 1 mM DTT, 1 mM MgCl2) plus 1 μM CaM.
Calculated
ATP Hydrolysis
Binding of mantATP to myo1bIQ does not result in a fluorescence change when the mant fluorophore is excited directly (13). However, we detect a fluorescence change when the mantATP is excited by energy transfer from the intrinsic tryptophans of myo1bIQ. The rate of the fluorescence transient is mantATP dependent at concentrations < 50 μM, with a maximum rate of 41 ± 4.9 s-1 (Figure 5). We propose this maximum rate to be the rate of ATP hydrolysis (k3app = k+3 + k-3):
Figure 5. Rate of ATP hydrolysis by myo1bIQ as measured by mantATP fluorescence.
(■) MantATP concentration dependence of the rate of change in mant fluorescence upon binding and fluorescence energy transfer from the intrinsic tryptophans of myo1bIQ at 37 °C. (●) Rate of actomyo1bIQ dissociation as a function of mantATP as measured by light scattering at 37 °C.
where M.ADP.Pi* is the high fluorescence state.
The increase in mant fluorescence is not due to the ATP binding (K1′k+2′) or actomyo1bIQ dissociation (k8) steps. We monitored the rate of mantATP-induced actomyo1b dissociation by light scattering and found the dissociation rate to be linearly related to all mantATP concentrations tested (Figure 5). A linear fit of the data yields a rate of mantATP binding (K1′k+2′ = 0.64 ± 0.02 μM-1s-1; Table 1). This mantATP-induced dissociation is ∼ 2-fold slower than ATP-induced dissociation as measured by pyrene-actin fluorescence (1.5 ± 0.081 μM-1s-1; Table 1).
Phosphate Release
Fluorescently-labeled phosphate-binding protein (PiBP) was used to measure directly the rate of phosphate release (k+4′) in sequential-mix, single-turnover, stopped-flow experiments (11, 22, 24, 26). Myo1bIQ was mixed with ATP, aged 7 s to allow for ATP binding and hydrolysis, and mixed with actin (Figure 6). After the 7 s ageing time, we expect all ATP to bound to myosin and hydrolyzed, with the M.ADP.Pi state as the predominant intermediate (Scheme 1). PiBP was included with the myo1bIQ and the actin to prevent transients due to phosphate released during the aging time or phosphate contamination in the actin. In the absence of actin, the rate of phosphate release was too slow to measure on the time-scale of the experiment (< 0.01 s-1). However, the time courses of phosphate release were single exponentials at all actin concentrations tested and did not show lag or rapid-burst phases (Figure 6). The absence of a linear phase confirmed that the experiments report a single turnover. The actin concentration dependence of the observed rate (kobs) was modeled as:
Figure 6. Steady-state ATPase rate and phosphate release from myo1bIQ.

(Top, ●) Actin dependence of the steady-state ATPase rate of myo1bIQ in KMg25 measured using the NADH-coupled assay at 37 °C. Data is from (21). (Top, ■) Actin dependence of the rate of phosphate release (k4′) from 2.5 μM myo1bIQ in the presence of 0 – 80 μM actin, 1.25 μM ATP, and 5 μM PiBP (concentrations after mixing). The solid line is a fit of the data to eq. 4. Each point is the average of 1 – 3 transients. (Bottom) Time course of transient Pi release from 2.5 μM myo1bIQ after mixing with 1.25 μM ATP, aging for 7 s, and mixing with 40 μM actin in a sequential mix, single turnover experiment in KMg25 at 37 °C. The smooth curve is a single exponential fit to the data (kobs= A(1-e-k·t)).
| (4) |
where K9 is a rapid equilibrium step and k+4′ is irreversible in the absence of free phosphate (Scheme 1) (27). The actin-dependent rate of phosphate release is hyperbolic with K9 = 53 ± 9.8 μM and k+4′ = 0.58 ± 0.056 s-1. The maximum rate of phosphate release (k+4′) is the same as the maximum steady-state rate of ATP turnover (Vmax = 0.6 ± 0.1 s-1), and the affinity of the M.ADP.P for actin (K9) is the same as the KATPase determined in steady-state experiments (50 ± 20 μM; Figure 6) (21). Therefore, the Pi release step is the rate-limiting step in the steady-state ATPase cycle.
ADP Release
The rate of ADP release (k+5′) was determined by ATP-induced dissociation of myo1bIQ from pyrene-actin at 10 – 37 °C:
When myo1bIQ active-sites are saturated with ADP, ATP binding is rate-limited by the slow dissociation of ADP (13, 22). ADP (30 μM final concentration) was incubated with 150 nM pyrene-actomyo1bIQ (final concentration) and mixed to 1 mM ATP (Figure 7, top). Transients were acquired on a split time-scale to ensure a fast phase was not being overlooked. Transients at 30 μM ADP were best fit by single exponential functions and had rates that ranged from 0.16 s-1 at 10 °C to 6.7 s-1 at 37 °C (Figure 7; Table 2). An Arrhenius plot of the data is linear and yields an Ea of 103 kJ/mol (Figure 4; Table 3). The rates and temperature dependence of k+5′ are similar to those determined for k+α (Tables 2 & 3).
Figure 7. ADP release from actomyo1bIQ.

(Top) Temperature dependence of the rate of the pyrene-actin fluorescence increase after mixing 1 mM ATP with 0.15 μM actomyo1bIQ equilibrated with 30 μM ADP. Transients were acquired at 10, 18, 25, 31, and 37 °C. The first 50 ms of the traces were acquired at a higher sampling rate, resulting in larger scatter of the points. Transient acquired in the presence of 30 μM ADP were best fit by single exponential functions. (Bottom) Normalized amplitude of the slow phase obtained by fitting pyrene transients to double exponential functions as a function of ADP concentration at 37 °C. The solid line is a fit of the data to a hyperbola.
The affinity of actomyo1bIQ for ADP (K5′) was determined at 37 °C (Figure 7, bottom). In the presence of non-saturating concentrations of ADP, the transient is the sum of two exponential rates. The rate of the slow component reports the rate of ADP release (k+5′), and the fast phase represents ATP binding to the nucleotide free sites (K1′k+2′). The affinity of the actomyo1bIQ for ADP was determined by monitoring the change in the relative amplitude of the slow phase (Figure 7, bottom; (15)). A hyperbolic fit to the data yields an affinity, K5′ = 0.84 ± 0.068 μM (Table 1).
Discussion
ATP Binding
We confirmed previous results (13-15) showing the apparent second-order rate constant for ATP binding to actomyo1bIQ to be much slower than other characterized myosins at ambient temperature (Table 2). Actomyo1bIQ binds ATP ∼30-fold slower than skeletal muscle myosin-II at 18 °C (Figure 4; (28)). However, at 37 °C, myo1bIQ binds ATP only 5-fold slower than skeletal muscle myosin-II, and binds ATP faster than long- and short-tail myosin-I isoforms from Acanthamoeba (9) and Dictyostelium (12, 29) at the physiological temperatures of these organisms.
An Arrhenius plot of the rate of ATP binding (K1′k+2′) to actomyo1bIQ yields an Ea of 111 kJ/mol, which is 2.5-fold greater than determined for myosins-II and -VI and 3-fold greater than determined for myosin-V (Figure 4; Table 3). This monstrous temperature dependence is the greatest reported for any myosin and highlights the importance of determining rate constants at physiological temperature when correlating kinetics with biological function. The isomerization step (k+2′) is responsible for the temperature dependence of the overall reaction, as is reflected in the similar activation energies for the steps associated with K1′k+2′ and k+2′ (Table 3).
The equilibrium constant K1′ changes less than 2-fold between 10 – 37 °C (Table 2), supporting the assignment of the AM(ATP) state as a collision complex. This property is similar to the initial binding steps of myosins –II and –V, but differs from myosin-VI, which has ∼ 15-fold weaker K1′ (30). The initial ATP binding step for myosin-VI is not a true collision complex, but is best modeled by a rapid isomerization between a nucleotide-sensitive state and a nucleotide-insensitive state, similar to the much slower transition (kα; Scheme 1) reported for myo1b (30). The sequence of “loop 1” of the myo1b motor domain has been shown to modulate this transition (15), thus it is plausible that this region also plays a role in regulating a similar transition in other myosins.
AM to AM′ transition
The maximum rate of ATP binding (k+2′) is 143-fold faster than the transition from the nucleotide accessible state (AM′) to the nucleotide inaccessible state (AM) at 37 °C (k-α; Table 1). Therefore, the AM state (Scheme 1) is not significantly populated during steady-state ATP hydrolysis.
The rates and equilibrium constants that define the AM to AM′ transition depend on the temperature to a lesser extent than ATP binding (Figure 4; Table 3). A van't Hoff plot of Kα is linear from 10 – 31 °C with a break occurring at 31 °C (Figure 4). The slope between 10 – 31 °C yields an enthalpy (ΔH°) of 81 kJ/mol. There is high experimental confidence in the 37 °C point, since it is the result of multiple transients acquired at two ATP concentrations. Thus, the non-linearity in the plot is likely due to a change in the standard molar heat capacity (ΔCP°) of actomyo1bIQ. Changes in ΔCP° indicate a significant conformational change in the protein as it approaches physiological temperatures (30).
ATP Hydrolysis
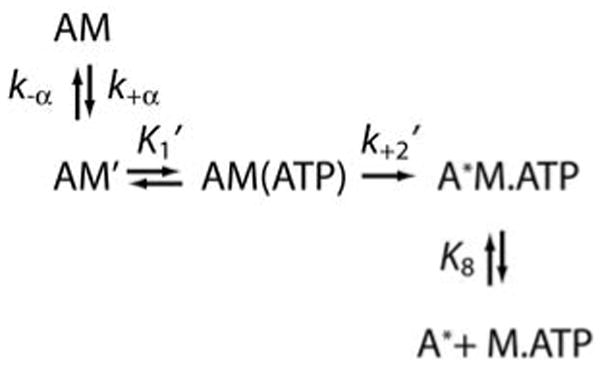
We propose that the change in fluorescence of mantATP, excited by fluorescence resonance energy transfer, is due to a conformational change in the myosin that positions the active site to catalyze ATP hydrolysis (Scheme 4). Muscle myosins show a similar change in fluorescence as a result of an environmental change around tryptophan 510 (31, 32), and an equivalent tryptophan is present in myo1b. We were unable to measure a change in tryptophan fluorescence directly in the presence of actin because of the low signal to noise at 37 °C and the presence of a high fluorescence background from the actin.
Scheme 4.

The observed fluorescence change is not due to mantATP binding (K1′k2′) or actomyo1bIQ dissociation (k8), since light scattering measurements indicate that the rate does not saturate at high mantATP concentrations (Figure 5). Additionally, this fluorescence change is not reporting a conformational change due to phosphate release (k+4′), since it is > 10-fold faster than the rate-limiting step. Therefore, the fluorescence change is most likely the conformational change that limits the rate of ATP hydrolysis (31, 32).
Phosphate Release
The actin-concentration dependence of phosphate release (K9 = 53 ± 9.8 μM and k+4′ = 0.58 ± 0.056 s-1; Table 1) is identical to the actin-concentration dependence of the steady-state ATPase activity (KATPase = 50 ± 20 μM and Vmax = 0.6 ± 0.1 s-1; (21)). Therefore, phosphate release is the rate-limiting step, and the predominant steady-state intermediates are the M.ADP.Pi and AM.ADP.Pi states.
The rate of phosphate release from actomyo1bIQ is much slower than other characterized myosins, even when one considers physiological temperatures. For example, phosphate release from activated Acanthamoeba myosin-Ic = 24 s-1 (26), myosin-V > 100 s-1 (22, 33), and skeletal muscle myosin-II = 75 s-1 (24). It is not clear why myo1b evolved to have a slow rate of phosphate release, but it is likely that the motor is kinetically tuned to optimally sense tension allowing for force-dependent changes in its duty ratio (see below).
ADP Release
The rate of ADP release (k+5′) from myo1bIQ is slow at all assayed temperatures (Table 2). An Arrhenius plot yields an Ea of 103 kJ/mol, which is comparable to other myosins that have slow rates of ADP release (Figure 4; Table 3), suggesting that the ADP release mechanisms for these myosins are similar.
The kinetic rates and Ea of the AM to AM′ transition are remarkably similar to the rates and Ea of ADP release (Tables 2 and 3), suggesting a similar structural change is responsible for both transitions. Recent work provides evidence that a common structural element of myo1b modulate both the rate of ADP release and kα (15). Therefore, it is likely that k+5′ and k+α are reporting the same structural transition, which in the case of ADP release, includes a rotation of the myo1b lever arm. As pointed out by Geeves et al (14), in the presence of a load that resists lever arm rotation, the rate of k-α may increase and k+α may decrease to such an extent that the AM state becomes a predominant steady-state intermediate (see below).
Duty ratio
The duty ratio is defined as the fraction of the total ATPase cycle time that an individual motor is attached to actin (16). We can calculate the duty ratio of myo1b at 37 °C using the rate constants obtained in our kinetic analysis (Table 1). Since the rate of ADP release limits exit from the strong binding states, and the rate of Pi release limits the rate into the strong binding states (and all other rates are significantly faster), the duty ratio of myo1b under high ATP and actin concentrations can be defined as
| (5) |
which yields a duty ratio of 0.08. Therefore, at physiological ATP (2.2 mM) and ADP (12 μM) concentrations (34) at 37 °C in the absence of load, we expect the M.ADP.Pi and AM.ADP.Pi states to be the predominant steady-state intermediates with the mole fraction of the AM.ADP and AM′ states to be less than 0.1. This finding is consistent with previous reports that myosin-I isoforms are low duty ratio motors (for review, (16)).
Generally, myosins with low duty ratios work at high concentrations to move rapidly relative to actin filaments (e.g., skeletal muscle myosin-II), while those with high duty ratios work in low numbers to move processively along actin filaments (e.g., myosin-V). However, it has been proposed that the attachment lifetimes of some myosin-I isoforms, including myo1b, are highly sensitive to load, with resistive loads proposed to dramatically increase the actin attachment lifetime (13) and duty ratio (10). This prediction is based on the slow rate of ADP release and the ∼ 30° rotation of the long lever arm that occurs after the force-generating powerstroke that accompanies ADP release (35).
If we assume a rigid myo1b lever arm, and we assume that the powerstroke must be completed before ADP is released, we estimate the effect of force on the duty ratio of myo1b (36-38),
| (6) |
where k+5,force′ is the rate of ADP release in the presence of external force, F is the external force, d is the distance the end of the lever arm travels upon release of ADP, and kbT is thermal energy (4.3 pN·nm at 37 °C). Assuming d = 5.5 nm (35), a plot of the duty ratio as a function of force shows that the duty ratio of myo1b is greater than 0.5 at resisting forces as low as 2 pN. If d = 5.5 nm is an underestimate, and is equal to 10 nm under high calmodulin concentrations (21), the duty ratio is ∼0.5 at 1 pN and > 0.8 at 2 pN (Figure 8). Although this simulation is a rough estimate of the force-dependence of the duty ratio, it supports the proposal that myo1b (and likely myo1a and myo1c) are motors well designed for tension maintenance and tension sensing (10, 13, 35, 39). It is interesting to note that alternative splicing within the myo1b lever arm results in isoforms with four, five, or six IQ motifs, and thus may be a mechanism for tuning the strain-dependence of the myo1b duty ratio (21). Depending on the stiffness of the lever arm, more energy may be required to rotate the longer splice isoforms to a position that allows ADP to be release, and thus may slow exit from the strong binding state (13).
Figure 8. Calculated duty ratio as a function of force.

Duty ratios of myo1b calculated as a function of force for two different values of d (see eqs. 5 & 6 and text). Positive forces correspond to pulling back on the lever arm, and negative forces correspond to pushing the lever arm forward.
Recent single-molecule investigations show that the lifetimes of actin-bound myosin intermediates are affected by loads imposed on the lever arm (36-38). Because the myo1b lever arm is 2-3 fold longer than the myosin-II lever arm, and the rate of ADP release from myo1b is significantly slower than from myosins -II and –V, we predict that low resisting forces will more dramatically increase the lifetimes of the strong-binding states of myo1b than myosins-II or -V.
Relationship to other myosin-I isoforms
Myosin-I isoforms can be broadly divided into long-tail and short-tail classes based on the sequences of their motor and tail domains (16). Both classes follow a common ATPase pathway and have low duty ratios (< 0.1), but rate constants that define the pathways vary by > 10-fold. Based on previous studies, we predicted that all short-tail isoforms have slow rate constants (long intermediate lifetimes), and all long-tail isoforms have fast rate constants (short intermediate lifetimes) (11). These kinetic differences provide insight into the function of the isoforms. For example, the long lifetimes of the force-bearing intermediates of the short-tail isoforms are likely important for proposed tension-sensing and structural roles (16).
A recent report shows Dictyostelium myosin-IE (Dmyo1e), a short-tail isoform, has rate constants significantly faster at 20 °C than vertebrate short-tail isoforms measured at the same temperature (12). We show in this study that many of the myo1bIQ rate constants are of similar magnitude to Dmyo1e when the rates are compared at the respective physiological temperatures of each organism. For example, ATP binding to and ADP release from actomyo1bIQ at 37 °C are within 4-fold of Dmyo1e at 20 °C. Given these similarities, large kinetic differences are still present. Most notably, phosphate release from actomyo1bIQ at 37 °C is 15-fold slower than the steady-state ATPase rate of Dmyo1e.
Given the variation in rate constants within the short-tail subclass, it does not appear that one can predict precisely the lifetimes of the biochemical intermediates based on the myosin-I subclass alone. However, it is clear that all characterized short tail isoforms have a relatively slow rate of ADP release, a nucleotide-insensitive actin-bound state, and a low ADP coupling ratio (K5′/K5; (40)) as measured previously for myo1b (13), supporting the prediction that these isoforms are tuned for tension-sensing or tension-maintenance (10, 11, 13, 39).
Scheme 2.

Scheme 3.
Scheme 5.

Acknowledgments
We thank Dr. Enrique De La Cruz (Yale University) for helpful discussions, and Dr. Howard White (Eastern Virginia Medical School) for phosphate binding protein.
Abbreviations
- A
Actin
- AM
actomyosin
- CaM
calmodulin
- Dmyo1e
Dictyostelium myosin-IE
- mantATP
2′-deoxy-methyanthraniloyl-labeled ATP
- M
myosin
- myo1bIQ
expressed myo1b protein construct containing the motor domain and a single IQ motif with bound calmodulin
- PiBP
fluorescently labeled phosphate binding protein
Footnotes
EMO was supported by grants from the National Institutes of Health (GM57247 and AR051174). JHL was supported by a training grant from the National Institute of Arthritis and Musculoskeletal and Skin Diseases (AR053461).
References
- 1.Hokanson DE, Ostap EM. Myo1c binds tightly and specifically to phosphatidylinositol 4,5-bisphosphate and inositol 1,4,5-trisphosphate. Proc Natl Acad Sci U S A. 2006;103:3118–23. doi: 10.1073/pnas.0505685103. [DOI] [PMC free article] [PubMed] [Google Scholar]
- 2.Ruppert C, Kroschewski R, Bahler M. Identification, characterization and cloning of myr 1, a mammalian myosin-I. J Cell Biol. 1993;120:1393–403. doi: 10.1083/jcb.120.6.1393. [DOI] [PMC free article] [PubMed] [Google Scholar]
- 3.Tang N, Ostap EM. Motor domain-dependent localization of myo1b (myr-1) Curr Biol. 2001;11:1131–5. doi: 10.1016/s0960-9822(01)00320-7. [DOI] [PubMed] [Google Scholar]
- 4.Holt JR, Gillespie SK, Provance DW, Shah K, Shokat KM, Corey DP, Mercer JA, Gillespie PG. A chemical-genetic strategy implicates myosin-1c in adaptation by hair cells. Cell. 2002;108:371–81. doi: 10.1016/s0092-8674(02)00629-3. [DOI] [PubMed] [Google Scholar]
- 5.Bose A, Robida S, Furcinitti PS, Chawla A, Fogarty K, Corvera S, Czech MP. Unconventional myosin Myo1c promotes membrane fusion in a regulated exocytic pathway. Mol Cell Biol. 2004;24:5447–58. doi: 10.1128/MCB.24.12.5447-5458.2004. [DOI] [PMC free article] [PubMed] [Google Scholar]
- 6.Tyska MJ, Mackey AT, Huang JD, Copeland NG, Jenkins NA, Mooseker MS. Myosin-1a is critical for normal brush border structure and composition. Mol Biol Cell. 2005;16:2443–57. doi: 10.1091/mbc.E04-12-1116. [DOI] [PMC free article] [PubMed] [Google Scholar]
- 7.Speder P, Adam G, Noselli S. Type ID unconventional myosin controls left-right asymmetry in Drosophila. Nature. 2006;440:803–7. doi: 10.1038/nature04623. [DOI] [PubMed] [Google Scholar]
- 8.Hozumi S, Maeda R, Taniguchi K, Kanai M, Shirakabe S, Sasamura T, Speder P, Noselli S, Aigaki T, Murakami R, Matsuno K. An unconventional myosin in Drosophila reverses the default handedness in visceral organs. Nature. 2006;440:798–802. doi: 10.1038/nature04625. [DOI] [PubMed] [Google Scholar]
- 9.Ostap EM, Pollard TD. Biochemical kinetic characterization of the Acanthamoeba myosin-I ATPase. J Cell Biol. 1996;132:1053–60. doi: 10.1083/jcb.132.6.1053. [DOI] [PMC free article] [PubMed] [Google Scholar]
- 10.Jontes JD, Milligan RA, Pollard TD, Ostap EM. Kinetic characterization of brush border myosin-I ATPase. Proc Natl Acad Sci U S A. 1997;94:14332–7. doi: 10.1073/pnas.94.26.14332. [DOI] [PMC free article] [PubMed] [Google Scholar]
- 11.El Mezgueldi M, Tang N, Rosenfeld SS, Ostap EM. The kinetic mechanism of Myo1e (human myosin-IC) J Biol Chem. 2002;277:21514–21. doi: 10.1074/jbc.M200713200. [DOI] [PubMed] [Google Scholar]
- 12.Durrwang U, Fujita-Becker S, Erent M, Kull FJ, Tsiavaliaris G, Geeves MA, Manstein DJ. Dictyostelium myosin-IE is a fast molecular motor involved in phagocytosis. J Cell Sci. 2006;119:550–8. doi: 10.1242/jcs.02774. [DOI] [PubMed] [Google Scholar]
- 13.Coluccio LM, Geeves MA. Transient kinetic analysis of the 130-kDa myosin I (MYR-1 gene product) from rat liver. A myosin I designed for maintenance of tension? J Biol Chem. 1999;274:21575–80. doi: 10.1074/jbc.274.31.21575. [DOI] [PubMed] [Google Scholar]
- 14.Geeves MA, Perreault-Micale C, Coluccio LM. Kinetic analyses of a truncated mammalian myosin I suggest a novel isomerization event preceding nucleotide binding. J Biol Chem. 2000;275:21624–30. doi: 10.1074/jbc.M000342200. [DOI] [PubMed] [Google Scholar]
- 15.Clark R, Ansari MA, Dash S, Geeves MA, Coluccio LM. Loop 1 of transducer region in mammalian class I myosin, Myo1b, modulates actin affinity, ATPase activity, and nucleotide access. J Biol Chem. 2005;280:30935–42. doi: 10.1074/jbc.M504698200. [DOI] [PubMed] [Google Scholar]
- 16.De La Cruz EM, Ostap EM. Relating biochemistry and function in the myosin superfamily. Curr Opin Cell Biol. 2004;16:61–7. doi: 10.1016/j.ceb.2003.11.011. [DOI] [PubMed] [Google Scholar]
- 17.Hiratsuka T. New ribose-modified fluorescent analogs of adenine and guanine nucleotides available as substrates for various enzymes. Biochim Biophys Acta. 1983;742:496–508. doi: 10.1016/0167-4838(83)90267-4. [DOI] [PubMed] [Google Scholar]
- 18.Spudich JA, Watt S. The regulation of rabbit skeletal muscle contraction. I. Biochemical studies of the interaction of the tropomyosin-troponin complex with actin and the proteolytic fragments of myosin. J Biol Chem. 1971;246:4866–71. [PubMed] [Google Scholar]
- 19.Pollard TD. Purification of a high molecular weight actin filament gelation protein from Acanthamoeba that shares antigenic determinants with vertebrate spectrins. J Cell Biol. 1984;99:1970–80. doi: 10.1083/jcb.99.6.1970. [DOI] [PMC free article] [PubMed] [Google Scholar]
- 20.Putkey JA, Slaughter GR, Means AR. Bacterial expression and characterization of proteins derived from the chicken calmodulin cDNA and a calmodulin processed gene. J Biol Chem. 1985;260:4704–12. [PubMed] [Google Scholar]
- 21.Lin T, Tang N, Ostap EM. Biochemical and motile properties of Myo1b splice isoforms. J Biol Chem. 2005;280:41562–7. doi: 10.1074/jbc.M508653200. [DOI] [PubMed] [Google Scholar]
- 22.De La Cruz EM, Wells AL, Rosenfeld SS, Ostap EM, Sweeney HL. The kinetic mechanism of myosin V. Proc Natl Acad Sci U S A. 1999;96:13726–31. doi: 10.1073/pnas.96.24.13726. [DOI] [PMC free article] [PubMed] [Google Scholar]
- 23.De La Cruz EM, Ostap EM, Sweeney HL. Kinetic mechanism and regulation of myosin VI. J Biol Chem. 2001;276:32373–81. doi: 10.1074/jbc.M104136200. [DOI] [PubMed] [Google Scholar]
- 24.White HD, Belknap B, Webb MR. Kinetics of nucleoside triphosphate cleavage and phosphate release steps by associated rabbit skeletal actomyosin, measured using a novel fluorescent probe for phosphate. Biochemistry. 1997;36:11828–36. doi: 10.1021/bi970540h. [DOI] [PubMed] [Google Scholar]
- 25.Brune M, Hunter JL, Corrie JE, Webb MR. Direct, real-time measurement of rapid inorganic phosphate release using a novel fluorescent probe and its application to actomyosin subfragment 1 ATPase. Biochemistry. 1994;33:8262–71. doi: 10.1021/bi00193a013. [DOI] [PubMed] [Google Scholar]
- 26.Ostap EM, Lin T, Rosenfeld SS, Tang N. Mechanism of regulation of Acanthamoeba myosin-IC by heavy-chain phosphorylation. Biochemistry. 2002;41:12450–6. doi: 10.1021/bi0262193. [DOI] [PubMed] [Google Scholar]
- 27.De La Cruz EM, Wells AL, Sweeney HL, Ostap EM. Actin and light chain isoform dependence of myosin V kinetics. Biochemistry. 2000;39:14196–202. doi: 10.1021/bi001701b. [DOI] [PubMed] [Google Scholar]
- 28.Millar NC, Geeves MA. The limiting rate of the ATP-mediated dissociation of actin from rabbit skeletal muscle myosin subfragment 1. FEBS Lett. 1983;160:141–8. doi: 10.1016/0014-5793(83)80954-5. [DOI] [PubMed] [Google Scholar]
- 29.Fujita-Becker S, Durrwang U, Erent M, Clark RJ, Geeves MA, Manstein DJ. Changes in Mg2+ ion concentration and heavy chain phosphorylation regulate the motor activity of a class I myosin. J Biol Chem. 2005;280:6064–71. doi: 10.1074/jbc.M412473200. [DOI] [PubMed] [Google Scholar]
- 30.Robblee JP, Cao W, Henn A, Hannemann DE, De La Cruz EM. Thermodynamics of nucleotide binding to actomyosin V and VI: a positive heat capacity change accompanies strong ADP binding. Biochemistry. 2005;44:10238–49. doi: 10.1021/bi050232g. [DOI] [PubMed] [Google Scholar]
- 31.Yengo CM, Chrin LR, Rovner AS, Berger CL. Tryptophan 512 is sensitive to conformational changes in the rigid relay loop of smooth muscle myosin during the MgATPase cycle. J Biol Chem. 2000;275:25481–7. doi: 10.1074/jbc.M002910200. [DOI] [PubMed] [Google Scholar]
- 32.Malnasi-Csizmadia A, Woolley RJ, Bagshaw CR. Resolution of conformational states of Dictyostelium myosin II motor domain using tryptophan (W501) mutants: implications for the open-closed transition identified by crystallography. Biochemistry. 2000;39:16135–46. doi: 10.1021/bi001125j. [DOI] [PubMed] [Google Scholar]
- 33.Yengo CM, Sweeney HL. Functional role of loop 2 in myosin V. Biochemistry. 2004;43:2605–12. doi: 10.1021/bi035510v. [DOI] [PubMed] [Google Scholar]
- 34.Roth K, Weiner MW. Determination of cytosolic ADP and AMP concentrations and the free energy of ATP hydrolysis in human muscle and brain tissues with 31P NMR spectroscopy. Magn Reson Med. 1991;22:505–11. doi: 10.1002/mrm.1910220258. [DOI] [PubMed] [Google Scholar]
- 35.Veigel C, Coluccio LM, Jontes JD, Sparrow JC, Milligan RA, Molloy JE. The motor protein myosin-I produces its working stroke in two steps. Nature. 1999;398:530–3. doi: 10.1038/19104. [DOI] [PubMed] [Google Scholar]
- 36.Veigel C, Schmitz S, Wang F, Sellers JR. Load-dependent kinetics of myosin-V can explain its high processivity. Nat Cell Biol. 2005;7:861–9. doi: 10.1038/ncb1287. [DOI] [PubMed] [Google Scholar]
- 37.Veigel C, Molloy JE, Schmitz S, Kendrick-Jones J. Load-dependent kinetics of force production by smooth muscle myosin measured with optical tweezers. Nat Cell Biol. 2003;5:980–6. doi: 10.1038/ncb1060. [DOI] [PubMed] [Google Scholar]
- 38.Takagi Y, Homsher EE, Goldman YE, Shuman H. Force generation in single conventional actomyosin complexes under high dynamic load. Biophys J. 2006;90:1295–307. doi: 10.1529/biophysj.105.068429. [DOI] [PMC free article] [PubMed] [Google Scholar]
- 39.Batters C, Arthur CP, Lin A, Porter J, Geeves MA, Milligan RA, Molloy JE, Coluccio LM. Myo1c is designed for the adaptation response in the inner ear. Embo J. 2004;23:1433–40. doi: 10.1038/sj.emboj.7600169. [DOI] [PMC free article] [PubMed] [Google Scholar]
- 40.Cremo CR, Geeves MA. Interaction of actin and ADP with the head domain of smooth muscle myosin: implications for strain-dependent ADP release in smooth muscle. Biochemistry. 1998;37:1969–78. doi: 10.1021/bi9722406. [DOI] [PubMed] [Google Scholar]