

Abstract
Analysis of a subset of case-control sporadic breast cancer data, [from the National Cancer Institute's Cancer Genetic Markers of Susceptibility (CGEMS) initiative], focusing on 18 breast cancer-related genes with 304 SNPs, indicates that there are many interesting interactions that form two- and three-way networks in which BRCA1 plays a dominant and central role. The apparent interactions of BRCA1 with many other genes suggests the conjecture that BRCA1 serves as a protective gene and that some mutations in it or in related genes may prevent it from carrying out this protective function even if the patients are not carriers of known cancer-predisposing BRCA1 mutations. The method of analysis features the evaluation of the effect of a gene by averaging the effects of the SNPs covered by that gene. Marginal methods that test one gene at a time fail to show any effect. That may be related to the fact that each of these 18 genes adds very little to the risk of cancer. Analysis that relates the ratio of interactions to the maximum of the first-order effects discovers significant gene pairs and triplets.
Breast cancer (MIM 114480) has complex causes. Known predisposition genes explain <15% of the breast cancer cases. It is generally believed that most sporadic breast cancers are triggered by unknown combined effects, possibly because of a large number of genes and other risk factors, each adding a small risk toward cancer etiology. Progress in seeking breast cancer genes other than BRCA1 and BRCA2 has been slow and limited because the individual risk due to each gene is small. This difficulty may be partly due to the fact that current methods rely largely on marginal information from genes studied one at a time and ignore potentially valuable information because of the interaction among multiple loci. Because each responsible gene may have a small marginal effect in causing disease, it is likely that such methods will fail to capture many responsible genes by studying a dataset where the disease may be due to a variety of different sources. The possible presence of many genes responsible for different subgroups of cancer patients may reduce the power of current methods to detect genes partly responsible for some forms of breast cancer. It is believed that methods effective in extracting interactive information from data should be developed.
What should be done when marginal effects are too weak to be detected? Our methods use interactive information from multiple sites as well as marginal information, They provide power to detect interactive genes. To test this claim and to demonstrate the practical value of these methods in real applications, we apply them to an important study: a subset of a large dataset collected from a case-control sporadic breast cancer study, focusing on gene–gene-based analysis. This partial dataset comprises 18 genes with 304 SNP markers. The application results in a number of scientific findings.
The message of this article is fourfold. First, if marginal methods fail, more powerful methods that take into account interactive information can be used effectively. We apply our proposed methods to this dataset to illustrate the detection of the interactions between genes. We point out that in our findings, none of the 18 selected genes show any detectable marginal effects that are significantly higher than those generated by random fluctuations. In other words, all of the 18 genes would be missed if only marginal methods were used.
Second, we demonstrate how to carry out a gene-based analysis by treating each gene as a basic unit while incorporating relevant information from all SNPs within that gene. Two summary test scores are proposed to quantify the strength of interactions for each pair of genes. The pairwise interactions can be extended easily. We also provide results using third-order interactions.
Third, to establish statistical significance, we generate a large number of permutations of the dependent variable (case or control) to see how the measures of interaction for the real data compare with those from the many permutations.
Finally, when these procedures are applied to the data, they lead to a number of interesting findings. It is shown that there are a substantial number of significant interactions that form a network in which BRCA1 plays a dominant role. The interactions of BRCA1 with many of the other genes suggests the conjecture that BRCA1 serves as a protective gene and that some mutations in it or in related genes may prevent it from carrying out the protective function.
Results
None of the 18 marginal effects are significantly higher than those generated by random permutations. This claim is made based on comparisons between the observed 18 V values and the values obtained from 1,000 permutations. The exact procedures carried out were described in steps 1 and 2 in Methods. Of the 18 genes, the most significant one is BARD1 with a P value = 0.053, which is slightly short of being significant at 0.05. It is also noticed that BRCA1 has a very large P value (0.944), meaning that the real effects of BRCA1, as well as those of the other genes in breast cancer, cannot be properly measured and reflected by its marginal effect alone. It is the interactive effect that reveals the roles of some of these genes in breast cancer. See supporting information (SI) Fig. S1.
In seeking pairwise interactions among the 18 genes, both Mean-ratio and Quantile-ratio methods were implemented. Although the Mean-ratio method using (M, R) is more conservative than the Quantile-ratio method using (M, Q), it still identified 16 of 153 pairs as significant gene pairs at the 0.05 level that are connected with breast cancer etiology with an estimated false discovery rate (FDR) of 50%. Of these 16 pairs, three pairs, (BRCA1, ESR1), (BARD1, ESR1) and (BRCA1, KRAS2) are significant even under more stringent criteria. The estimated P values are 0.001, 0.003 and 0.004; see Table 1. Four pairs are significant at level 0.01, and the remaining pairs are significant at the 0.05 level by using the rank method. A pairwise network based on these 16 pairs is shown in Fig. 1. On the other hand, the Quantile-ratio method is more powerful. For example, 18 pairs of genes with an estimated FDR of 40% were identified. A pairwise network based on these 18 pairs is shown in Fig. 2. It is interesting to note that 15 of the 18 identified pairs were also found by the Mean-ratio method.
Table 1.
Significance of the gene pairs identified by the Mean-ratio and Quantile-ratio methods with P values estimated by the curve and rank methods
| Pair no. | Mean-ratio method |
Quantile-ratio method |
||||
|---|---|---|---|---|---|---|
| Gene pair | Curve P | Rank P | Gene pair | Curve P | Rank P | |
| 1 | ESR1 BRCA1 | 0.017 | ≤0.001 | ESR1 BRCA1 | 0.013 | 0.001 |
| 2 | BRCA1 PHB | 0.026 | 0.040 | BRCA1 PHB | 0.029 | 0.073 |
| 3 | KRAS2 BRCA1 | 0.002 | 0.006 | KRAS2 BRCA1 | 0.002 | 0.004 |
| 4 | SLC22A18 BRCA1 | 0.032 | 0.072 | SLC22A18 BRCA1 | 0.019 | 0.079 |
| 5 | RAD51 BRCA1 | 0.052 | 0.090 | RAD51 BRCA1 | 0.005 | 0.032 |
| 6 | RB1CC1 SLC22A18 | 0.024 | 0.026 | ESR1 SLC22A18 | 0.033 | 0.016 |
| 7 | CASP8 KRAS2 | 0.043 | 0.038 | RB1CC1 SLC22A18 | 0.009 | 0.008 |
| 8 | CASP8 SLC22A18 | 0.042 | 0.048 | CASP8 KRAS2 | 0.038 | 0.036 |
| 9 | PIK3CA BRCA1 | 0.030 | 0.048 | CASP8 SLC22A18 | 0.021 | 0.012 |
| 10 | PIK3CA ESR1 | 0.047 | 0.032 | PIK3CA BRCA1 | 0.014 | 0.049 |
| 11 | PIK3CA RB1CC1 | 0.047 | 0.051 | PIK3CA ESR1 | 0.021 | 0.005 |
| 12 | PIK3CA SLC22A18 | 0.025 | 0.036 | PIK3CA RB1CC1 | 0.044 | 0.053 |
| 13 | BRCA1 CHEK2 | 0.016 | 0.031 | CASP8 PIK3CA | 0.007 | 0.009 |
| 14 | BARD1 BRCA1 | 0.032 | 0.057 | BRCA1 CHEK2 | 0.007 | 0.022 |
| 15 | BARD1 ESR1 | 0.044 | 0.025 | BARD1 BRCA1 | 0.003 | 0.015 |
| 16 | BARD1 TP53 | 0.019 | 0.019 | BARD1 ESR1 | 0.017 | 0.003 |
| 17 | BARD1 TP53 | 0.015 | 0.010 | |||
| 18 | BARD1 SLC22A18 | 0.056 | 0.063 | |||
| CASP8 ESR1 | 0.071 | 0.048 | CASP8 ESR1 | 0.066 | 0.031 | |
| BARD1 KRAS2 | 0.055 | 0.036 | ||||
| ESR1 KRAS2 | 0.145 | ≤0.001 | ESR1 KRAS2 | 0.103 | ≤0.001 | |
| ESR1 PPM1D | 0.252 | 0.021 | ESR1 PPM1D | 0.348 | ≤0.001 | |
Fig. 1.

Pairwise network based on 16 pairs of genes identified by the Mean-ratio method.
Fig. 2.

Pairwise network based on 18 pairs of genes identified by the Quantile-ratio method.
Using the gene database from the National Center for Biotechnology Information (NCBI), we compare our results with published findings on these gene pairs. In Fig. 2, we have labeled with a red dot the interactions that were previously biologically identified.
There have been multiple reports on the biochemical interactions between BRCA1 and BARD1 (e.g., refs. 1 and 2). Meza et al. (1) studied, in detail, their interaction regarding the structure domains for the interaction, binding activities, etc. Further studies have shown that a subset of mutations at BRCA1 can affect the BRCA1–BARD1 interaction's relation with the susceptibility to breast cancer (3).
Functional interaction between BRCA1 and RAD51 has been identified and suggested to play a role during the S phase of the cell cycle, which is of critical importance for genome integrity (4). Levy-Lahad et al. (5) found evidence suggesting that a mutation at RAD51 modified breast cancer risk among BRCA2 carriers but not BRCA1 carriers. It is interesting that we detected interaction between the RAD51–BRCA1 genes among sporadic breast cancer patients, whereas neither gene demonstrated strong marginal effects.
CHEK2 is an important breast cancer candidate gene. Its association with breast cancer has been widely studied in multiple populations (e.g., refs. 6–8), and it has been shown to be a low-penetrance breast cancer-susceptibility gene (9) and suggested to have complex yet limited involvement in breast cancer etiology (7, 10). Interestingly, as noted in ref. 10, the CHEK2*1100delC mutation was observed more frequently among cases with a first-degree-relative breast cancer patient. This may suggest that CHEK2 may interact with important breast cancer-susceptibility genes as a risk modifier. The BRCA1–CHEK2 interaction is known to be important for DNA damage response (10). Our findings suggested that the association between the BRCA1–CHEK2 interaction and breast cancer susceptibility is much stronger than the marginal effects of these two genes. The involvement of this interaction in breast cancer, if validated, might explain the seemingly weak relevance of CHEK2 to breast cancer risk.
The relation between breast cancer and estrogen receptor-α (ERα) deficiency has been one of the important research areas in breast cancer research. Hosey et al. (11) studied the mRNA expression levels of ESR1 in samples from BRCA1 breast cancer patients and sporadic breast cancer patients and reported that BRCA1 mutation reduces the activities of ESR1. Fan et al. (12) suggested that the wild-type BRCA1 gene may inhibit the transcriptional activities of the ER pathway. These two articles indicated both the BRCA1 mutations and the wild-type alleles are associated with reduced activities of the ER pathway under specific conditions. This may suggest that some combinations of genetic variations at the loci of BRCA1 and ESR1 are involved in deciding the risk of breast cancer.
We found a very high correlation between the P values obtained by the global permutation curve method and the P values obtained by the alternative rank procedure. This is shown in Figs. S2 and S3., Among the 16 pairs of genes identified by using the curve method on the ratios or (M, R), 12 have P values < 0.05 by the rank method. Among the 18 pairs of gene pairs identified by using the curve method on the quantiles or (M, Q), 14 are with P values < 0.05 by the alternative rank method. See Table 1 for details.
If we were to use the rank method on the quantiles with a cut-off threshold of 0.016, there would be 12 pairs that appear significant, whereas only 2.45 would be expected by chance. This corresponds to an estimated FDR of 20%.
For three-way interactions, setting the curve at 99.5%, we report the following findings. From Fig. S4, the ratio method identified 10 of 814 gene triplets to be significantly connected with breast cancer etiology with an estimated FDR of 40%. From Fig. S5, the quantile method with q = 0.90 identified eight of them, with an estimated FDR of 50%. Three triplets are identified by both the ratio and quantile methods. One triplet (RAD51, TP53, BRCA1) is strongly significant under a stringent criteria (the estimated all-triplets-wide significance is < 0.005), and the rest of triplets are potentially significant. A three-way interaction network based on the 10 triplets identified by the ratio method is shown in Fig. S6. A three-way interaction network identified by the quantile method is shown in Fig. S7.
Discussion
The application of our methods on sporadic breast cancer data reveals evidence of numerous interactions among 18 genes previously identified in the literature to be relevant to breast cancer. It is shown that BRCA1 interacts with many of these genes and suggests the conjecture that BRCA1 participates in various tumor-suppression activities and that mutations in BRCA1 or in one of these other interacting genes interferes with these cancer-prevention activities. Biological studies will probably be required to investigate this conjecture. Until recently, there have been a few studies of interactions using a single gene as a unit. For example, Chatterjee et al. (13) and Chapman and Clayton (14) proposed approaches for modeling gene–gene interaction using SNPs within the genes, which may be applied for the analysis of a small number of candidate gene pairs. Specifically, their approaches can be applied to the findings of this article by using independent data.
Our data involved many SNPs even when we restricted ourselves to only 18 genes and the 304 SNPs in the neighborhood of these genes. Because it seemed very unlikely that a mutation in any of those SNPs would be directly causal, it made more sense to average the effects of the SNPs in the neighborhood of the gene and to do the resulting analysis on a gene basis. Because these data revealed no signs of marginal effects of individual genes, analysis was carried out on pairs of genes. Although the pairs by themselves did not show signs of strong effect, the differences between the pairwise and marginal effects led to the study of the mean and quantile ratios. Each of these, when combined with the mean of the maximum of the marginal effects, indicated a significant effect when compared with results obtained by permutations. We suggest that breast cancer data already collected could be reanalyzed by the methods of this article and that such reanalysis might lead to interesting findings.
Materials and Methods
Breast Cancer Data.
The Cancer Genetic Markers of Susceptibility (CGEMS) (http://cgems.cancer.gov/data/) is an initiative from the National Cancer Institute (NCI) searching for susceptibility genetic loci for breast cancer and prostate cancer on the whole-genome scale (15). We received, from CGEMS, the breast cancer data on 2,287 postmenopausal women from the Nurses' Health Study (NHS). Among these individuals, 1,145 developed breast cancer during the observation period of the study, and the other 1,142 did not. By using the Illumina 550k chip, these individuals were genotyped on ≈550,000 SNPs. In this article, instead of carrying out a genome-wide study of all of the markers in this dataset, we chose to focus on a set of carefully selected candidate genes of breast cancer and study their breast cancer-related interactions. To proceed, we first select 18 genes that the literature has shown to be of relevance to breast cancer.
From CGEMS-NHS breast cancer data, we identified a total of 304 SNPs that cover 18 genes that are believed to have connections with breast cancer. The choice of these 18 genes, including BRCA1 and BRCA2, was guided by the publicly available information reported in Online Mendelian Inheritance in Man (OMIM). These genes are listed in Table 2 according to their order of location along the 23 chromosomes, along with the number of SNPs within each gene.
Table 2.
Breast cancer candidate genes studied
| Gene | Locus | SNPs | Gene | Locus | SNPs | Gene | Locus | SNPs | Gene | Locus | SNPs |
|---|---|---|---|---|---|---|---|---|---|---|---|
| CASP8 | 2q33-q34 | 12 | TSG101 | 11p15 | 11 | BRCA2 | 13q12.3 | 31 | BRIP1 | 17q22-q24 | 19 |
| BARD1 | 2q34-q35 | 27 | SLC22A18 | 11p15.5 | 16 | RAD51 | 15q15.1 | 4 | PPM1D | 17q23.2 | 2 |
| PIK3CA | 3q26.3 | 8 | ATM | 11q22-q23 | 12 | TP53 | 17p13.1 | 6 | CHEK2 | 22q12.1 | 11 |
| ESR1 | 6q25.1 | 78 | PALB2 | 16p12.1 | 7 | BRCA1 | 17q21 | 13 | |||
| RB1CC1 | 8q11 | 9 | KRAS2 | 12p12.1 | 28 | PHB | 17q21 | 10 |
The reported relations between the selected genes and breast cancer is now briefly reviewed. The CASP8 gene is included because of the association between one of its variants and reduced risk of breast cancer (16). Breast cancer susceptibility alleles have been reported in both the BARD1 gene (17) and the CHEK2 gene (9). Somatic mutation in the PIK3CA gene was identified in breast cancer (18). A single-gene amplification of the ESR1 gene is detected among breast cancer patients, suggesting that ESR1 amplification is an early genetic alteration in breast cancer development (19). Those genes for which mutations, often at more than one locus, were found among breast cancer cases or families include the RB1CC1 gene (20), the BRCA2 gene (21), the TP53 gene (22), the BRCA1 gene, and the BRIP1 gene (23). The wild-type TSG101 is a tumor gene. Li et al. (24) suggested that defects in the gene TSG101 occur during breast cancer tumorigenesis or progression. Gallagher et al. (25) report that the gain of imprinting affects both the sense and the antisense transcripts at the locus of the SLC22A18 gene. There is evidence that heterozygotes for some mutations in the ATM gene have an increased risk of breast cancer (26). KRAS is said to be one of the most activated oncogenes, with 17–25% of all human tumors harboring an activating KRAS mutation (27). The PALB2 gene encodes a BRCA2-interacting protein and has been shown to play a role in familial breast cancer (28, 29). The PHB gene shows evidence of mutations linked to sporadic breast cancer (30). The PPM1D gene is commonly amplified in breast cancer and abrogates P53 tumor-suppressor activity (31).
The number of SNPs of the region that covers the corresponding gene varies from gene to gene, ranging from 2 to 78 SNPs. Because on average there are ≈3,000 bp between two consecutive SNPs, the largest region that covers the corresponding gene may spread over more than ≈100,000 bp. It is also noted that the genotypes of nearby SNPs are dependent on each other (with a noticeable linkage disequilibrium), and this dependence may stretch rather far along the regions. To take advantage of this dependence and to integrate the neighboring information, we treat each gene/region as a basic unit instead of treating each SNP as a unit. This illustrates our “gene-based approach,” in which information on SNPs is combined into one unit for that gene. Therefore, when we talk about the effect of a certain region or a certain gene, we simply mean the average effect of all individual effects due to all of the SNPs within that region/gene. Analogously, a two-way interaction of two genes. constitutes the average of all pairwise interactions of SNP pairs formed from the two regions/genes, one from each.
Methods.
Consider k SNPs in a case-control study. Because each SNP determines three genotypes, k SNPs define 3k multilocus genotypes that form a partition Π of the dataset into corresponding subsets called partition elements. We shall use the following genotype statistics to measure the observed joint effect of these k SNPs on the disease status:
 |
where nD,s and nU,s are counts of cases and controls in genotype (element) s, nD, and nU are the total number of cases and controls under study. Let ns = nD,s + nU,s be the number of observations in genotype s.
Let Y be the disease status, 1 for cases and 0 for controls. Then, for a genotype partition Π, the statistic v discussed in this article was used in our previous publications (32–35) and can be shown to be a multiple of a general version as follows,
The key statistics used in this article are all derived from v.
We offer the following view of how two genetic loci can act jointly to affect their disease outcome. If the joint effect exceeds their individual marginal effect, we regard this as evidence of “interaction.” Specifically, our concept of interaction of two loci at i and j is that vij is substantially greater than max(vi, vj). The implication is that such an effect, in a large population, suggests that there may be a causal mechanism of biological importance. In the rest of this article, the joint effect of two loci is referred to as a second-order effect, and the marginal effect of one locus is called a first-order effect.
First-order effects failed to indicate anything special about the 18 genes. Second-order effects for pairs of genes were also very disappointing until we compared the second-order effects with the first-order ones. The ratio of the improvement, due to second order over the first order, seemed to signal some connections. This indication was especially impressive when this ratio was compared with the maximum of the two first-order effects in a two-dimensional graph. Two alternative ratios, to be defined later, are considered to be used in conjunction with the maximum of the first-order effects. These will be called the Mean-ratio and Quantile-ratio.
To establish significance, we applied 1,000 permutations of the case-control outcomes, to determine the null distribution of the ratio and the maximum partially described above. We propose two methods of assigning significance levels. One will be called the curve method and the other, the rank method.
Summary of Procedures.
Suppose that there are mi SNPs in gene i. For SNP d of gene i we calculate vid (defined as in Eq. 1 for k = 1) and take the average over the mi SNPs within the gene. This leads to 18 averages V = {V1,V2…, V18}, each representing the (marginal/main) effect of one of the genes. We also calculate the (pairwise/interaction) two-dimensional genotype statistics vid je, defined as in Eq. 1 for k = 2, for all (304 × 303)/2 = 46,056 SNP pairs. Throughout the article, we will use the lowercase to denote the quantities at the SNP-level and uppercase for the gene-level. Also, although we confine ourselves here to SNPs on 18 genes, our methods would apply equally well to a set of SNPs that cover a region of interest that is not necessarily a gene.
-
To detect possible causal effects of genes on disease status, we should know what to expect if there is no relationship. To obtain this information, we destroy any relationship by means of a random permutation of the labels of case (Y = 1) and control (Y = 0) and carry out the step 1 above with the permuted data. For example, calculations based on the first part of step 1 generate 304 random effects (values) purely by chance, whereas the original dependence among SNPs in each gene is retained. We repeat this procedure 1,000 times to produce 1,000 sets of 304 values denoted by v(p) = {vid(p), 1 ≤ i ≤ 304}, where {1 ≤ p ≤ 1,000}. Similarly, one can estimate the null distribution of v for a pair of SNPs when there is no relationship by using the permuted data 1,000 times following the second part of step 1. In this article we use 1,000 permutations for two-way interactions but only 100 for three-way interactions.
For the benefit of nonstatisticians reading this paper, we digress to present a tutorial on significance levels because of the somewhat unusual applications we face in this presentation. The method of significance testing has had an important history in science. A scientist, who is interested in whether his data represent the presence of an effect of interest or are due to random fluctuations, formulates a null hypothesis that there is no effect. He calculates a statistic, T, based on the data. He finds the probability distribution of T, assuming the null hypothesis. He then calculates a P value that is the probability, under the null hypothesis, that T exceeds the observed value t of T. This probability is called the significance level or the P value. If the P value is small, that is regarded as a sign that there is an effect. What constitutes sufficiently small should depend on the background of the problem, although it is customary to use 0.05 or 0.01 as levels to determine statistical significance. If he chooses a statistic that is not sensitive to deviations from the null hypothesis, he is unlikely to get a low P value even when the hypothesis is false and there is an effect. So it pays for him to select a statistic and an experimental design that will be sensitive to those deviations from the null hypothesis in which he is interested.
Our applications have some unusual aspects. By regarding the question of whether a gene has an effect on breast cancer, we are effectively testing 18 distinct null hypotheses. In dealing with interactions, we are testing 153 null hypotheses simultaneously. Our reduced data for the latter problem consists of two statistics, R and M to be defined below. The methodology is ordinarily defined for only one test statistic. Our theory is inadequate, in our problem, to calculate the distribution under the null hypothesis, and thus we have to resort to randomized permutations. These aspects must be addressed here.
Returning to item 2, Fig. S1 presents, for the 18 genes, estimates of P(V ≥ t), as estimated by the permutations. The location of the observed value of V is indicated by a vertical line. The reader will note that none of the 18 P values represented is significant at the 0.05 level.
-
We seek pairwise interactions among the 18 genes. A definition of pairwise interactions between two genes is given first. There are a total of 18 × 17/2 = 153 gene pairs. We shall measure the amount of interaction between two genes, say gi and gj, as follows: For each pair of SNPs, (id, je), one from gene i and another from gene j, define the SNP-wise interactions as the ratio of incremental interactions vs. the maximum of the two marginal effects. That is,
where “⋁” stands for maximum of the two values. This ratio represents the relative amount of interactions of two SNPs with respect to their marginal effects. The amount of interactions between two genes i and j is then defined as the average of all SNP-wise ratios possibly formed from these two genes and will be denoted by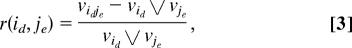
We term this as the “mean interaction ratio” between two genes, or simply, the Mean-ratio or R statistic. In step 6 below, we will introduce an alternative Quantile-ratio or Q statistic.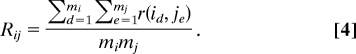 For each gene pair, we also define the “average maximum marginal v” or “M statistic” as
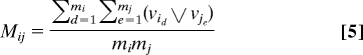
From steps 1–3 above, we obtained a set of 153 points, {(Mij,Rij); 1 ≤ i < j ≤ 18}, corresponding to all possible gene pairs. We use a scatter plot of R vs. M in Fig. 3, to display these 153 points. The same procedure was repeated on 1,000 permutated datasets. This process will generate 1,000 sets of points, each set consisting of 153 points, {(Mij(p), Rij(p)); 1 ≤ I < j ≤ 18} = Γ(p), where p stands for the pth permutation. It also generates 153 sets consisting of 1,000 points each.
-
Based on these 1,000 sets {Γ (p)}, each having 153 points, we construct a 95% confidence curve on the (M, R) plane as shown in Fig. 3 by the dark blue curve, and as described below. Points above the dark blue curve will represent potentially significant gene pairs. This method will be called the Mean-ratio curve method.
We place all points (total 153 × 1,000 = 153,000 points) obtained from these 1,000 permutations on the (M, R) plane. The values of the M coordinate are binned into 100 bins, each with 1,530 points. Each bin is represented by a point with coordinates (M*, R*), where M* is the mid value of the bin, and R* is the 95th percentile of those R scores falling into the bin. A smoothing fit, using a spline with 15 knots, is made to the curve formed by these 100 points (M*, R*), and the resulting dark blue curve is shown in Fig. 3. We also introduce the following curve method of assigning significance levels. For each gene pair (i, j), we shall determine its nominal P value by Sij/1,530 when the pair's R value is the Sij highest among all 1,530 R values obtained from 1,000 permutations that fall into the same bin. We use the term “nominal” because this method does not satisfy the standard criterion of applying the null distribution of a one-dimensional test statistic. The Rank method to be described later does satisfy criterion.
The ratio measure of interaction is sensitive to the possibility that a relatively low interaction for two SNPs has a high ratio when both marginal effects are very small. The resulting high ratio may have a large effect on the overall mean Rij. Instead of using R = Rij, we moderate this problem by introducing an alternative measure of interaction between two genes i and j as the top 90th quantile of the SNP-wise ratios formed by the mimj SNP pairs. This will be denoted by Q = Qij and will be called the Quantile statistic. With Rij replaced by Qij, we carried out steps 4 and 5 and obtained 153 points {(Mij, Qij); 1 ≤ i < j ≤ 18}. The same procedure was applied to 1,000 permutated datasets generating 153,000 points. We apply the smoothing techniques described in step 5 to these points, leading to a dark blue curve shown in Fig. 4. We will call this the Quantile-ratio method.
-
With mild modifications and adequate computational power, the six steps described above can be generalized to detect third- or higher-order interactions. For example, in three-way interactions, consider three SNPs as a triplet, (id, je, kf), each selected from the respective genes i, j, and k. The three-way-SNP-wise interaction is now defined as the ratio of incremental interactions vs. the maximum of the three marginal effects. That is,
At the gene level, we define the three-way interaction with genes i, j, and k as the average of all three-way SNP-wise ratios formed from these three genes, to be denoted by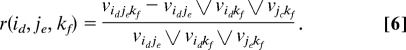
Analogously, one can mimic the quantile statistic to calculate Qijk for the three genes i, j, and k.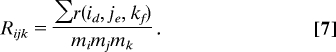 For each gene triplets, we also define
With the scatter plots of (M, R) and (M, Q) based on a number of permuted datasets, we can derive the threshold curves to set various significant levels. Every point of these sets corresponds to a triplet with three genes involved. For the current data, there are 18 × 17 × 16/6 = 816 such triplets. Instead of the 95-percentile level, we use the 99.5% level to determine R* values in each bin and the threshold curves (Fig. S4 and Fig. S5).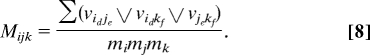
The methods used in steps 5–7, to determine which pairs of genes yield a significant signal, depend for their power on an implicit assumption that the 1,000 points for one pair of genes gives rise to a similar cloud as for another pair of genes. Although an informal view supports this assumption, an alternative rank procedure is more reliable and more directly in keeping with the principle of using a single test statistic to evaluate the P value for a given hypothesis. This method uses the bins of step 5. We have called the first method the curve method, and this alternative, the rank method.


Fig. 3.

(M,R)-plane: observed data and permutation quantiles. 1-ESR1 BRCA1, 2-BRCA1 PHB, 3-KRAS2 BRCA1, 4-SLC22A18 BRCA1, 5-RAD51 BRCA1, 6-RB1CC1 SLC22A18, 7-CASP8 KRAS2, 8-CASP8 SLC22A18, 9-PIK3CA BRCA1, 10-PIK3CA ESR1, 11-PIK3CA RB1CC1, 12-PIK3CA SLC22A18, 13-BRCA1 CHEK2, 14-BARD1 BRCA1, 15-BARD1 ESR1, 16-BARD1 TP53
Fig. 4.

(M,Q)-plane: observed data and permutation quantiles. 1-ESR1 BRCA1, 2-BRCA1 PHB, 3-KRAS2 BRCA1, 4-SLC22A18 BRCA1, 5-RAD51 BRCA1, 6-ESR1 SLC22A18, 7-RB1CC1 SLC22A18, 8-CASP8 KRAS2, 9-CASP8 SLC22A18, 10-PIK3CA BRCA1, 11-PIK3CA ESR1, 12-PIK3CA RB1CC1, 13-CASP8 PIK3CA, 14-BRCA1 CHEK2, 15-BARD1 BRCA1, 16-BARD1 ESR1, 17-BARD1 TP53, 18-BARD1 SLC22A18
Consider the gene pair (i, j) and the corresponding statistics (Mij, Rij). From the permutations we have 1,530 points (M, R) in each of 100 bins. The values of R in each bin are ranked from 1 to 1,530. If Rij falls between the permutation derived points with ranks s − 1 and s in the bin for (i, j), the gene pair is given the value T = s. For this gene pair, there are 1,000 values of T(p) derived from the permutations, and the proportion of T(p) ≥ T is the P value for the gene pair. In effect, the rank method uses the bins for constructing the original method of finding pairs that are significant at the 5% level as the source of a one-dimensional statistic from which a traditional P value can be constructed. The same approach applies to (M, Q). Table 1 displays the respective P values obtained from the curve and rank procedures for those gene pairs above the curve in Figs. 3 and 4.
Supplementary Material
Acknowledgments.
The CGEMS breast data were requested and accessed with Data Access Committee of the National Cancer Institute permission and accessed via the protected portal at http://cgems.cancer.gov/data/. This research is supported by National Institutes of Health Grant R01 GM070789 and National Science Foundation Grant DMS 0714669.
Footnotes
The authors declare no conflict of interest.
This article contains supporting information online at www.pnas.org/cgi/content/full/0805242105/DCSupplemental.
References
- 1.Meza JE, Brzovic PS, King MC, Klevit RE. Mapping the functional domains of BRCA1 interaction of the ring finger domains of BRCA1 and BARD1. J Biol Chem. 1999;274:5659–5665. doi: 10.1074/jbc.274.9.5659. [DOI] [PubMed] [Google Scholar]
- 2.Xia Y, Pao GM, Chen HW, Verma IM, Hunter T. Enhancement of BRCA1 E3 ubiquitin ligase activity through direct interaction with the BARD1 protein. J Biol Chem. 2003;278:5255–5263. doi: 10.1074/jbc.M204591200. [DOI] [PubMed] [Google Scholar]
- 3.Morris JR, Keep NH, Solomon E. Identification of residues required for the interaction of BARD1 with BRCA1. J Biol Chem. 2002;277:9382–9386. doi: 10.1074/jbc.M109249200. [DOI] [PubMed] [Google Scholar]
- 4.Scully R, et al. Association of BRCA1 with Rad51 in mitotic and meiotic cells. Cell. 1997;88:265–275. doi: 10.1016/s0092-8674(00)81847-4. [DOI] [PubMed] [Google Scholar]
- 5.Levy-Lahad E, et al. A single nucleotide polymorphism in the RAD51 gene modifies cancer risk in BRCA2 but not BRCA1 carriers. Proc Natl Acad Sci USA. 2001;98:3232–3236. doi: 10.1073/pnas.051624098. [DOI] [PMC free article] [PubMed] [Google Scholar]
- 6.Vahteristo P, et al. A CHEK2 genetic variant contributing to a substantial fraction of familial breast cancer. Am J Hum Genet. 2002;71:432–438. doi: 10.1086/341943. [DOI] [PMC free article] [PubMed] [Google Scholar]
- 7.Osorio A, et al. The breast cancer low-penetrance allele 1100delC in the CHEK2 gene is not present in Spanish familial breast cancer population. Int J Cancer. 2004;108:54–56. doi: 10.1002/ijc.11414. [DOI] [PubMed] [Google Scholar]
- 8.N. Johnson N, et al. Interaction between CHEK2*1100delC and other low-penetrance breast-cancer susceptibility genes: a familial study. Lancet. 2005;366:1554–1557. doi: 10.1016/S0140-6736(05)67627-1. [DOI] [PubMed] [Google Scholar]
- 9.Meijers-Heijboer H, et al. Low-penetrance susceptibility to breast cancer due to CHEK2(*)1100delC in noncarriers of BRCA1 or BRCA2 mutations. Nat Genet. 2002;31:55–59. doi: 10.1038/ng879. [DOI] [PubMed] [Google Scholar]
- 10.CHEK2 Breast Cancer Consortium. CHEK2*1100delC and susceptibility to breast cancer: A collaborative analysis involving 10,860 breast cancer cases and 9,065 controls from 10 studies. Am J Hum Genet. 2004;74:1175–1182. doi: 10.1086/421251. [DOI] [PMC free article] [PubMed] [Google Scholar]
- 11.Hosey AM, et al. Molecular basis for estrogen receptor alpha deficiency in BRCA1-linked breast cancer. J Natl Cancer Inst. 2007;99:1683–1694. doi: 10.1093/jnci/djm207. [DOI] [PMC free article] [PubMed] [Google Scholar]
- 12.Fan S, et al. BRCA1 inhibition of estrogen receptor signaling in transfected cells. Science. 1999;284:1354–1356. doi: 10.1126/science.284.5418.1354. [DOI] [PubMed] [Google Scholar]
- 13.Chatterjee N, Kalaylioglu Z, Moslehi R, Peters U, Wacholder S. Powerful multilocus tests of genetic association in the presence of gene–gene and gene–environment interactions. Am J Hum Genet. 2006;79:1002–1016. doi: 10.1086/509704. [DOI] [PMC free article] [PubMed] [Google Scholar]
- 14.Chapman J, Clayton D. Detecting association using epistatic information. Genet Epidemiol. 2007;31:894–909. doi: 10.1002/gepi.20250. [DOI] [PubMed] [Google Scholar]
- 15.Hunter DJ, et al. A genome-wide association study identifies alleles in FGFR2 associated with risk of sporadic postmenopausal breast cancer. Nat Genet. 2007;39:870. doi: 10.1038/ng2075. [DOI] [PMC free article] [PubMed] [Google Scholar]
- 16.Cox A, et al. A common coding variant in CASP8 is associated with breast cancer risk. Nat Genet. 2007;39:352–358. doi: 10.1038/ng1981. [DOI] [PubMed] [Google Scholar]
- 17.Karppinen SM, Heikkinen K, Rapakko K, Winqvist R. Mutation screening of the BARD1 gene: Evidence for involvement of the Cys557Ser allele in hereditary susceptibility to breast cancer. J Med Genet. 2004;41:e114. doi: 10.1136/jmg.2004.020669. [DOI] [PMC free article] [PubMed] [Google Scholar]
- 18.Campbell IG, et al. Mutation of the PIK3CA gene in ovarian and breast cancer. Cancer Res. 2004;64:7678–7681. doi: 10.1158/0008-5472.CAN-04-2933. [DOI] [PubMed] [Google Scholar]
- 19.Holst F, et al. Estrogen receptor alpha (ESR1) gene amplification is frequent in breast cancer. Nat Genet. 2007;39:655–660. doi: 10.1038/ng2006. [DOI] [PubMed] [Google Scholar]
- 20.Chano T, Kontani K, Teramoto K, Okabe H, Ikegawa S. Truncating mutations of RB1CC1 in human breast cancer. Nat Genet. 2002;31:285–288. doi: 10.1038/ng911. [DOI] [PubMed] [Google Scholar]
- 21.Wooster R, et al. Identification of the breast cancer susceptibility gene BRCA2. Nature. 1995;378:789–792. doi: 10.1038/378789a0. [DOI] [PubMed] [Google Scholar]
- 22.Borresen-Dale AL. TP53 and breast cancer. Hum Mutat. 2003;21:292–300. doi: 10.1002/humu.10174. [DOI] [PubMed] [Google Scholar]
- 23.Cantor SB, et al. BACH1, a novel helicase-like protein, interacts directly with BRCA1 and contributes to its DNA repair function. Cell. 2001;105:149–160. doi: 10.1016/s0092-8674(01)00304-x. [DOI] [PubMed] [Google Scholar]
- 24.Li L, Li X, Francke U, Cohen SN. The TSG101 tumor susceptibility gene is located in chromosome 11 band p15 and is mutated in human breast cancer. Cell. 1997;88:143–154. doi: 10.1016/s0092-8674(00)81866-8. [DOI] [PubMed] [Google Scholar]
- 25.Gallagher E, et al. Gain of imprinting of SLC22A18 sense and antisense transcripts in human breast cancer. Genomics. 2006;88:12–17. doi: 10.1016/j.ygeno.2006.02.004. [DOI] [PubMed] [Google Scholar]
- 26.Stredrick DL, et al. The ATM missense mutation p.Ser49Cys (c. 146C>G) and the risk of breast cancer. Hum Mutat. 2006;27:538–544. doi: 10.1002/humu.20323. [DOI] [PMC free article] [PubMed] [Google Scholar]
- 27.Kranenburg O. The KRAS oncogene: Past, present, and future. Biochim Biophys Acta. 2005;1756:81–82. doi: 10.1016/j.bbcan.2005.10.001. [DOI] [PubMed] [Google Scholar]
- 28.Xia B, et al. Control of BRCA2 cellular and clinical functions by a nuclear partner, PALB2. Mol Cell. 2006;22:719–729. doi: 10.1016/j.molcel.2006.05.022. [DOI] [PubMed] [Google Scholar]
- 29.Xia B, et al. Fanconi anemia is associated with a defect in the BRCA2 partner PALB2. Nat Genet. 2007;39:159–161. doi: 10.1038/ng1942. [DOI] [PubMed] [Google Scholar]
- 30.Sato T, et al. The human prohibitin gene located on chromosome 17q21 is mutated in sporadic breast cancer. Cancer Res. 1992;52:1643–1646. [PubMed] [Google Scholar]
- 31.Bulavin DV, et al. Amplification of PPM1D in human tumors abrogates p53 tumor-suppressor activity. Nat Genet. 2002;31:210–215. doi: 10.1038/ng894. [DOI] [PubMed] [Google Scholar]
- 32.Lo SH, Zheng T. Backward haplotype transmission association (BHTA) algorithm—A fast multiple-marker screening method. Hum Hered. 2002;53:197–215. doi: 10.1159/000066194. [DOI] [PubMed] [Google Scholar]
- 33.Lo SH, Zheng T. A demonstration and findings of a statistical approach through reanalysis of inflammatory bowel disease data. Proc Natl Acad Sci USA. 2004;101:10386–10391. doi: 10.1073/pnas.0403662101. [DOI] [PMC free article] [PubMed] [Google Scholar]
- 34.Zheng T, Wang H, Lo SH. Backward genotype-trait association (BGTA)-based dissection of complex traits in case-control designs. Hum Hered. 2006;62:196–212. doi: 10.1159/000096995. [DOI] [PMC free article] [PubMed] [Google Scholar]
- 35.Ding Y, Cong L, Ionita-Laza I, Lo SH, Zheng T. Constructing gene association networks for rheumatoid arthritis using the backward genotype-trait association (BGTA) algorithm. BMC Proc. 2007;1(Suppl 1):S13. doi: 10.1186/1753-6561-1-s1-s13. [DOI] [PMC free article] [PubMed] [Google Scholar]
Associated Data
This section collects any data citations, data availability statements, or supplementary materials included in this article.