

Abstract
Platelet production is regulated primarily by the cytokine thrombopoietin (TPO). Although TPO is expressed in several different tissues, only in the bone marrow has the level of expression been reported to increase in response to reduced numbers of platelets. In these studies we demonstrate that platelet granule proteins are able to transcriptionally repress TPO mRNA expression in a marrow stromal cell line as well as in primary bone marrow stromal cell cultures. Like TPO mRNA, secretion of TPO protein was also suppressed by serum treatment. Reporter gene constructs indicate that DNA elements located in an approximately 1.9 kb region between 250bp upstream of the transcriptional initiation site and the middle of the second intron are able to mediate the transcriptional repression.
Introduction
Hematopoiesis, the development of bone marrow progenitor cells into mature blood cells, is regulated by a large number of cytokines and growth factors, each with a limited and defined set of target cells. Physiologically appropriate numbers of each cell type are maintained by continual adjustments in the levels of hematopoietic growth factors. For the platelet lineage, thrombopoietin (TPO) is the primary regulator of thrombopoiesis.i Disruption of the Tpo gene, or that of its receptor, c-Mpl, results in a dramatic reduction in the number of mature platelets produced by marrow progenitors in both mouse and man [1–3]. As the primary regulator of thrombopoiesis, blood levels of TPO are inversely related to platelet count [4]. One mechanism that accounts for this phenomenon is the binding of TPO to its receptor and cellular uptake by the receptor, which is present on mature platelets [5, 6]. Thus, when platelet levels are high, a larger quantity of TPO is removed from the blood, leading to a lower concentration of the hormone. Conversely, when platelet levels are reduced, little TPO is removed and blood levels of the hormone rises, resulting in increased platelet production. A tenet of this model of regulation is that TPO expression in the liver, the primary site of TPO production [7] is unchanged [8]. However, several reports have indicated that TPO mRNA expression in the bone marrow can increase in response to pathologic reductions in platelet levels and experimental manipulation [9, 8]. Moreover, a detailed analysis indicated that several platelet specific granule proteins, such as platelet factor (PF)4, thrombospondin (TSP), transforming growth factor (TGF)β, amongst others, could alter TPO mRNA and protein expression in the marrow stroma (MOVE REF #40 TO #10 AND REARRANGE THE REFERNCES ACCORDINGLY). It is well established that such paracrine production of a cytokine such as TPO would have a far greater effect on blood cell development than would its endocrine functioning.
In order to better understand what regulates TPO mRNA expression in the bone marrow, and the responsible molecular mechanism(s) , we used quantitative-polymerase chain reaction (Q-PCR) to measure changes in TPO mRNA expression provoked by treatment with serum and platelet proteins in model cell lines, cultured primary cells, and in vivo. Additionally, we used a modified TPO-specific Q-PCR assay to test for expression of mRNAs derived from TPO genomic DNA after its introduction into a bone marrow stromal cell line. We found that TPO is subject to transcriptional regulation in marrow stromal cells in response to released platelet proteins.
Materials and Methods
Cell culture
The murine marrow stromal cell line OP9 [10] (kindly provided by Dr. Sanford Shattil) was cultured at 37°C in 5% CO2 in alpha-modification of Eagle’s medium (alpha-MEM), freshly prepared from powder (HyClone, South Logan, UT) every 7–10 days and containing 20% pre-selected bovine calf serum, penicillin, streptomycin, and supplemental glutamine. The murine hepatoma cell line Hepa1c1c7 [11] (American Type culture Company, Manassas, VA) was cultured at 37°C in 5% CO2 in Dulbecco’s modified essential medium (DMEM) containing penicillin, streptomycin, and supplemental glutamine. Primary bone marrow stromal cells were derived from normal murine bone marrow that had been flushed from femurs and placed directly into Iscove’s modified Dulbecco’s medium (IMDM) supplemented with 12.5% bovine calf serum, 12.5% horse serum, penicillin, streptomycin, pyruvate, and 100nM dexamethasone. The cells were maintained at 37°C in 5%CO2 with weekly half media changes until only an adherent layer was present. The adherent cells were then used for up to 4 passages once confluent.
Quantitative RT-PCR
Cell cultures were treated as indicated and total RNA was purified with Trizol™ (Invitrogen, Carlsbad, CA) except for transfected cells where the RNeasy Plus mini kit (Qiagen, Valencia, CA) was used instead. To further reduce DNA contamination, RNA samples were subjected to DNAse (Roche, Indianapolis, IN) digestion and ethanol precipitation. When collecting bone marrow RNA, femurs were first flushed lightly with several milliliters of low serum medium applied through a 25 ½ g needle. Two femurs from each mouse were then immersed together in one tube in 750µl Trizol. To complete the stromal cell solubilization, the Trizol™ was passed through the empty bone cavities with a 27 ½ g needle, and the marrow cavity scraped with the tip of the needle. A real-time-reverse transcriptase (RT)-PCR was then conducted on an iCycler (BioRad, Hercules, CA) thermal cycler using Taqman™ assay chemistry. The RT reaction (20µl) was performed with MMLV RT (50U) at 37°C for 1 hr with random hexamer primers after an initial 20 min room temperature pre-incubation. The PCR reaction (40µl) contained 15mM Tris [pH 8.0], 50mM KCl, 0.3mM dNTPs, 1 U AmpliTaq Gold (Applied Biosystems, Foster City, CA), and 250µM of each primer. Magnesium and FAM-TAMRA labeled probes were added as indicated in Table1. The PCR protocol was: 95’ for 10 min followed by 50 cycles of 95’C for 15 sec and 60’C for 1min.
Table 1.
Quantitative RT-PCR conditions
| Gene/Acc# | Primers/Probe | MgCl2 (mM) |
|---|---|---|
| Thrombopoietin (TPO) | L: ccccatacagggagccactt | 3.0 |
| NM_009379.3 | R: gacagagttagtcttgccactgcaa | |
| Prb: actgatttgctcctggcggccat | ||
| Mutant prb: tggagctgactgatttactactagcagcaatgc | ||
| Cyclophilin (CYC) | R: gtctccttcgagctgtttgc | 4.0 |
| NM_008907 | L: tggcacatgaatcctggaata | |
| Prb: ttcgagctctgagcactggagaga | ||
| Bone sialoprotein (BSP) | L: ggcgatagttccgaagagg | 2.0 |
| L20232.1 | R: cccgagagtgtggaaagtgt | |
| Prb: aggcggaggcagagaacgcc | ||
| Firefly luciferase | F: ggttgtggatctggataccg | 3.0 |
| (from pGL3, Promega) | R: cgcttcggattgtttacat | |
| Prb:aggcgaactgtgtgtgagaggtccta | ||
| 18S | L: cgcggttctattttgttggt | 2.0 |
| NR_003278.1 | R: caaatgctttcgctctggtc | |
| Prb: ggcattcgtattgcgccgct | ||
Platelet-rich and platelet-poor plasma-derived serum
TPO receptor (c-Mpl) null mice were backcrossed onto a C57/Bl6 background for greater than 10 generations (kindly provided by Dr. Warren Alexander, Melbourne, Australia). Whole blood was collected into acid-citrate-dextrose (ACD) by cardiac puncture of c-Mpl−/− (mean platelet count ~327,000/µl) and C57/Bl6 (mean platelet count ~1,050,000/µl) control mice. Samples without evident clotting were pooled and centrifuged at 800×g for 15 min to generate platelet-rich plasma. Half of each sample was then centrifuged at 1500×g for 10 min to generate platelet-poor plasma. Plasma-derived serum was obtained by adding CaCl2 to 100mM, HEPES buffer pH7.5 to 100mM, and 0.5 U/ml thrombin (Sigma-Aldrich, St. Louis, MO) and then incubating at 37°C for 30 min. Fibrin clots were disrupted by passage through a 27 ½ g needle and removed by centrifuging at 15,000g for 5 min. The samples were dialyzed against phosphate buffered saline (PBS) overnight, and the final protein concentrations adjusted to 20 mg/ml with PBS.
Metabolic labeling
OP9 cells were grown to confluency. The medium was then replaced with methionine-and cysteine-free medium containing 20% dialyzed bovine calf serum and incubated for 1 hr. The medium was then replaced with fresh methionine- and cysteine-free medium (MP Biomedicals, Solon, OH) containing 20% or 0.5% bovine calf serum and incubated for an additional 1 hr, at which time 1.5 mCi of a mixture of 35S-labeled methionine and cysteine (MP Biomedicals, Solon, OH) was added to each T-75 culture flask (BD Bioscience, Bedford, MA) containing 7ml of medium. After 8 hr further incubation in a container packed with a large volume of activated charcoal, the culture supernatants were collected. Serum or PBS was added to standardize the medium composition, and trichloroacetic acid (TCA) precipitable counts were measured by liquid scintillation counting. An equal quantity of cpm was combined with the primary biotinylated precipitating reagents (anti-TPO antibodies or soluble c-Mpl receptor, R&D Systems, Minneapolis, MN) and incubated at 4°C overnight with rocking. Streptavidin-agarose beads (Cedarlane Laboratories, Burlington, Canada) were added and incubated for 2 hr. The agarose beads were collected by centrifugation and washed several times in PBS. The bound protein was eluted with 1X sodium dodecylsulfate (SDS)-polyacrylamide gel electrophoresis (PAGE) sample buffer and separated under standard PAGE conditions. Before drying, the gel was soaked in ENLIGHTNING™ autoradiography enhancer (Fischer Scientific, Pittsburgh, PA) for one hr. Finally, the dried gel was exposed to film.
Subcloning of murine TPO genomic DNA by homologous recombination
Subcloning was achieved with the RED™/ET™ BAC Subcloning kit (Gene Bridges, Dresden, Germany). The protocol consisted of first transforming a bacterial artificial chromosome (BAC) clone known to contain TPO genomic region (RP23-187G15) with the pSC101-BAD-gbaA plasmid, which contained the recombination enzymes, and selecting for transformants at 30°C. The recombination enzymes were induced with arabinose for 1 hr. The cells were then electroporated with the subcloning vector pColE1-Amp that had been previously prepared by PCR to incorporate ends 50bp of sequence identical to the TPO gene (specifically, at the 5’ end of TPO: gattgctcaatgatcctcttctagtcctaccactatacatgtgacaagag, and at the 3’ end of TPO: gaatctcagtgtcagtttctatgtgacagagaccttcatcttctaattct). The subclones were selected on ampicillin containing plates at 37°C and screened by restriction digest.
DNA reporter constructs
The BAC subclone containing 7.7 kb of TPO genomic DNA served as the basis of two series of constructs, pmutTPO and pT+L. The pmutTPO series of constructs was created by using Quikchange™ (Stratagene, La Jolla, CA) mutagenesis to introduce 5 single bases changes that preserve the reading frame and splicing signals. The pmutTPO-250pro construct was the result of restriction digest at the immediate 5’ end of the cloned genomic fragment with SpeI and a XbaI site 1 kb downstream, followed by blunting and re-circularization. The pmutTPO-3’del construct was produced in the same manner with a XhoI at the 3’ end of the TPO gene and a AgeI site incorporated at the immediate 3’ end of the subcloned fragment. The 4th intron was removed cutting with AatII in exon 4 and SbfI in exon 5 and replaced with the corresponding cDNA fragment to produce the pmutTPO-din4 construct. The firefly luciferase cDNA followed by an SV40 polyadenylation sequence was removed from pGL3-basic (Promega, Madison, WI) at the HindIII and BamHI sites, blunted, and inserted into the EcoRV site in the 1st intron of the TPO gene. The pT+L-dBam and pT+L-dPst were subsequently produced by digestion the BamHI site (2860bp) or the PstI site (5100bp) and a AgeI site at the immediate 3’ end of the subcloned fragment, followed by blunting and re-circularization.
Results
Bone marrow Tpo mRNA levels are regulated by thrombocytopenia
In order to confirm earlier reports of the selective up-regulation of bone marrow TPO mRNA levels in response to myelosuppression, and to provide a quantitative measure of the changes, a quantitative RT-PCR assay was developed. We first tested whether murine marrow TPO mRNA levels were altered in response to thrombocytopenia. We found that 9 d after mice receive 9 Gy of γ-radiation, a time point characterized by severe thrombocytopenia, TPO-specific mRNA levels in the marrow stromal cells are greatly enhanced compared to control animals (Figure 1). In contrast, the TPO mRNA levels in the liver were stable or decreased slightly. These results are consistent with those reported previously [8].
Figure 1. TPO expression in murine bone marrow and liver.
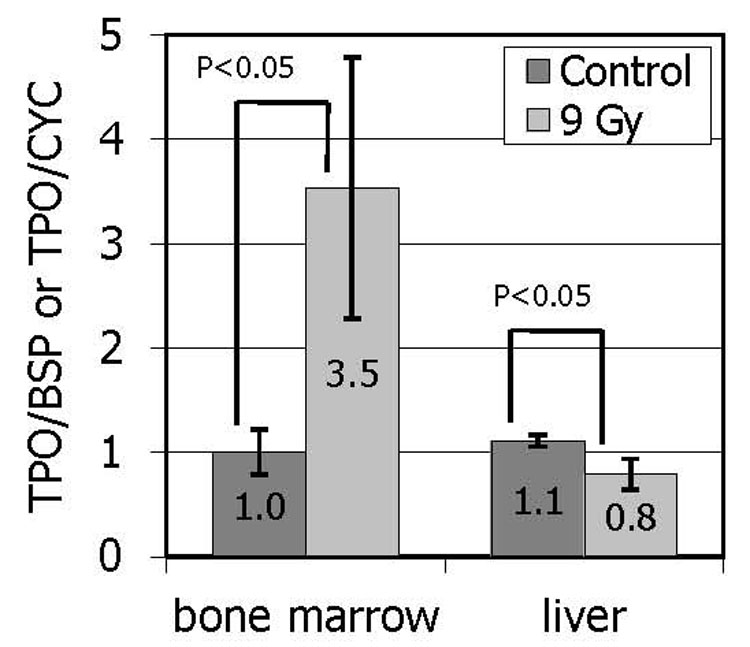
Mice were irradiated with 9 Gy of γ-radiation. Nine days later, Q-PCR was used to determine expression of TPO-specific mRNA in bone marrow stromal cells as well as in the liver. TPO transcript levels were normalized to bone sialoprotein (BSP) expression in marrow cells and to cyclophilin (CYC) in the liver. The results are expressed as the mean values from a representative experiment conducted with four mice in each group and two independent tissue samples from each animal in each condition +/− SEM.
Platelet products regulate Tpo-specific mRNA expression in marrow stromal cells
To investigate the role that soluble products of platelet release or blood coagulation might play in the regulation of TPO expression, cultured primary murine bone marrow stromal cells and model stromal cell lines were treated with varying concentrations of normal serum. OP9 cells were selected as a model of bone marrow stromal cells based on their ability to support the in vitro differentiation of ES cells toward hematopoietic lineages [12]. The murine hepatoma derived cell line, Hepa1c1c7, was selected to represent liver cells. Interestingly, the main effect of normal murine serum on the OP9 cells was found to be suppression of TPO-specific transcripts (Figure 2a), whereas in Hepa1c1c7 cells, TPO expression was reduced by serum starvation (Figure 2b). The suppressive ability of normal murine serum was likewise matched by bovine calf serum in OP9 cells (Figure 2c) and in bone marrow stromal cells (Figure 2d).
Figure 2. TPO expression in cultured primary cells and cell lines in response to serum.
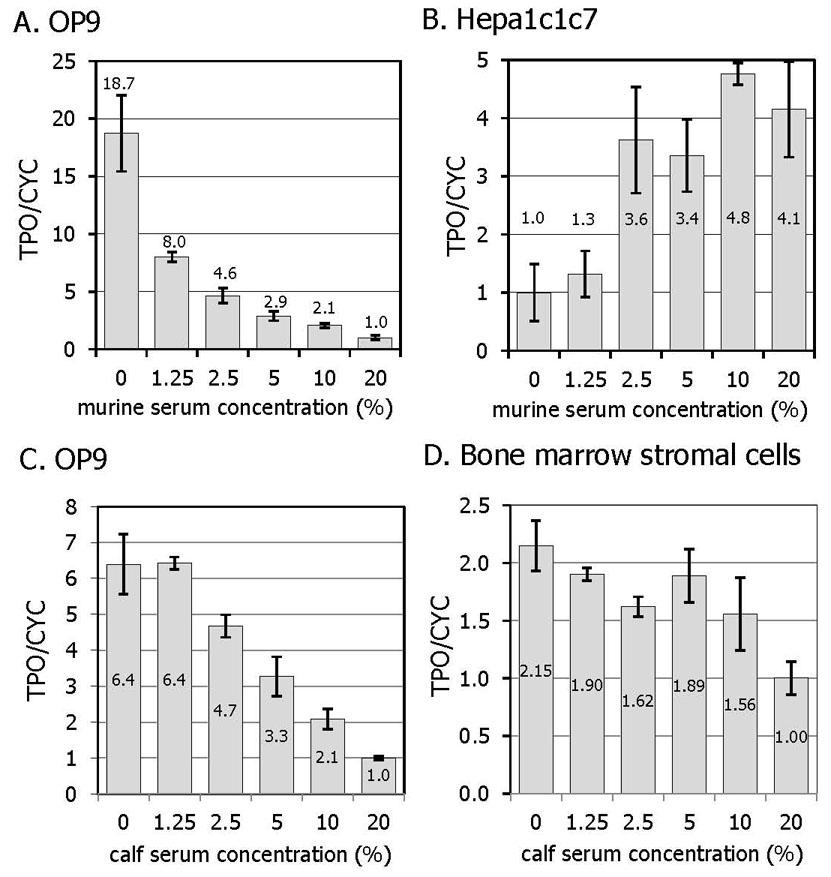
Two cell lines, OP9 (A) and Hepa1c1c7 (B) were treated with increasing doses of murine serum for 10 hr. OP9 cells (C) and primary murine bone marrow stromal cells (D), were treated with bovine calf serum for 10 hr. The results are expressed as the mean value of 4 independent experiments +/− SEM.
Having demonstrated the effect of serum on TPO mRNA levels, it was important to also demonstrate equivalent effects on TPO protein production. Unfortunately, OP9 cells do not secrete sufficient TPO in the culture supernatant to be determined by the available ELISA assays, nor could the culture supernatant be concentrated sufficiently owing to the 20% serum already present in the culture medium. Simple immunoprecipitation was also precluded by the cross-reactivity of bovine TPO and IgG in the calf serum. Metabolic labeling of proteins in OP9 cells was undertaken to establish the concordance of RNA and protein production. Both an anti-murine TPO antibody (Figure 3, left) and a soluble form of the TPO receptor (Figure 3, middle) were able to pull down a 35S labeled protein of the appropriate Mr. Metabolic labeling of BHK cells that over-express recombinant murine TPO provided a suitable positive control immunoprecipitation (Figure 3, right).
Figure 3. Metabolic labeling of proteins in OP9 cells.
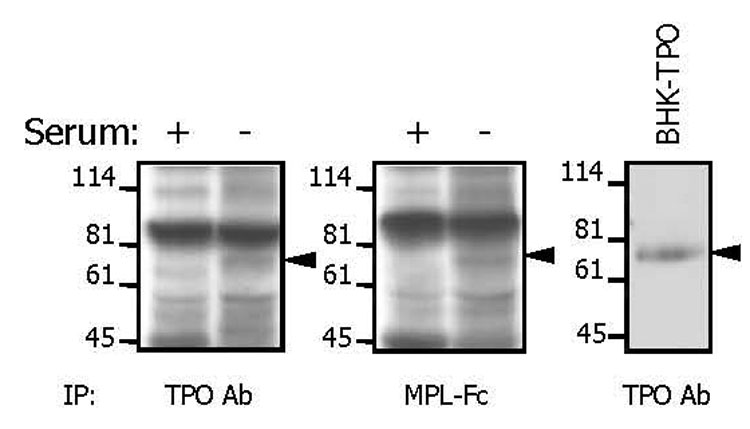
Cells were labeled with a mixture of 35S-cysteine and 35S-methionine for 8 hr in the presence of 20% (+) or 0.5% (−) bovine calf serum. Labeled proteins were precipitated from culture supernatants using either an anti-TPO antibody (left) or a soluble TPO receptor (middle). As a control, labeled TPO was precipitated from the supernatant of BHK cells over-expressing recombinant murine TPO (right).
Serum is a complex milieu of proteins, lipids, and other small molecules. The simplest explanation of the serum suppression would be that TPO in serum suppresses bone marrow production through feedback inhibition. However, recombinant TPO was unable to suppress TPO mRNA levels in OP9 or marrow stromal cells (data not shown). In addition, bone marrow TPO mRNA is elevated in settings where endogenous levels of TPO are known to be high, such as following myelosuppressive therapies or in other thrombocytopenic conditions [4]. To further explore the component(s) of serum that suppresses TPO production we tested serum from thrombocytopenic c-Mpl −/− mice, which display extraordinarily high levels of TPO [1]. We found that c-Mpl−/− mouse derived serum suppresses TPO production less well than that of control murine serum (Figure 4).
Figure 4. The effect of platelet factors on the expression on TPO.
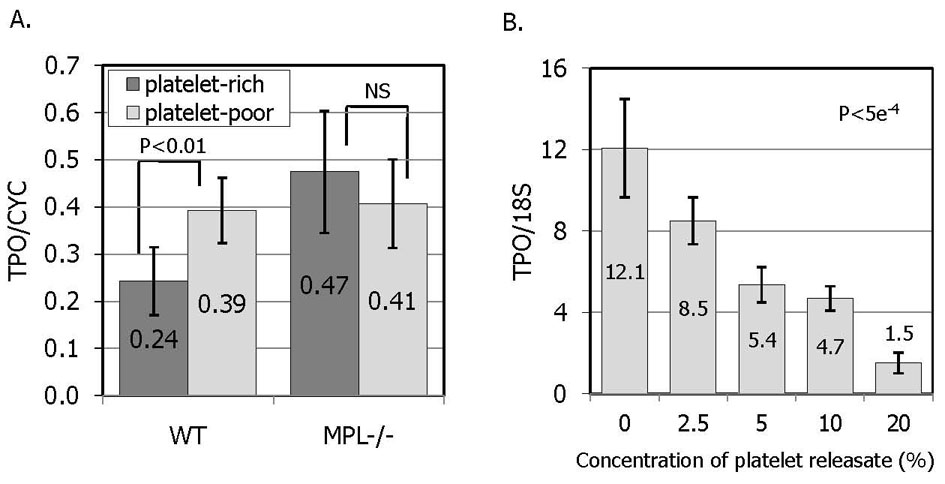
A. OP9 cells were treated for 10 hr with serum derived from thrombin activated plasma that was either platelet-rich (dark bars) or platelet-poor (light bars). The results represent the mean relative TPO mRNA levels of 7 samples from 2 separately prepared serum batches and independently executed experiments +/− SEM. In order to minimize the effect of factors not released from platelets, both platelet-rich and platelet-poor serums were produced from the same batch of murine blood collected into ACD. B. OP9 cells were treated with increasing doses of thrombin-activated human platelet releasate. The platelet concentration was 400/µl, the same as normal human blood. The results represent the mean TPO mRNA levels in 3 independent experiments +/−SEM.
Many of the important growth factors in serum that help to maintain cells in culture are platelet derived proteins released during blood clotting. The critical role that TPO plays in platelet production prompted experiments aimed at quantifying the suppressive ability of platelet proteins relative to plasma proteins. The results illustrated in Figure 4a and 4b demonstrate that platelet proteins are able to suppress TPO expression. First, thrombin activated human platelet releasate is able to inhibit TPO expression (Figure 4b). In these experiments, thrombin did not demonstrate a direct effect to change TPO expression in stromal cells. In addition, serum produced by thrombin activation of platelet-rich plasma reduces TPO expression more than serum produced from platelet-poor plasma (Figure 4a), an effect that is absent in samples from c-Mpl−/− mice, likely due to their severe thrombocytopenia. These results strongly suggest that thrombocytopenia stimulates marrow TPO expression not by increasing a stimulatory factor, but rather by reducing a negative regulatory factor.
Thrombopoietin is regulation transcriptionally
The molecular mechanism(s) that underlies the serum-induced changes in TPO expression was next investigated by introducing TPO DNA constructs into OP9 cells and evaluating the changes in transgene expression levels resulting from serum treatment by Q-PCR. The first set of constructs (Figure 5a) are deletion mutants of a 7.7 kb fragment of genomic DNA that contains all the exons of murine TPO. The 5’ most 1 kb of DNA has been deleted in the pmutTPO-250pro construct, leaving only 250 bp upstream of the transcriptional initiation site. The last 900 base pairs have been deleted from the 3’del construct. The 4th, and largest, intron of TPO was deleted from the pmutTPO-din4 construct. The expression of specific transcripts from this series of constructs was distinguished from endogenous TPO by the incorporation of a 5 bp change that preserves the reading frame and splicing signals, but to which a corresponding Q-PCR probe anneals. Thus, a Q-PCR signal is only detected in transfected cells, but not in non-transfected controls. As shown in Figure 5b, serum induced suppression of TPO expression is maintained in each of these constructs, indicating that none of the deleted regions contain required cis-acting sequence element(s) responsible for TPO regulation.
Figure 5. Expression of transcripts derived from TPO genomic DNA constructs.
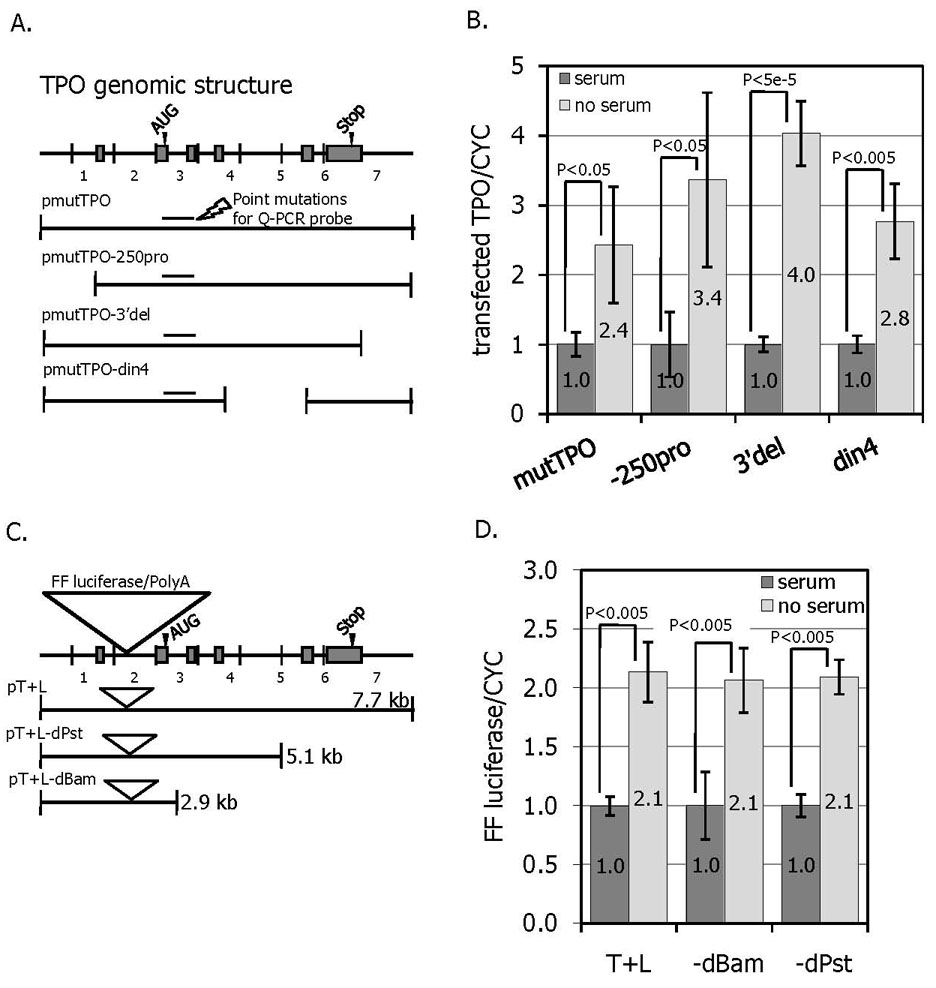
A. A TPO genomic construct was generated encompassing ~7.7 kb of DNA as illustrated. A Q-PCR was developed in which the probe was complimentary to 5 silent point mutations that allowed mRNA expression derived from the DNA construct to be distinguished from that of endogenous TPO-specific mRNA (shown at arrow). A series of deletion mutants was also generated. B. About 40 hr after transfection of the TPO DNA constructs, the OP9 cells were treated with or without bovine calf serum for 10 hr and cells harvested for Q-PCR. The levels of construct specific mRNA are shown from 4 independent experiments +/− SEM. C. A second series of TPO gene constructs that include a firefly luciferase reported genes and corresponding polyadenylation signal in the first intron of TPO was generated. D. The effect of serum on luciferase gene expression in the presence or absence of bovine calf serum was measured by Q-PCR. The results represent the mean luciferase mRNA levels adjusted for cyclophilin levels is shown from 4 independent experiments +/− SEM
A second set of reporter gene constructs was then generated inserting the firefly luciferase cDNA and polyadenylation signal into the first intron of the TPO gene, downstream of the normal TPO transcriptional initiation site. The resulting message would be expected to terminate at the polyadenylation sequence incorporated with the luciferase gene and contain no TPO RNA sequence 3’ to the insertion site in intron 1. The expression of luciferase mRNA is thus driven by TPO genomic sequences and can be followed by Q-PCR for luciferase. Based on this construct, a series of successive deletions of the 3’ end of TPO were generated (Figure 5c). As shown in Figure 5d, none of the constructs was able to completely abrogate serum-induced repression. Therefore, the shortest construct (pT+L-dBam, 2860bp) contains sequence element(s) sufficient to cause serum suppression of TPO in bone marrow cells. Taking into account the first series of constructs (Figure 5a) in which the pmutTPO-250pro construct was able to be regulated normally, the most likely region to contain all necessary serum repressive sequence elements lies between 1000bp and 2860bp. This series of reporter gene constructs also indicates that at least some portion of serum-mediated TPO suppression is mediated by changes in transcription, because essentially no TPO sequences on which mRNA stability mechanisms might act are incorporated into mature luciferase messages.
Discussion
Quantitative RT-PCR demonstrates that bone marrow TPO mRNA expression is increased in response to experimentally induced thrombocytopenia. Treating cultured primary stromal cells and OP9 cells with serum supports the conclusion that the elevation of TPO RNA results from the disruption of a normal negative feedback loop, rather than the action of stimulatory factors generated during the thrombocytopenia. Platelet derived proteins seem to account for a significant portion of the suppression of TPO transcripts because serum derived from platelet-rich plasma suppresses more than that from platelet-poor plasma. In addition, the retention of suppressing activity by dialyzed serum indicates that the responsible factors are proteins of greater Mr than 10kDa. In contrast, the same stimuli seem to cause TPO expressed in the liver or a liver derived cell line to move in the opposite direction, which is most likely due to the general suppression of gene expression seen in most cultured cells deprived of the growth promoting action of serum. Our finding that liver cells cultured in serum depleted medium or 1.25% serum displayed reduced levels of TPO, but that there was no evidence of a dose response relationship when the cells were cultured in medium supplemented with between 2.5% and 20% serum also suggests that low concentrations of serum merely maintain cell metabolism, and that once cell viability is insured, there is little additional effect of serum on TPO expression. The enhanced TPO expression was also confirmed to occur at the level of secreted protein by metabolic labeling.
As shown in Figure 5, a 1.9 kb region between 250 bp upstream of the transcriptional initiation site and the middle of the second intron of the TPO gene appears to contain genetic elements sufficient to mediate serum-induced suppression of TPO gene transcription. One notable transcription factor for which 5 predicted binding sites [13, 14] are found within the region between 1000bp and 2860bp is δ-crystallin enhancer factor-1 (δEF-1). This transcription factor is widely expressed and has been shown to translocate to the nucleus in response to serum [15]. δEF-1 generally acts to down-modulate gene expression [16–25] Of particular interest, previous reports indicate the importance of δEF-1 in contributing to the suppression of osteoblastic genes such as collagen Ia and osteocalcin [26, 27]. The association of δEF-1 with osteoblasts is interesting because evidence suggests that TPO expression in the bone marrow occurs primarily in osteoblasts. (Dr. Toshio Suda, personal communication) In fact, during the course of the current investigation a variety of methods for the detection TPO in bone marrow by Q-PCR were attempted, and only after flushing away the hematopoietic marrow components and extracting the RNA from cells lining the endosteal surface of the bone was TPO able to be detected (data not shown). The expression of TPO by bone marrow osteoblasts is relevant considering the recent attention that endosteal osteoblasts have garnered as the stem cell niche [28, 29] and the well-known role of TPO in supporting stem cells [3, 30, 31].
When considering osteoblasts as the location of TPO expression in the bone marrow, a body of literature concerning the interconnection of osteoblast, osteoclast, and megakaryocyte development may be enlightening. Osteoblasts and osteoclasts participate in a well-developed interrelated regulatory network of cytokine and growth factors, each inhibiting the development of the other and stimulating their own (for a review see[32]). Interestingly, megakaryocytes have been recognized as a component of this interplay (reviewed by [33]). A large number of reports indicate that megakaryocytes stimulate osteoblastogenesis and inhibit osteoclastogenesis. [34–41] Thus, one might postulate that osteoclasts, while acting to inhibit osteoblast development, might also act indirectly to inhibit megakaryocyte growth by secreting factors that suppress TPO expression and inhibit megakaryocyte development.
With regard to potential platelet derived serum factor that may suppress TPO, one prior study demonstrated that transforming growth factor-β1 (TGF-β1) and platelet factor-4 (PF-4) were able to suppress TPO expression in human bone marrow cultures [42]. In addition, insulin and insulin-like growth factor (IGF-I) have been show to induce δEF-1 expression [43]. In actuality, the possibilities are substantial considering that platelets are known to absorb a variety of non-platelet proteins from the circulation, which they are then able to release in abundance when activated.
In summary we found that platelet granule proteins exert a potent effect on bone marrow stromal cell production of TPO, and that the mechanism of regulation is transcriptional suppression. As paracrine hormone production is likely to exert a far greater effect on platelet homeostasis than would endocrine production from the liver or other non-marrow organs, we believe that while platelet adsorption of plasma TPO might be responsible for basal regulation of TPO levels, thrombocytopenia can further modulate an important source of TPO by loss of an important suppressor of stromal cell production of the hormone.
Footnotes
Publisher's Disclaimer: This is a PDF file of an unedited manuscript that has been accepted for publication. As a service to our customers we are providing this early version of the manuscript. The manuscript will undergo copyediting, typesetting, and review of the resulting proof before it is published in its final citable form. Please note that during the production process errors may be discovered which could affect the content, and all legal disclaimers that apply to the journal pertain.
References
- 1.Gurney AL, Carver-Moore K, de Sauvage FJ, Moore MW. Thrombocytopenia in c-mpl-deficient mice. Science (New York, N.Y.) 1994;265(5177):1445–1447. doi: 10.1126/science.8073287. [DOI] [PubMed] [Google Scholar]
- 2.de Sauvage FJ, Carver-Moore K, Luoh SM, et al. Physiological regulation of early and late stages of megakaryocytopoiesis by thrombopoietin. The Journal of Experimental Medicine. 1996;183(2):651–656. doi: 10.1084/jem.183.2.651. [DOI] [PMC free article] [PubMed] [Google Scholar]
- 3.Ballmaier M, Germeshausen M, Schulze H, et al. c-mpl mutations are the cause of congenital amegakaryocytic thrombocytopenia. Blood. 2001;97(1):139–146. doi: 10.1182/blood.v97.1.139. [DOI] [PubMed] [Google Scholar]
- 4.Kuter DJ, Rosenberg RD. The reciprocal relationship of thrombopoietin (c-Mpl ligand) to changes in the platelet mass during busulfan-induced thrombocytopenia in the rabbit. Blood. 1995;85(10):2720–2730. [PubMed] [Google Scholar]
- 5.Fielder PJ, Gurney AL, Stefanich E, et al. Regulation of thrombopoietin levels by c-mpl-mediated binding to platelets. Blood. 1996;87(6):2154–2161. [PubMed] [Google Scholar]
- 6.Stoffel R, Wiestner A, Skoda R. Thrombopoietin in thrombocytopenic mice: evidence against regulation at the mRNA level and for a direct regulatory role of platelets. Blood. 1996;87(2):567–573. [PubMed] [Google Scholar]
- 7.Lok S, Kaushansky K, Holly RD, et al. Cloning and expression of murine thrombopoietin cDNA and stimulation of platelet production in vivo. Nature. 1994;369(6481):565–568. doi: 10.1038/369565a0. [DOI] [PubMed] [Google Scholar]
- 8.McCarty JM, Sprugel KH, Fox NE, Sabath DE, Kaushansky K. Murine thrombopoietin mRNA levels are modulated by platelet count. Blood. 1995;86(10):3668–3675. [PubMed] [Google Scholar]
- 9.Sungaran R, Markovic B, Chong BH. Localization and regulation of thrombopoietin mRNa expression in human kidney, liver, bone marrow, and spleen using in situ hybridization. Blood. 1997;89(1):101–107. [PubMed] [Google Scholar]
- 10.Sungaran R, Chisholm OT, Markovic B, et al. The role of platelet alpha-granular proteins in the regulation of thrombopoietin messenger RNA expression in human bone marrow stromal cells. Blood. 2000;95(10):3094–3101. [PubMed] [Google Scholar]
- 11.Nakano T, Kodama H, Honjo T. Generation of lymphohematopoietic cells from embryonic stem cells in culture. Science (New York, N.Y.) 1994;265(5175):1098–1101. doi: 10.1126/science.8066449. [DOI] [PubMed] [Google Scholar]
- 12.Bernhard HP, Darlington GJ, Ruddle FH. Expression of liver phenotypes in cultured mouse hepatoma cells: synthesis and secretion of serum albumin. Developmental Biology. 1973;35(1):83–96. doi: 10.1016/0012-1606(73)90008-0. [DOI] [PubMed] [Google Scholar]
- 13.Feugier P, Li N, Jo D, et al. Osteopetrotic mouse stroma with thrombopoietin, c-kit ligand, and flk-2 ligand supports long-term mobilized CD34+ hematopoiesis in vitro. Stem Cells and Development. 2005;14(5):505–516. doi: 10.1089/scd.2005.14.505. [DOI] [PubMed] [Google Scholar]
- 14.Akiyama Y. TFSEARCH: Searching Transcription Factor Binding Sites. http://www.rwcp.or.jp/papia/
- 15.Heinemeyer T, Wingender E, Reuter I, et al. Databases on transcriptional regulation: TRANSFAC, TRRD and COMPEL. Nucl. Acids Res. 1998;26(1):362–367. doi: 10.1093/nar/26.1.362. [DOI] [PMC free article] [PubMed] [Google Scholar]
- 16.Franklin AJ, Jetton TL, Shelton KD, Magnuson MA. BZP, a novel serum-responsive zinc finger protein that inhibits gene transcription. Molecular and Cellular Biology. 1994;14(10):6773–6788. doi: 10.1128/mcb.14.10.6773. [DOI] [PMC free article] [PubMed] [Google Scholar]
- 17.Jethanandani P, Kramer RH. {alpha}7 Integrin Expression Is Negatively Regulated by {delta}EF1 during Skeletal Myogenesis. J. Biol. Chem. 2005;280(43):36037–36046. doi: 10.1074/jbc.M508698200. [DOI] [PubMed] [Google Scholar]
- 18.Shirakihara T, Saitoh M, Miyazono K. Differential Regulation of Epithelial and Mesenchymal Markers by {delta}EF1 Proteins in Epithelial Mesenchymal Transition Induced by TGF-beta. Mol. Biol. Cell. 2007;18(9):3533–3544. doi: 10.1091/mbc.E07-03-0249. [DOI] [PMC free article] [PubMed] [Google Scholar]
- 19.van Grunsven LA, Michiels C, Van de Putte T, et al. Interaction between Smad-interacting Protein-1 and the Corepressor C-terminal Binding Protein Is Dispensable for Transcriptional Repression of E-cadherin. J. Biol. Chem. 2003;278(28):26135–26145. doi: 10.1074/jbc.M300597200. [DOI] [PubMed] [Google Scholar]
- 20.Postigo AA. Opposing functions of ZEB proteins in the regulation of the TGFbeta/BMP signaling pathway. The EMBO Journal. 2003;22(10):2443–2452. doi: 10.1093/emboj/cdg225. [DOI] [PMC free article] [PubMed] [Google Scholar]
- 21.Ponticos M, Partridge T, Black CM, Abraham DJ, Bou-Gharios G. Regulation of collagen type I in vascular smooth muscle cells by competition between Nkx2.5 and deltaEF1/ZEB1. Molecular and Cellular Biology. 2004;24(14):6151–6161. doi: 10.1128/MCB.24.14.6151-6161.2004. [DOI] [PMC free article] [PubMed] [Google Scholar]
- 22.Postigo AA, Depp JL, Taylor JJ, Kroll KL. Regulation of Smad signaling through a differential recruitment of coactivators and corepressors by ZEB proteins. The EMBO Journal. 2003;22(10):2453–2462. doi: 10.1093/emboj/cdg226. [DOI] [PMC free article] [PubMed] [Google Scholar]
- 23.van Grunsven LA, Schellens A, Huylebroeck D, Verschueren K. SIP1 (Smad interacting protein 1) and deltaEF1 (delta-crystallin enhancer binding factor) are structurally similar transcriptional repressors. The Journal of Bone and Joint Surgery. American volume. 2001;83-A(Pt 1) Suppl 1:S40–S47. [PubMed] [Google Scholar]
- 24.Sekido R, Murai K, Funahashi J, et al. The delta-crystallin enhancer-binding protein delta EF1 is a repressor of E2-box-mediated gene activation. Molecular and Cellular Biology. 1994;14(9):5692–5700. doi: 10.1128/mcb.14.9.5692. [DOI] [PMC free article] [PubMed] [Google Scholar]
- 25.Murray D, Precht P, Balakir R, Horton WE. The transcription factor deltaEF1 is inversely expressed with type II collagen mRNA and can repress Col2a1 promoter activity in transfected chondrocytes. The Journal of Biological Chemistry. 2000;275(5):3610–3618. doi: 10.1074/jbc.275.5.3610. [DOI] [PubMed] [Google Scholar]
- 26.Sekido R, Murai K, Kamachi Y, Kondoh H. Two mechanisms in the action of repressor deltaEF1: binding site competition with an activator and active repression. Genes to cells : devoted to molecular & cellular mechanisms. 1997;2(12):771–783. doi: 10.1046/j.1365-2443.1997.1570355.x. [DOI] [PubMed] [Google Scholar]
- 27.Terraz C, Toman D, Delauche M, Ronco P, Rossert J. delta Ef1 binds to a far upstream sequence of the mouse pro-alpha 1(I) collagen gene and represses its expression in osteoblasts. The Journal of Biological Chemistry. 2001;276(40):37011–37019. doi: 10.1074/jbc.M104185200. [DOI] [PubMed] [Google Scholar]
- 28.Sooy K, Demay MB. Transcriptional Repression of the Rat Osteocalcin Gene by {delta}EF1. Endocrinology. 2002;143(9):3370–3375. doi: 10.1210/en.2001-211441. [DOI] [PubMed] [Google Scholar]
- 29.Calvi LM, Adams GB, Weibrecht KW, et al. Osteoblastic cells regulate the haematopoietic stem cell niche. Nature. 2003;425(6960):841–846. doi: 10.1038/nature02040. [DOI] [PubMed] [Google Scholar]
- 30.Zhang J, Niu C, Ye L, et al. Identification of the haematopoietic stem cell niche and control of the niche size. Nature. 2003;425(6960):836–841. doi: 10.1038/nature02041. [DOI] [PubMed] [Google Scholar]
- 31.Solar GP, Kerr WG, Zeigler FC, et al. Role of c-mpl in early hematopoiesis. Blood. 1998;92(1):4–10. [PubMed] [Google Scholar]
- 32.Sitnicka E, Lin N, Priestley GV, et al. The effect of thrombopoietin on the proliferation and differentiation of murine hematopoietic stem cells. Blood. 1996;87(12):4998–5005. [PubMed] [Google Scholar]
- 33.Boyce BF, Xing L. Biology of RANK, RANKL, and osteoprotegerin. Arthritis Research & Therapy. 2007;9 Suppl 1:S1. doi: 10.1186/ar2165. [DOI] [PMC free article] [PubMed] [Google Scholar]
- 34.Kacena MA, Gundberg CM, Horowitz MC. A reciprocal regulatory interaction between megakaryocytes, bone cells, and hematopoietic stem cells. Bone. 2006;39(5):978–984. doi: 10.1016/j.bone.2006.05.019. [DOI] [PubMed] [Google Scholar]
- 35.Chagraoui H, Sabri S, Capron C, et al. Expression of osteoprotegerin mRNA and protein in murine megakaryocytes. Experimental Hematology. 2003;31(11):1081–1088. doi: 10.1016/s0301-472x(03)00233-9. [DOI] [PubMed] [Google Scholar]
- 36.Bord S, Vedi S, Beavan SR, Horner A, Compston JE. Megakaryocyte population in human bone marrow increases with estrogen treatment: a role in bone remodeling? Bone. 2000;27(3):397–401. doi: 10.1016/s8756-3282(00)00336-7. [DOI] [PubMed] [Google Scholar]
- 37.Bord S, Frith E, Ireland DC, et al. Synthesis of osteoprotegerin and RANKL by megakaryocytes is modulated by oestrogen. British Journal of Haematology. 2004;126(2):244–251. doi: 10.1111/j.1365-2141.2004.05024.x. [DOI] [PubMed] [Google Scholar]
- 38.Bord S, Frith E, Ireland DC, et al. Megakaryocytes modulate osteoblast synthesis of type-l collagen, osteoprotegerin, and RANKL. Bone. 2005;36(5):812–819. doi: 10.1016/j.bone.2004.12.006. [DOI] [PubMed] [Google Scholar]
- 39.Miao D, Murant S, Scutt N, Genever P, Scutt A. Megakaryocyte-bone marrow stromal cell aggregates demonstrate increased colony formation and alkaline phosphatase expression in vitro. Tissue Engineering. 10(5–6):807–817. doi: 10.1089/1076327041348473. [DOI] [PubMed] [Google Scholar]
- 40.Kacena MA, Kacena MA, Nelson T, Clough ME, et al. Megakaryocyte-mediated inhibition of osteoclast development. Bone. 2006;39(5):991–999. doi: 10.1016/j.bone.2006.05.004. [DOI] [PubMed] [Google Scholar]
- 41.Kacena MA, Shivdasani RA, Wilson K, et al. Megakaryocyte-osteoblast interaction revealed in mice deficient in transcription factors GATA-1 and NF-E2. Journal of bone and mineral research : the official journal of the American Society for Bone and Mineral Research. 2004;19(4):652–660. doi: 10.1359/JBMR.0301254. [DOI] [PubMed] [Google Scholar]
- 42.Thiede M, Smock S, Petersen D, et al. Presence of messenger ribonucleic acid encoding osteocalcin, a marker of bone turnover, in bone marrow megakaryocytes and peripheral blood platelets. Endocrinology. 1994;135(3):929–937. doi: 10.1210/endo.135.3.8070388. [DOI] [PubMed] [Google Scholar]
- 43.Alemany J, Zelenka P, Serrano J, de Pablo F. Insulin-like growth factor I and insulin regulate delta-crystallin gene expression in developing lens. J. Biol. Chem. 1989;264(29):17559–17563. [PubMed] [Google Scholar]