

Abstract
Synaptogenesis requires formation of trans-synaptic complexes between neuronal cell-adhesion receptors. Heterophilic receptor pairs, such as neurexin Iβ and neuroligin, can mediate distinct intracellular signals and form different cytoplasmic scaffolds in the pre- and postsynaptic neuron, and may be particularly important for synaptogenesis. However, the functions of neurexin and neuroligin depend on their distribution in the synapse. Neuroligin has been experimentally assigned to the postsynaptic membrane, while the localization of neurexin remains unclear. To study the subcellular distribution of neurexin Iβ and neuroligin in mature cerebrocortical synapses, we have developed a novel method for physical separation of junctional membranes and their direct analysis by western blotting. Using urea and DTT, we disrupted trans-synaptic protein links, without dissolving the lipid phase, and fractionated the pre- and postsynaptic membranes. The purity of these fractions was validated by electron microscopy and western blotting using multiple synaptic markers. A quantitative analysis has confirmed that neuroligin is localized strictly in the postsynaptic membrane. We have also demonstrated, that neurexin Iβ is largely (96%) presynaptic. Thus, neurexin Iβ and neuroligin normally form trans-synaptic complexes and can transduce bidirectional signals.
Keywords: neurexin, neuroligin, localization, presynaptic, postsynaptic, synaptic junction
Synaptic junctions consist of the pre- and postsynaptic membranes held together by adhesion complexes, which provide mechanical connection and send intracellular signals. Especially interesting are heterophilic receptors that can generate disparate intracellular signals and provide anchors for the distinct pre- and postsynaptic scaffolds. Knowledge of the distribution of heterophilic receptors within a synapse may help to understand their functions.
One of the best examples of heterophilic neuronal cell-adhesion receptors are neurexin Iβ and neuroligin which engage in a Ca2+-dependent interaction (Ichtchenko et al. 1996; Nguyen and Sudhof 1997; Comoletti et al. 2006). Their binding, controlled by alternative splicing (Ichtchenko et al. 1995; Boucard et al. 2005), is important for synapse formation (Scheiffele et al. 2000; Dean et al. 2003; Chih et al. 2006), differentiation (Levinson et al. 2005) and maturation (Dresbach et al. 2004; Varoqueaux et al. 2006). These functions require the opposite distribution of these receptors in the synapse (Nguyen and Sudhof 1997; Scheiffele et al. 2000; Chubykin et al. 2005). Indeed, neuroligin has been localized in the postsynaptic membrane by immunofluorescence in neuronal cultures (Iida et al. 2004; Rosales et al. 2005) and by immuno-electron microscopy (immuno-EM) in synaptic junctions isolated from brain (Song et al. 1999). Consistent with its implicit presynaptic expression, neurexin Iβ has been found in growth cones and synapses in cell cultures (Dean et al. 2003; Chubykin et al. 2005); its clustering induces recruitment of synaptic vesicles (Dean et al. 2003); and its soluble extracellular domain prevents neurons from forming synapses with neuroligin-transfected non-neuronal cells (Scheiffele et al. 2000; Chubykin et al. 2005).
Unexpectedly, a recent study has suggested that neurexin Iβ is abundant in the postsynaptic membranes (Taniguchi et al. 2007) and that a fluorescently tagged neurexin Iβ could be delivered to dendritic spines in transgenic mouse brains. Although this work was contradictory (the pan-neurexin antibody used was unable to distinguish among the multiple neurexin isoforms; the transgenic neurexin Iβ did not bind neuroligin and was overexpressed), it suggested a postsynaptic function for neurexin Iβ, making it important to localize the two receptors in wild-type mature central synapses.
However, the existing methods appeared inadequate for the task. Indeed, the synaptic cleft in a central synapse is very narrow (∼20 nm) (Harris and Sultan 1995), and large cell-surface proteins may be erroneously assigned to the wrong side of the junction by immuno-EM, which is also hard to quantify and is currently unable to distinguish between α- and β-neurexins. On the other hand, biochemical approaches, such as western blotting, can only be applied to isolated membranes. Several methods have been developed for the purification of postsynaptic densities (PSD) (Cotman and Taylor 1972; Ratner and Mahler 1983; Crawford et al. 1981) or pre/postsynaptic complexes (Phillips et al. 2001). However, in all these studies, the presynaptic membrane was either lost or remained attached to the postsynaptic membrane (Cotman and Taylor 1972; Ratner and Mahler 1983; Crawford et al. 1981; Phillips et al. 2001), while treatment with detergent (Cohen et al. 1977; Cotman and Taylor 1972; Ratner and Mahler 1983; Crawford et al. 1981; Phillips et al. 2001) resulted in the loss of membrane proteins on both sides of the junction.
To overcome these problems, we have designed a novel method of separating and isolating the pre- and postsynaptic membranes, which is based on disruption of trans-synaptic complexes and subsequent differential centrifugation. The method, validated by EM and western blotting, has allowed us to quantify the distribution of neurexin and neuroligin. We have found that neuroligin is localized in the postsynaptic membrane, while neurexin Iβ is principally presynaptic. This indicates that in mature nerve terminals neurexin Iβ and neuroligin form trans-synaptic complexes.
This method can now be used to study the distribution of other synaptic membrane proteins (adhesion receptors, ion channels, signaling receptors, transporters).
MATERIALS AND METHODS
Materials
All chemicals were purchased from Sigma. Primary antibodies against the following proteins were used: bassoon (1 μg/ml), synaptotagmin 1 (1:500), synaptobrevin (1:500), synaptophysin 1 (1:1000), SNAP-25 (1:500), syntaxin 1A (1:500) (all rabbit polyclonal, from Synaptic Systems); N-cadherin (mAb 0.5 μg/ml; GeneTex); NMDA receptor 1 (mAb 0.3 μg/ml; Merck-Calbiochem); piccolo (rabbit, 0.5 μg/ml; Abcam); potassium channel, Kv1.2 (rabbit, 1:400; a gift from O. Dolly); PSD-95 (Ab-2, 0.2 μg/ml; Oncogene Research Products); GABAA receptor α-subunit 1 (rabbit, 1:200; a gift from F. A. Stephenson); latrophilin (described previously in Davletov et al. 1996) and neurexin I (described in Volynski et al. 2000). Secondary antibodies conjugated with horseradish peroxidase were from GE Healthcare.
Preparation of synaptosomes
Nerve terminals and their subcellular components (Fig. 1) were prepared essentially as described earlier (Gordon-Weeks 1987). Cerebral cortices from five Sprague-Dawley rats were homogenized in two 40-ml portions of buffer A (0.32 M sucrose, 10 mM HEPES pH 7.2) using a Potter-Elvenhjem homogenizer. The homogenates were centrifuged for 5 min at 2,200 g to yield P1 pellets and S1 supernatants. The supernatants were re-centrifuged for 20 minutes at 12,000 g, yielding P2 pellets and S2 supernatants. The P2 pellets were gently resuspended in 8 ml of buffer A, layered onto discontinuous Ficoll gradients (7.5 % and 12 %; w/v in buffer A) and centrifuged at 64,000 g for 1 h. The synaptosomes were recovered at the 7.5-12 % interface and washed 3 times with PBS by resuspension and 10-min centrifugation at 4,000 g.
Fig. 1.
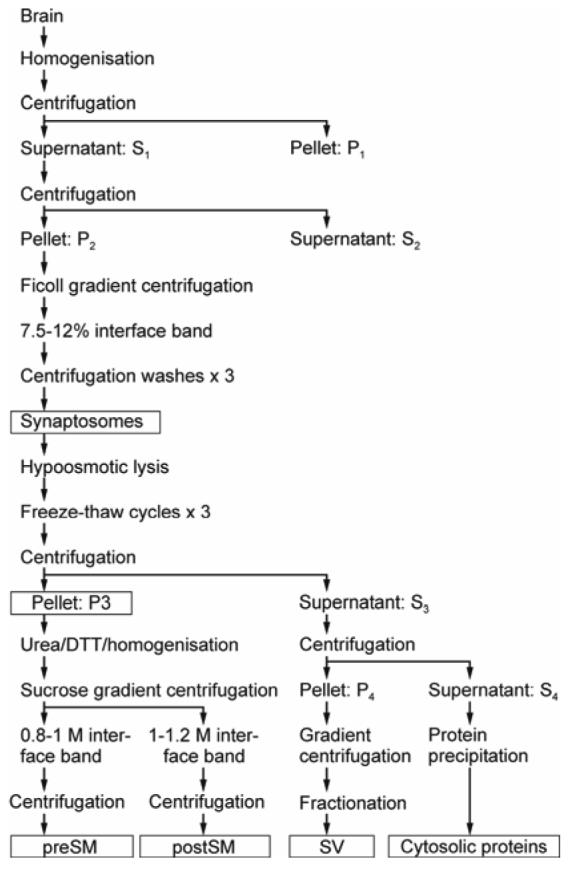
Schematic diagram of separation and fractionation of synaptic membranes. Details are described under Materials and Methods. Subcellular fractions used in this work are boxed.
Preparation of synaptic plasma membranes and synaptic vesicles
The synaptosomes (2.5 ml total) were osmotically lysed in 50 ml of ice-cold buffer B (5 mM Tris-HCl pH 7.6, 50 μM CaCl2) containing protease inhibitors. The lysate was subjected to three freeze/thaw cycles and then centrifuged at 50,000 g for 30 min, at 4 °C, yielding pellet P3 and supernatant S3. The P3 pellets were gently resuspended (avoiding contamination with a dense mitochondrial layer) in 2.5 ml of buffer C (25 mM Tris-HCl, pH 7.6) containing protease inhibitors. The resulting preparation was used for the isolation of junctional membranes (see below) or stored at −70 °C.
The S3 supernatant was further centrifuged at 165,000 g to yield the P4 pellet and S4 supernatant (cytosol). P4 was resuspended in 1.5 ml of 40 mM sucrose, 4 mM HEPES, loaded on a step-wise 100-800 mM sucrose gradient (eight layers with sucrose concentration increasing by 100 mM), and centrifuged at 65,000 g for 5 h, at 4 °C. The gradients were then fractionated, fractions containing SV were identified by western blotting, combined, washed and concentrated by centrifugation.
Isolation of pre- and postsynaptic membranes
Aliquots of the resuspended P3 pellets (1.25 ml) were centrifuged for 5 min, at 4,300 g, 4 °C. The pellets (∼ 0.5 ml) were combined with 167 μl of treatment buffer (60 mM Tris-HCl, pH 7.6, 8 M urea, 0.6 M DTT), and the suspension was homogenized for 10 s in a Polytron homogenizer (8,000 rpm). The samples were left for 15 min on ice with occasional vortexing, then diluted in 7.4 ml of 15 mM Tris-HCl, pH 7.6, 0.15 M DTT. Each sample (∼8 ml) was passed 20 times through a 21-gauge needle and layered onto three-step sucrose gradients prepared in SW28 Beckman tubes and consisting of 1.2 M sucrose (7 ml), 1.0 M sucrose (8.5 ml) and 0.8 M sucrose (8.5 ml) dissolved in 15 mM Tris-HCl, pH 7.6, 0.15 M DTT. The gradients were centrifuged at 100,000 g for 5 h, at 4 °C. Four bands of membranous material were obtained: above 0.8 M sucrose, myelin-enriched membranes; at the 0.8/1.0 M interface, presynaptic membrane fraction (preSM); at the 1.0/1.2 M interface, postsynaptic membrane fraction (postSM); pellet, dense debris. The preSM and postSM layers were aspirated. Corresponding fractions from all gradients were combined, resuspended in buffer C, centrifuged at 100,000 g for 45 min, 4 °C, and stored at −70 °C.
Electron microscopy
Fractions from different stages of this procedure were prepared for EM as previously described (Stinchcombe et al. 1995). In brief, for direct EM, freshly prepared membranes were resuspended and fixed in suspension for 15 min with 2% paraformaldehyde/1.5% glutaraldehyde in 100 mM sodium cacodylate, pH 7.5, washed by centrifugation, resuspended again and post-fixed in 1% osmium tetroxide/1.5% potassium ferricyanide. These procedures prevented formation of membrane layers by cross-linking membranes randomly in suspension. For immuno-EM, membranes were first blocked with 1% BSA in ice-cold PBS, then incubated for 60 min on ice with the anti-PSD-95 antibody in PBS containing 1% BSA. After 3 washes by centrifugation at 1,000 g, membranes were resuspended and fixed with 2% paraformaldehyde in PBS, quenched with 50 mM glycine and 50 mM ammonium chloride in PBS, and blocked with 1% BSA in PBS for 15 min. Membranes were then incubated for 45 min at room temperature with a 5-nm gold-conjugated anti-mouse antibody (BB International) diluted in PBS containing 1% BSA and washed by repetitive centrifugation. Samples were then fixed and post-fixed, as above. Embedding: all pellets were treated with tannic acid, dehydrated and embedded in Epon 812 by the conventional procedure. Embedded samples were sectioned along the vertical axis (to control for any stratification), and 60 nm sections were stained with uranyl acetate and lead citrate (for immuno-EM, lead citrate only); sections of the entire pellet were viewed in a Philips CM12 electron microscope.
Western blotting
Protein content of all samples was determined by the Bradford assay and equalized prior to precipitation with chloroform/methanol. Samples (50 μg protein) were separated in 6-10 % SDS-polyacrylamide gels. Proteins were transferred onto polyvinylidene fluoride membrane (Millipore) and probed with respective primary and secondary antibodies. Positive bands were visualized using a chemiluminescent substrate (Pierce) followed by exposure to Biomax MR-1 film (Eastman Kodak); the images were then digitized. Alternatively, chemiluminescence was recorded using a digital gel imager (LAS-3000, Fujifilm).
Quantification and statistical analysis
Multiple exposures of western blots were made to determine the range of linear response of the detection device. The digitized images were analyzed using the SigmaGel (SPSS UK) and Aida (Raytek Scientific Ltd) software. The specific optical density of each protein band was determined by subtracting the background and normalizing to the optical density of the respective protein in synaptosomes (see Fig. 4). The mean optical density for each protein present in a given fraction (± SEM) was then calculated from multiple independent experiments. To compensate for the cross-contamination of preSM and postSM and to calculate the true fractional distribution (DX) of a protein X between the pre- and postsynaptic membranes, the following formulas were used (see Supplementary Material online for details):
| (1) |
| (2) |
| (3) |
where RX is the ratio of the western blot signal in preSM to that in postSM for protein X; Cpre is the contamination of preSM with postsynaptic membranes, expressed as a fraction of all membranes in preSM; Cpost is the contamination of postSM with presynaptic membranes, expressed as a fraction of postSM membranes; is the preSM/postSM ratio of the western blot signal of a standard presynaptic marker; and is the same ratio for a standard postsynaptic marker.
Fig. 4.

Enrichment of synaptic proteins in respective fractions. (a) Representative western blots of subcellular brain fractions (syn, synaptosomes), stained for marker proteins. The fractions, containing 50 μg protein, were prepared as described under Supplementary Methods online, separated by SDS-electrophoresis in 6-10% polyacrylamide gels and transferred onto polyvinylidene fluoride membranes. Proteins were immunostained using respective primary and secondary antibodies and visualized by chemiluminescence with digital imaging. The following marker proteins were used: SV (synaptophysin, Syph; synaptotagmin I, Syt; and synaptobrevin, Syb); presynaptic membranes (syntaxin IA, Syx IA; SNAP-25; voltage-dependent potassium channel, Kv1.2; piccolo and bassoon); postsynaptic membranes (NMDA receptor 1, GABAA receptor α1 and PSD-95) and wider distribution (synapsin I and N-cadherin). (b) Quantification of western blots. The graph shows the relative amounts of each protein in the cytosol, preSM and postSM compared to the same protein's content in synaptosomes (taken to be 100 %). The data are the means of several experiments (n = 3-5) together with SEM. Student's t-tests compare the amount of each protein in a fraction relative to that in the adjacent fraction on the left, and the results are indicated above each value; *, p < 0.05; **, p < 0.01; #, p < 0.001; -, non-significant.
The final optimized isolation protocol was reproduced 11 times. All evaluation experiments were repeated independently 3 to 5 times. Statistical comparisons were made by paired Student's t-test. Values of p < 0.05 were considered significant. All data presented are the means ± SEM.
RESULTS
Separation of synaptic junctions from the cytosol and organelles
In order to separate the pre- and postsynaptic membranes, we initially purified synaptosomes by a well-established method (Gordon-Weeks 1987) (Fig. 1). These isolated nerve terminals contain synaptic vesicles (SV), other presynaptic organelles and the postsynaptic membrane attached through trans-synaptic adhesion complexes (Fig. 2a). The synaptosomes were lysed to produce the P3 membrane fraction (conventionally called synaptic plasma membranes, SPM) that contains broken nerve terminals lacking the cytosol and organelles but retaining the tightly associated postsynaptic membrane and PSD (Fig. 2b).
Fig. 2.

Morphology of preSM and postSM. Samples from purification steps were aldehyde-fixed and post-fixed with osmium, treated with tannic acid, dehydrated and embedded in Epon. Sectioned specimens were stained with lead citrate and analyzed by EM. Morphological analysis of synaptosomes (a) and P3 (b). Asterisks denote postsynaptic membranes with PSD attached, residual SV are marked with arrowheads. (c) Number of SV found in synaptosomes (Syn) and in identifiable nerve terminals in P3 (n = 5, total number of SV 5,222 in 88 structures for synaptosomes and 207 in 70 structures for P3). (d-e) Representative images of preSM (d) and postSM (e). Insets show examples of structures containing remaining SV (arrowheads). (f) Relative number of vesicle-containing structures in preSM (n = 7; total number of structures 64) and postSM (n = 6; total number of structures 19). Student's t-tests compare the two values, and the results are indicated above; #, p < 0.001. Scale bar for all micrographs and insets, 0.2 μm.
To assess organelle removal from P3, this fraction was compared with the synaptosomes for the presence of SV in structures that could be identified as intact or broken nerve terminals (by the presence of synaptic junctions). As shown in Fig. 2a-c, on average 59.2 ± 3.3 and 2.9 ± 0.3 SV were found per such a structure in synaptosomes and P3, respectively. This indicates that the P3 contained only 5 % of SV compared to synaptosomes and thus mostly consisted of plasma membranes (20.3-fold enrichment).
Separation and fractionation of the pre- and postsynaptic membranes
Adhesion complexes holding the junctional membranes together were disrupted by denaturing proteins (without dissolving the membrane) using urea or guanidinium chloride (Fig. S1). Protein denaturation was assisted by reducing conditions (DTT or β-mercaptoethanol), and the membranes were physically forced apart by further homogenization. The separated membranes were isolated by centrifugation in sucrose gradients and analyzed by western blotting. After preliminary tests (Fig. S2), the optimized separation protocol (Fig. 1) included the treatment of P3 with 1.5 M urea and 100 mM DTT. The two membrane fractions collected from the sucrose gradients, termed initially the “light” and “heavy” fractions, were then extensively analyzed.
Morphological analysis of the fractions
First, the two fractions were analyzed morphologically using EM (Fig. 2d, e). The membranes, treated with chaotropic reagents and homogenized, lacked many of their normal morphological features, e.g. PSD. However, the fractions still appeared to be distinct. Whereas the light fraction consisted of large, often closed, membrane structures resembling presynaptic terminal plasma membranes, the heavy fraction contained multiple small linear or round membrane fragments (∼ 0.1 μm), often tightly packed. Morphometric analysis of the micrographs revealed that, although SV were found rarely, the light fraction still contained 3.3 ± 0.3 times more SV than the heavy fraction (Fig. 2d-f), indicating that presynaptic structures were present largely in the light fraction.
The distribution of postsynaptic membranes between the two fractions was quantified by immuno-EM using PSD-95, a well-known postsynaptic marker protein (Hunt et al. 1996) that was expected to remain membrane-bound through its palmitoyl anchor (Craven et al. 1999; Fukata et al. 2004). The anti-PSD-95 antibody was first tested on intact synaptosomes and shown to mark exclusively the postsynaptic membrane (Fig. 3a). Then, the distribution of the gold label between the light and heavy fractions was quantified (Fig. 3b-d). Very few gold particles, associated only with the remaining postsynaptic membranes, were found in the light fraction. In contrast, about 4.2 ± 0.3 times as many immunogold particles were observed in the heavy fraction (Fig. 3d).
Fig. 3.

Immuno-EM of preSM and postSM. Synaptosomes (a), preSM (b) and postSM (c) membranes were incubated with anti-PSD-95 mAb, fixed, labeled with 5-nm immunogold, before post-fixation and embedding, as in Fig. 2. Insets are magnified views of: (a and c) the respective boxed regions; (b) a rare example of postsynaptic membrane remaining in preSM. Note the immunogold label on postsynaptic membranes present in synaptosomes, remaining to some extent in preSM and abundant in postSM (arrowheads). Asterisks mark PSD in (a). Scale bar, 0.2 μm (0.5 μm for all insets). (d) Quantification of PSD-95-immunogold particles in the preSM and postSM fractions, relative to their contents in preSM. The data are the means of several experiments shown together with SEM (n = 7, total number of gold particles found: 245 in preSM and 1,349 in postSM). Student's t-test compares the amount of PSD-95 in each fraction, and the result is indicated above; **, p < 0.01.
Based on these results, the light and heavy fractions, containing mostly the pre- and postsynaptic membranes, respectively, were operationally termed preSM and postSM.
Distribution of marker proteins among the fractions
To prove this initial conclusion, we used western blotting to analyze the preSM and postSM for the distribution of several characteristic proteins and to compare them to synaptosomes, SV and cytosol. The following proteins were quantified: (1) synaptobrevin, synaptotagmin and synaptophysin as SV markers; (2) syntaxin, SNAP-25, Kv1.2 potassium channel, bassoon and piccolo as markers of the presynaptic membrane; and (3) PSD-95, NMDA receptor 1 and GABAA receptor as postsynaptic markers.
As demonstrated in Fig. 4, all groups of marker proteins consistently distributed among the fractions. Of the vesicular proteins, synaptobrevin had the most differential distribution, demonstrating a 5.1 ± 0.3-fold difference between SV and preSM. Kv1.2 displayed the highest preSM/postSM ratio (3.4 ± 0.7) among the presynaptic markers. Finally, PSD-95 showed the best separation compared to the other postsynaptic proteins (preSM/postSM ratio 0.3 ± 0.02). In addition, Coomassie staining of the fractions in SDS-gels revealed that many unidentified proteins were also specifically enriched in certain fractions (arrowheads in Fig. S3). On the other hand, proteins known to localize in several compartments (e.g. synapsin and N-cadherin) clearly showed a wide distribution (Fig. 4). Taken together, these results confirmed the effective isolation of the pre- and postsynaptic membranes, but also indicated some degree of cross-contamination of the fractions.
To quantify the real distribution of any protein between the pre- and postsynaptic membranes, we estimated the degree of cross-contamination of preSM and postSM. For this purpose, we used Kv1.2 as a presynaptic standard (Chung et al. 2001; Wang et al. 1994; Hunt et al. 1996) and PSD-95 as a postsynaptic standard (Hunt et al. 1996), assuming that their real distributions between junctional membranes were absolute, i.e. 100% of each was found in the respective membrane. By comparing the ideal distributions of these standards with their actual amounts found in preSM and postSM, we determined that 22.7 ± 2.3 % of the postSM material was actually presynaptic and 23.8 ± 2.4 % of preSM belonged to postsynaptic membranes (Fig. 4). This cross-contamination was substituted into the formula (see Methods) derived to calculate the real distribution of other proteins between the pre- and postsynaptic membranes. The results are presented in Table 1 and discussed below.
Table 1.
Calculated distribution of some P3 proteins between the pre- and postsynaptic membranes
| Protein | Presynaptic membrane, %1 | Postsynaptic membrane, %1 |
|---|---|---|
| SNAP-25 | 80.8±14.1 | 19.2±3.1 |
| Syntaxin | 84.6±9.2 | 15.4±6.8 |
| Potassium channel Kv1.22 | 100 | 0 |
| Bassoon | 94.2±5 | 5.8±0.6 |
| Piccolo | 96.4±12.5 | 3.6±0.2 |
| NMDA receptor 1 | 17.0±1.3 | 83.0±17.3 |
| GABAA receptor α1 | 20.73 | 79.33 |
| PSD-952 | 0 | 100 |
| N-cadherin | 563 | 443 |
| Neurexin Iα | 69.3±2.1 | 30.7±2.5 |
| Neurexin Iα′ | 88.9±2.7 | 11.1±0.9 |
| Neurexin Iβ | 95.9±2.7 | 4.1±0.1 |
| Neuroligin | 0.9±0.2 | 99.1±12 |
To calculate the real distribution of each protein between the membranes, the ratio of its western blot signals (preSM to postSM) was corrected for the cross-contamination of these fractions using the formula described under Methods. The values obtained were converted to percentages of the total amount of each protein in the two membranes (shown together with SEM).
By definition, the amount of each standard protein in the respective membrane is 100%.
n = 2.
Analysis of the neurexin/neuroligin pair
This optimized quantitative method was then applied to neurexin Iβ and neuroligin. Neuroligin was found to be postsynaptic, with a preSM/postSM distribution ratio of 0.31 ± 0.04 (Fig. 5). Taking into account the cross-contamination of the fractions, this corresponded to ∼ 99 % of neuroligin localizing in the postsynaptic membrane (Table 1).
Fig. 5.
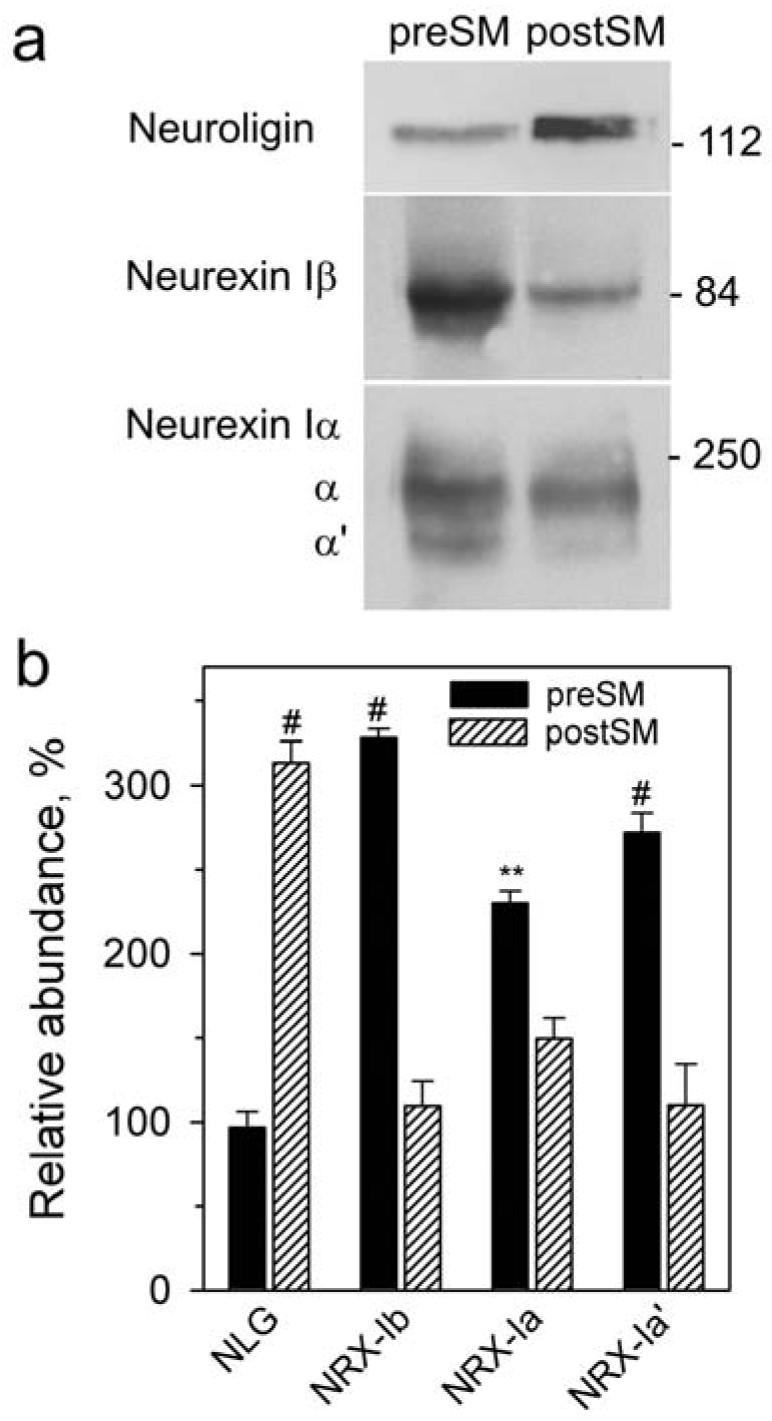
Analysis of the trans-synaptic distribution of neuroligin, neurexin Iβ and neurexin Iα. (a) A representative western blot of the preSM and postSM fractions stained with anti-neuroligin and anti-neurexin antibodies. Letters on the left denote the two isoforms of neurexin Iα. Positions and molecular masses (kDa) of marker proteins are shown on the right. (b) Quantification of western blots as in (a) (n = 3). The graph shows the relative amounts (±SEM) of each protein in the preSM and postSM, expressed as a per cent of its content in synaptosomes. NLG, neuroligin; NRX, neurexin. The results of Student's t-test compare the amounts of each protein in the two fractions and are shown near the values; #, p < 0.001; **, p < 0.01.
The ratio of neurexin Iβ signals in preSM and postSM was 3.01 ± 0.05, clearly indicating the principally presynaptic expression of neurexin Iβ (Table 1). However, it was not as strongly biased towards the presynaptic membrane as, for example, Kv1.2. Using the formula for calculating the real protein distribution, about ∼4.1 ± 0.1 % of neurexin Iβ might also be present in the postsynaptic membrane (Table 1; see also Discussion).
The anti-neurexin antibody used here recognized neurexin Iβ and neurexin Iα equally well, but western blotting allowed unequivocal distinction of these isoforms based on their molecular masses. It is interesting to note that the distribution of neurexin Iα was less differential (the preSM/postSM ratio of 1.66; Fig. 5a; Table 1). In contrast, the smaller (and less abundant) variant, neurexin Iα′, was more strongly presynaptic (ratio 2.85; Fig. 5a), approaching the distribution of neurexin Iβ (Table 1).
DISCUSSION
The novel procedure developed in this work has achieved consistent separation of sub-synaptic membranes and organelles. All the marker proteins used to validate the method showed group-specific distributions. For example, all SV proteins were highly enriched in the vesicular fraction; presynaptic membrane and scaffold proteins were found mostly in the preSM fraction, while postsynaptic transmitter receptors and scaffold protein concentrated in the postSM. Given the strength of adhesion complexes, we did not expect to achieve homogeneity of the pre- and postsynaptic membranes. Nevertheless, the method achieved a 3.2-fold relative enrichment of the junctional membranes (Fig. 4).
After compensating for the residual cross-contamination of the fractions, we could make preliminary conclusions about the distribution of many proteins tested. The results presented in Table 1 indicate that, unlike the idealized standards, some synaptic proteins were distributed more widely. For example, consistent with previous observations (Valtschanoff and Weinberg 2001; Duguid and Sjostrom 2006; Farb et al. 1995; Lien et al. 2006), the neurotransmitter receptors were abundant in the postsynaptic membrane but also present to an extent in the presynaptic membrane. On the other hand, syntaxin and SNAP-25, while being mostly found in the presynaptic membrane, were also detected in the postsynaptic membrane, confirming the previous data that these proteins can also function in dendrites (Sesack and Snyder 1995; Schwab et al. 2001; Grosse et al. 1999). Similarly, due to SV exocytosis, up to 25-30 % of vesicular proteins are known to reside in the presynaptic membrane (Taubenblatt et al. 1999; Dittman and Kaplan 2006; Wienisch and Klingauf 2006), and we found synaptobrevin, synaptotagmin and synaptophysin to be enriched in the SV fraction but also present in the presynaptic membrane (Fig. 4).
Correlation of protein distributions calculated in our work with the published findings allowed us to employ this method for quantification of the trans-synaptic expression of neurexin Iβ and neuroligin. In agreement with the previously published data (Song et al. 1999), we have found that neuroligin is present in the postsynaptic membrane to the same extent as the postsynaptic marker protein PSD-95 (Fig. 5 and Table 1) and that only a minor amount of neurexin Iβ (∼ 4 %) can be detected in the postsynaptic membrane (Fig. 5 and Table 1). These results indicate that the vast majority of neurexin Iβ can only form trans- rather than cis-synaptic complexes with neuroligin.
The small amount of neurexin Iβ present in the postsynaptic membrane could play a role in inhibiting the function of neuroligin in synapse formation (Taniguchi et al. 2007). However, such a role must be independent of the neurexin Iβ-neuroligin interaction because inhibition of neuroligin by neurexin Iβ is unaffected by the splice insert 4 (Taniguchi et al. 2007), which determines the interaction (Ichtchenko et al. 1995; Ichtchenko et al. 1996). In any case, a postsynaptic function of neurexin Iβ can only be minor.
Interestingly, among α-neurexins (Table 1), one isoform (neurexin Iα′) is also mostly presynaptic, while the other (neurexin Iα) is less restricted to nerve terminals (∼ 31 % postsynaptic). The cytosolic domains of all neurexin I isoforms are identical, suggesting that presynaptic delivery of neurexins is controlled by their extracellular domains.
Finally, the method of isolating the pre- and postsynaptic membranes, described here for the first time, may allow characterization of neuronal proteins in normal or diseased brain and a comprehensive analysis of different types of mature or developing synapses. It can also improve proteomic analysis of synaptic junctions described recently, where persistent trans-synaptic links apparently explained the finding of bassoon, piccolo and neurexin in PSD preparations (Peng et al. 2004).
Supplementary Material
The following material is available for this paper online.
Fig. S1 Optimization of conditions for membrane protein denaturation.
Fig. S2 An example of optimization of the membrane separation protocol.
Fig. S3 Differential distribution of proteins in the fractions.
Acknowledgements
We thank J. Tsai for help in conducting some experiments and K. Volynski for discussion and helpful suggestions. Y.A.U. and C.H are funded by The Wellcome Trust (GR074359) and BBSRC (BB/D523078).
Abbreviations used
- EM
electron microscopy
- SPM
synaptic plasma membranes
- SV
synaptic vesicles
- postSM
postsynaptic membrane fraction
- preSM
presynaptic membrane fraction
- PSD
postsynaptic density
References
- Boucard AA, Chubykin AA, Comoletti D, Taylor P, Sudhof TC. A splice code for trans-synaptic cell adhesion mediated by binding of neuroligin 1 to alpha- and beta-neurexins. Neuron. 2005;48:229–236. doi: 10.1016/j.neuron.2005.08.026. [DOI] [PubMed] [Google Scholar]
- Chih B, Gollan L, Scheiffele P. Alternative splicing controls selective trans-synaptic interactions of the neuroligin-neurexin complex. Neuron. 2006;51:171–178. doi: 10.1016/j.neuron.2006.06.005. [DOI] [PubMed] [Google Scholar]
- Chubykin AA, Liu X, Comoletti D, Tsigelny I, Taylor P, Sudhof TC. Dissection of synapse induction by neuroligins: effect of a neuroligin mutation associated with autism. J. Biol. Chem. 2005;280:22365–22374. doi: 10.1074/jbc.M410723200. [DOI] [PubMed] [Google Scholar]
- Chung YH, Shin C, Kim MJ, Lee BK, Cha CI. Immunohistochemical study on the distribution of six members of the Kv1 channel subunits in the rat cerebellum. Brain Res. 2001;895:173–177. doi: 10.1016/s0006-8993(01)02068-6. [DOI] [PubMed] [Google Scholar]
- Cohen RS, Blomberg F, Berzins K, Siekevitz P. The structure of postsynaptic densities isolated from dog cerebral cortex. I. Overall morphology and protein composition. J. Cell Biol. 1977;74:181–203. doi: 10.1083/jcb.74.1.181. [DOI] [PMC free article] [PubMed] [Google Scholar]
- Comoletti D, Flynn RE, Boucard AA, Demeler B, Schirf V, Shi J, Jennings LL, Newlin HR, Sudhof TC, Taylor P. Gene selection, alternative splicing, and post-translational processing regulate neuroligin selectivity for β-neurexins. Biochemistry. 2006;45:12816–12827. doi: 10.1021/bi0614131. [DOI] [PubMed] [Google Scholar]
- Cotman CW, Taylor D. Isolation and structural studies on synaptic complexes from rat brain. J. Cell Biol. 1972;55:696–711. doi: 10.1083/jcb.55.3.696. [DOI] [PMC free article] [PubMed] [Google Scholar]
- Craven SE, El-Husseini AE, Bredt DS. Synaptic targeting of the postsynaptic density protein PSD-95 mediated by lipid and protein motifs. Neuron. 1999;22:497–509. doi: 10.1016/s0896-6273(00)80705-9. [DOI] [PubMed] [Google Scholar]
- Crawford GD, Osborne EZ, Potter HD. Structural destabilization of synaptosomal particles by lysis and sequential chemical treatments. J. Neurocytol. 1981;10:457–473. doi: 10.1007/BF01262416. [DOI] [PubMed] [Google Scholar]
- Davletov BA, Shamotienko OG, Lelianova VG, et al. Isolation and biochemical characterization of a Ca2+-independent α-latrotoxin-binding protein. J. Biol. Chem. 1996;271:23239–23245. doi: 10.1074/jbc.271.38.23239. [DOI] [PubMed] [Google Scholar]
- Dean C, Scholl FG, Choih J, DeMaria S, Berger J, Isacoff E, Scheiffele P. Neurexin mediates the assembly of presynaptic terminals. Nat. Neurosci. 2003;6:708–716. doi: 10.1038/nn1074. [DOI] [PMC free article] [PubMed] [Google Scholar]
- Dittman JS, Kaplan JM. Factors regulating the abundance and localization of synaptobrevin in the plasma membrane. Proc. Natl. Acad. Sci. U. S. A. 2006;103:11399–11404. doi: 10.1073/pnas.0600784103. [DOI] [PMC free article] [PubMed] [Google Scholar]
- Dresbach T, Neeb A, Meyer G, Gundelfinger ED, Brose N. Synaptic targeting of neuroligin is independent of neurexin and SAP90/PSD95 binding. Mol. Cell Neurosci. 2004;27:227–235. doi: 10.1016/j.mcn.2004.06.013. [DOI] [PubMed] [Google Scholar]
- Duguid I, Sjostrom PJ. Novel presynaptic mechanisms for coincidence detection in synaptic plasticity. Curr. Opin. Neurobiol. 2006;16:312–322. doi: 10.1016/j.conb.2006.05.008. [DOI] [PubMed] [Google Scholar]
- Farb CR, Aoki C, Ledoux JE. Differential localization of NMDA and AMPA receptor subunits in the lateral and basal nuclei of the amygdala: a light and electron microscopic study. J. Comp Neurol. 1995;362:86–108. doi: 10.1002/cne.903620106. [DOI] [PubMed] [Google Scholar]
- Fukata M, Fukata Y, Adesnik H, Nicoll RA, Bredt DS. Identification of PSD-95 palmitoylating enzymes. Neuron. 2004;44:987–996. doi: 10.1016/j.neuron.2004.12.005. [DOI] [PubMed] [Google Scholar]
- Gordon-Weeks PR. Isolation of synaptosomes, growth cones and their subcellular components. In: Turner AJ, Bachelard HS, editors. Neurochemistry. A practical approach. 1987. pp. 1–26. [Google Scholar]
- Grosse G, Grosse J, Tapp R, Kuchinke J, Gorsleben M, Fetter I, Hohne-Zell B, Gratzl M, Bergmann M. SNAP-25 requirement for dendritic growth of hippocampal neurons. J. Neurosci. Res. 1999;56:539–546. doi: 10.1002/(SICI)1097-4547(19990601)56:5<539::AID-JNR9>3.0.CO;2-Y. [DOI] [PubMed] [Google Scholar]
- Harris KM, Sultan P. Variation in the number, location and size of synaptic vesicles provides an anatomical basis for the nonuniform probability of release at hippocampal CA1 synapses. Neuropharmacology. 1995;34:1387–1395. doi: 10.1016/0028-3908(95)00142-s. [DOI] [PubMed] [Google Scholar]
- Hunt CA, Schenker LJ, Kennedy MB. PSD-95 is associated with the postsynaptic density and not with the presynaptic membrane at forebrain synapses. J. Neurosci. 1996;16:1380–1388. doi: 10.1523/JNEUROSCI.16-04-01380.1996. [DOI] [PMC free article] [PubMed] [Google Scholar]
- Ichtchenko K, Hata Y, Nguyen T, Ullrich B, Missler M, Moomaw C, Sudhof TC. Neuroligin 1: a splice site-specific ligand for β-neurexins. Cell. 1995;81:435–443. doi: 10.1016/0092-8674(95)90396-8. [DOI] [PubMed] [Google Scholar]
- Ichtchenko K, Nguyen T, Sudhof TC. Structures, alternative splicing, and neurexin binding of multiple neuroligins. J. Biol. Chem. 1996;271:2676–2682. doi: 10.1074/jbc.271.5.2676. [DOI] [PubMed] [Google Scholar]
- Iida J, Hirabayashi S, Sato Y, Hata Y. Synaptic scaffolding molecule is involved in the synaptic clustering of neuroligin. Mol. Cell Neurosci. 2004;27:497–508. doi: 10.1016/j.mcn.2004.08.006. [DOI] [PubMed] [Google Scholar]
- Levinson JN, Chery N, Huang K, Wong TP, Gerrow K, Kang R, Prange O, Wang YT, El-Husseini A. Neuroligins mediate excitatory and inhibitory synapse formation: involvement of PSD-95 and neurexin-1beta in neuroligin-induced synaptic specificity. J. Biol. Chem. 2005;280:17312–17319. doi: 10.1074/jbc.M413812200. [DOI] [PubMed] [Google Scholar]
- Lien CC, Mu Y, Vargas-Caballero M, Poo MM. Visual stimuli-induced LTD of GABAergic synapses mediated by presynaptic NMDA receptors. Nat. Neurosci. 2006;9:372–380. doi: 10.1038/nn1649. [DOI] [PubMed] [Google Scholar]
- Nguyen T, Sudhof TC. Binding properties of neuroligin 1 and neurexin 1β reveal function as heterophilic cell adhesion molecules. J. Biol. Chem. 1997;272:26032–26039. doi: 10.1074/jbc.272.41.26032. [DOI] [PubMed] [Google Scholar]
- Peng J, Kim MJ, Cheng D, Duong DM, Gygi SP, Sheng M. Semiquantitative proteomic analysis of rat forebrain postsynaptic density fractions by mass spectrometry. J. Biol. Chem. 2004;279:21003–21011. doi: 10.1074/jbc.M400103200. [DOI] [PubMed] [Google Scholar]
- Phillips GR, Huang JK, Wang Y, Tanaka H, Shapiro L, Zhang W, Shan WS, Arndt K, Frank M, Gordon RE, Gawinowicz MA, Zhao Y, Colman DR. The presynaptic particle web: ultrastructure, composition, dissolution, and reconstitution. Neuron. 2001;32:63–77. doi: 10.1016/s0896-6273(01)00450-0. [DOI] [PubMed] [Google Scholar]
- Ratner N, Mahler H. Isolation of postsynaptic densities retaining their membrane attachment. Neuroscience. 1983;9:631–644. doi: 10.1016/0306-4522(83)90179-3. [DOI] [PubMed] [Google Scholar]
- Rosales CR, Osborne KD, Zuccarino GV, Scheiffele P, Silverman MA. A cytoplasmic motif targets neuroligin-1 exclusively to dendrites of cultured hippocampal neurons. Eur. J. Neurosci. 2005;22:2381–2386. doi: 10.1111/j.1460-9568.2005.04400.x. [DOI] [PubMed] [Google Scholar]
- Scheiffele P, Fan J, Choih J, Fetter R, Serafini T. Neuroligin expressed in nonneuronal cells triggers presynaptic development in contacting axons. Cell. 2000;101:657–669. doi: 10.1016/s0092-8674(00)80877-6. [DOI] [PubMed] [Google Scholar]
- Schwab Y, Mouton J, Chasserot-Golaz S, Marty I, Maulet Y, Jover E. Calcium-dependent translocation of synaptotagmin to the plasma membrane in the dendrites of developing neurones. Brain Res. Mol. Brain Res. 2001;96:1–13. doi: 10.1016/s0169-328x(01)00244-3. [DOI] [PubMed] [Google Scholar]
- Sesack SR, Snyder CL. Cellular and subcellular localization of syntaxin-like immunoreactivity in the rat striatum and cortex. Neuroscience. 1995;67:993–1007. doi: 10.1016/0306-4522(95)00087-y. [DOI] [PubMed] [Google Scholar]
- Song JY, Ichtchenko K, Sudhof TC, Brose N. Neuroligin 1 is a postsynaptic cell-adhesion molecule of excitatory synapses. Proc. Natl. Acad. Sci. U. S. A. 1999;96:1100–1105. doi: 10.1073/pnas.96.3.1100. [DOI] [PMC free article] [PubMed] [Google Scholar]
- Stinchcombe JC, Nomoto H, Cutler DF, Hopkins CR. Anterograde and retrograde traffic between the rough endoplasmic reticulum and the Golgi complex. J. Cell Biol. 1995;131:1387–1401. doi: 10.1083/jcb.131.6.1387. [DOI] [PMC free article] [PubMed] [Google Scholar]
- Taniguchi H, Gollan L, Scholl FG, Mahadomrongkul V, Dobler E, Limthong N, Peck M, Aoki C, Scheiffele P. Silencing of neuroligin function by postsynaptic neurexins. J. Neurosci. 2007;27:2815–2824. doi: 10.1523/JNEUROSCI.0032-07.2007. [DOI] [PMC free article] [PubMed] [Google Scholar]
- Taubenblatt P, Dedieu JC, Gulik-Krzywicki T, Morel N. VAMP (synaptobrevin) is present in the plasma membrane of nerve terminals. J. Cell Sci. 1999;112:3559–3567. doi: 10.1242/jcs.112.20.3559. [DOI] [PubMed] [Google Scholar]
- Valtschanoff JG, Weinberg RJ. Laminar organization of the NMDA receptor complex within the postsynaptic density. J. Neurosci. 2001;21:1211–1217. doi: 10.1523/JNEUROSCI.21-04-01211.2001. [DOI] [PMC free article] [PubMed] [Google Scholar]
- Varoqueaux F, Aramuni G, Rawson RL, Mohrmann R, Missler M, Gottmann K, Zhang W, Sudhof TC, Brose N. Neuroligins determine synapse maturation and function. Neuron. 2006;51:741–754. doi: 10.1016/j.neuron.2006.09.003. [DOI] [PubMed] [Google Scholar]
- Volynski KV, Meunier FA, Lelianova VG, et al. Latrophilin, neurexin and their signaling-deficient mutants facilitate α-latrotoxin insertion into membranes but are not involved in pore formation. J. Biol. Chem. 2000;275:41175–41183. doi: 10.1074/jbc.M005857200. [DOI] [PubMed] [Google Scholar]
- Wang H, Kunkel DD, Schwartzkroin PA, Tempel BL. Localization of Kv1.1 and Kv1.2, two K channel proteins, to synaptic terminals, somata, and dendrites in the mouse brain. J. Neurosci. 1994;14:4588–4599. doi: 10.1523/JNEUROSCI.14-08-04588.1994. [DOI] [PMC free article] [PubMed] [Google Scholar]
- Wienisch M, Klingauf J. Vesicular proteins exocytosed and subsequently retrieved by compensatory endocytosis are nonidentical. Nat. Neurosci. 2006;9:1019–1027. doi: 10.1038/nn1739. [DOI] [PubMed] [Google Scholar]
Associated Data
This section collects any data citations, data availability statements, or supplementary materials included in this article.
Supplementary Materials
The following material is available for this paper online.
Fig. S1 Optimization of conditions for membrane protein denaturation.
Fig. S2 An example of optimization of the membrane separation protocol.
Fig. S3 Differential distribution of proteins in the fractions.