Abstract
We report a method to elucidate the structure of triacylglycerols (TAG) containing monoene or diene fatty acyl groups by Atmospheric Pressure Covalent Adduct Chemical Ionization (APCACI) tandem mass spectrometry using acetonitrile as an adduct formation reagent. TAG were synthesized with the structure ABB and BAB, where A is palmitate (C16:0) and B is an isomeric C18 monoene unsaturated at position 9, 11, or 13, or an isomeric diene unsaturated at positions 9, 11 or 10, 12 or 9, 12. In addition to the species at m/z 54 observed in previous CI studies of fatty acid methyl esters, we also found that ions m/z at 42, m/z at 81 and m/z at 95 undergo covalent reaction with TAG containing double bonds to yield ions at m/z 40, 54, 81 and 95 units greater than that of the parent TAG: [M+40]+, [M+54]+, [M+81]+ and [M+95]+ ions. When collisionally dissociated, these ions fragment to produce two or three diagnostic ions that locate the double bonds in the TAG. In addition, ions [RCH=C=O + 40]+ and [RCH=C=O + 54]+ formed from collisional dissociation are of strong abundance in MS/MS spectra, and collisional activation of these ions produces two intense confirmatory diagnostic ions in the MS3 spectra. Fragment ions reflecting neutral loss of sn-1 acyl group from [M+40]+ and [M+54]+ are more abundant than those reflecting neutral loss of sn-2 acyl group, analogous to previous reports for protonated TAG. The position of each acyl group on the glycerol backbone is thus determined by the relative abundances of these ions. Under the conditions in our instrument, the [M+40]+ adduct is at highest signal and also yields all system about double bond position and TAG stereochemistry. With the exception of geometries about the double bonds, racemic TAG isomers containing two monoenes or dienes and a saturate can be fully characterized by APCACI-MS/MS/MS.
Lipidomics is the emerging field of systems-level analysis and characterization of lipids and their interacting moieties. Mass spectrometry is a routine for lipid analysis, however the complete structural elucidation of lipids remains an important analytical challenge.
Triacylglycerols (TAG) are the most abundant dietary lipids. They constitute the major form of energy and essential fatty acid storage for plants and animals. TAG are required at some minimal levels within cells to support specialized functions. Alterations in TAG synthesis and catabolism play important roles in obesity, atherosclerosis, insulin release from pancreatic βcells, and alcohol-induced hepatic dysfunction, among many other functions.1–7
Considering that TAG are made up of combinations of three fatty acyl groups from any of 20–50 fatty acids present in cells, the number of distinct molecular TAG species from biological extracts may number in the thousands. TAG have been extensively studied by mass spectrometry, employing various ionization techniques, including electron ionization (EI),8, 9 chemical ionization (CI),10–12 atmospheric pressure chemical ionization (APCI),13–19 desorption CI (DCI),20–22 field desorption (FD),23, 24 thermospray (TSP)25, 26 fast atom bombardment (FAB),27–29 electrospray ionization (ESI),30–35 and matrix-assisted laser desorption/ionization(MALDI).36–38 These techniques typically yield information about the molecular weights, fatty acid carbon number, degree of unsaturation, and regiospecificity, but do not reveal the arrangement of double bonds, which is the single most significant structural property determining biological activity. A rapid, instrumental method for analysis of double bond position in TAG is required.
Conventional approaches for determination of double bond position by mass spectrometry rely on an initial hydrolysis of fatty acyl groups, followed by chemical derivatization to enhance the yield of diagnostically useful fragment ions obtained upon collisional dissociation. Single acyl groups are esterified with charge localizing groups such as 4,4-dimethyloxalone (DMOX) or picolinyl esters with subsequent analysis of charge-remote fragmentation. The disadvantage of these methods have been discussed,39 and include the need for derivatization chemistry prior to analysis, and generally low sensitivity.
In previous work,39–42 we have demonstrated a rapid technique for double bond localization in fatty acid methyl esters (FAME) based on chemical derivatization of neutral FAME in the gas phase, which we recently termed “covalent adduct CI” (CACI).43 The CI mass spectrum of CH3CN in a 3D internal ionization ion trap includes ions at m/z 40 and 42, formed by loss or gain of H, and an ion at m/z 54.44, 45 It has been demonstrated that an ion/molecule reaction between [C2H2N]+ (m/z 40) and neutral CH3CN results in the formation of an intermediate [C4H5N2]+ at m/z 81, which loses HCN to form the (1-methyleneimino)-1-ethenylium (MIE; CH2=C=N+=CH2) ion at m/z 54.46 MIE in turn reacts with carbon-carbon double bonds in FAME to form a covalent adduct ion appearing at 54 mass units greater than that of the parent FAME, [M+54]+. Isolation and collisional activation of the [M+54]+ ions yields fragments corresponding to bond cleavage at specific locations in FAME. The two ions that are normally of greatest abundance contain either the α- or ω-carbon atoms and have masses unique to the positions of double bonds within the FAME. Early studies of this reaction included double bond identification in monoene hydrocarbons and polyene alcohols.47, 48, as well as monoene FAME.49
TAG are neutral molecules that can be analyzed by high temperature gas chromatography (GC) but for lipidomics applications are more commonly analyzed from a liquid by electrospray ionization (ESI). ESI is a soft ionization technique which excels at analysis of charged or high proton affinity compounds. To adapt CACI to the liquid phase, we investigated the use of atmospheric pressure CI (APCI) as a source for reagent ions for covalent adduct formation with TAG, similar to our gas phase FAME analysis. Conditions were first developed to produce adequate levels of reagent ions for derivatization of neutral TAG, under conditions we refer to as AP-covalent adduct-CI (APCACI). TAG of the form ABB and BAB (sn-1,2,3) were synthesized, where B is a monoene or diene fatty acyl group of one of several isomers and A is palmitic acid (hexadecanoic acid, 16:0). The resulting ions were characterized for their ability to form diagnostically useful fragments by single, double, and triple stage mass spectrometry
EXPERIMENTAL SECTION
Chemicals
The following fatty acids were purchased from Matreya, Inc. (State College, PA): 9c-octadecenoic acid (oleic acid), 11c-octadecenoic acid (vaccenic acid), 13c-octadecenoic acid, 9c,12c-octadecadienoic acid, 9c,11t-octadecadienoic acid (rumenic acid) 10t,12c-octadecadienoic acid. 1,3-dicyclohexylcarbodiimide and 4-dimethylaminopyridine were purchased from Sigma Chemical Co. (St. Louis, MO). 1-palmitin and 2-palmitin were obtained from Research Plus, Inc (Manasquan, NJ). Thin Layer Chromatography (TLC) plates were obtained from Analtech Inc. (Newark, DE). The following TAG were synthesized by esterification of fatty acids with sn-1 or sn-2 monopalmitoylyglycerol as reported elsewhere:50
rac-glyceryl-1,3-9c-octadecenoate-2-palmitate [(9-18:1/16:0/9-18:1)-TAG], rac-glyceryl-1-palmitate-2,3-9c-octadecenoate [(16:0/9-18:1/9-18:1)-TAG], rac-glyceryl-1,3-11c-octadecenoate-2-palmitate [(11-18:1/16:0/11-18:1)-TAG], rac-glyceryl-1-palmitate-2,3-11c-octadecenoate [(11-18:1/16:0/11-18:1)-TAG], rac-glyceryl-1,3-13c-octadecenoate-2-palmitate [(13-18:1/16:0/13-18:1)-TAG], rac-glyceryl-1-palmitate-2,3-13c-octadecenoate [(16:0/13-18:1/13-18:1)-TAG], rac-glyceryl-1,3-9c,11t-octadecadienoate-2-palmitate [(9,11-18:2/16:0/9,11-18:2)-TAG], rac-glyceryl-1-palmitate-2,3-9c,11t-octadecadienoate [(9,11-18:2/16:0/9,11-18:2)-TAG], rac-glyceryl-1,3-10t,12c-octadecadienoate-2-palmitate [(10,12-18:2/16:0/10,12-18:2)-TAG], rac-glyceryl-1-palmitate-2,3-10t,12c-octadecadienoate [(10,12-18:2/16:0/10,12-18:2)-TAG], rac-glyceryl-1,3-9c,12c-octadecadienoate-2-palmitate [(9,12-18:2/16:0/9,12-18:2)-TAG], rac-glyceryl-1-palmitate-2,3-9c,12c-octadecadienoate [(9,12-18:2/16:0/9,12-18:2)-TAG]. Solvents were obtained from Aldrich Chemical Co. (Milwaukee, WI).
Instrumentation
An ABI MDS/Sciex QTRAP 2000 triple quadruple linear ion trap mass spectrometer was employed in the APCI positive ion mode. Data acquisition and processing software was Analyst 1.4, and MS-1 masses were centroided to reduce clutter in the spectrum. Helium, rather than the conventional N2, was used as the nebulizer, auxiliary, and collision gas. The heated pneumatic nebulizer probe conditions were: 350°C, 65 psi nebulizing gas pressure, 25 psi auxiliary gas pressure, 50 psi curtain gas pressure. Needle current was set at 2.0 μA. Declustering potential was set at 90 V. Samples were delivered into the ionization source with syringe pump by infusion at a flow rate of 25 μl/min of TAG dissolved in chloroform/acetonitrile (1/9) to a final concentration of 100 μg/ml. Data were acquired for 1 min per spectrum. Under these conditions, a continuous plasma discharge is observed in the region from the quartz tube to the curtain plate. Chemically active adducts were not detected under conventional APCI conditions; the plasma glow was essential. This may have been due to the large ionization volume within which neutral TAG and active ions interacted within the plasma; further experiments are required to clarify this point. After approximately 300 hours of analysis, we found that the heater coil, though still functional, had cracked at a stress point apparently due to metal degradation by the plasma and high temperature.
TAG molecular species were directly ionized in the positive ion mode by APCACI. Tandem mass spectrometry of TAG was performed by collisional activation with He gas. MS/MS/MS was performed third quadrupole operated in linear ion trap mode. The degree of collisional activation was adjusted through variation of collision energy.
RESULTS AND DISCUSSION
APCI-MS of Acetonitrile
Figure 1 presents APCI mass spectra of acetonitrile using (A) N2 and (B) He as nebulizer and auxiliary gases respectively. They consists of five main ionic species at m/z 40 [M-H]+, 42 [M+H]+, 54, 81 and 95. The former three ions are in agreement with previous investigations of acetonitrile CI.43–44 45 It was demonstrated that an ion/molecule reaction between [C H N]+ (m/z 40) and neutral acetonitrile results in the formation of a [C4H5N2]+ (m/z 81) intermediate, which loses HCN to yield [C3H4N]+ m/z 54 ion, identified as MIE. m/z 95 is likely to correspond to C5H7N2+ originating from reaction of m/z 54 ions with neutral acetonitrile (m/z 41). The 54 ions are formed at about 20% and 70% abundances of the [C2H2N]+ ions when using N2 and He, respectively. In this work, He was used as nebulizer and auxiliary gases.
Figure 1.
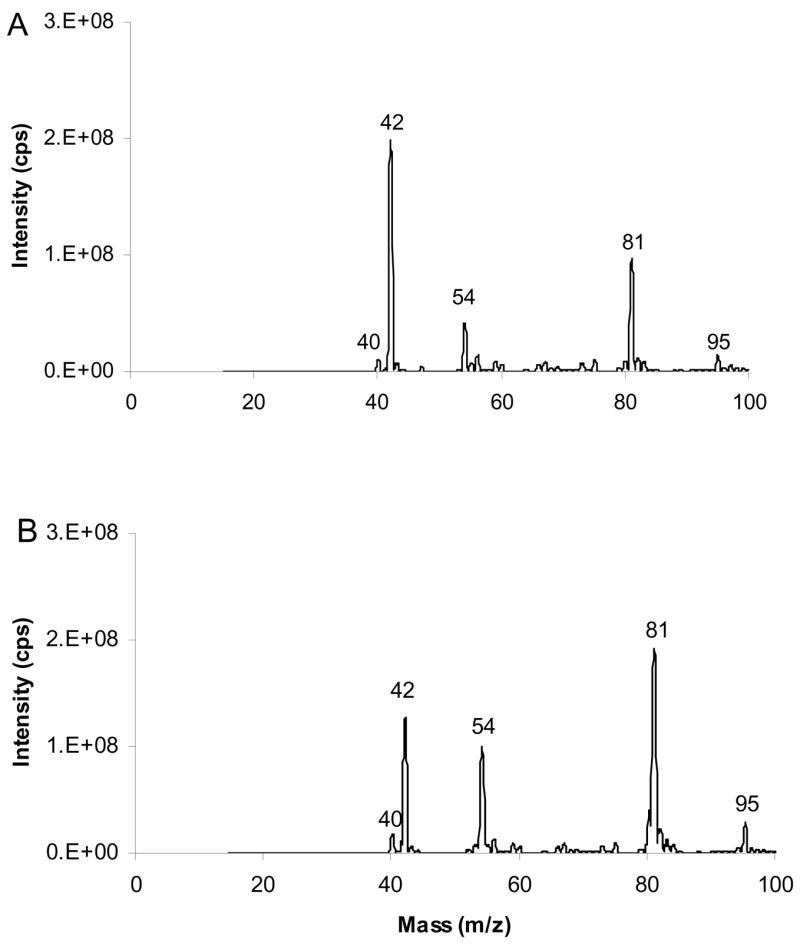
APCI mass spectra of CH3CN. (A) N2 (B) He were used as the nebulizer and auxiliary gases. The spectra include ions at m/z 40 and 42, formed by loss and gain of H, and at m/z 54, 81 and 95, generated by ion/molecule reactions of acetonitrile.
APCACI-MS of TAG
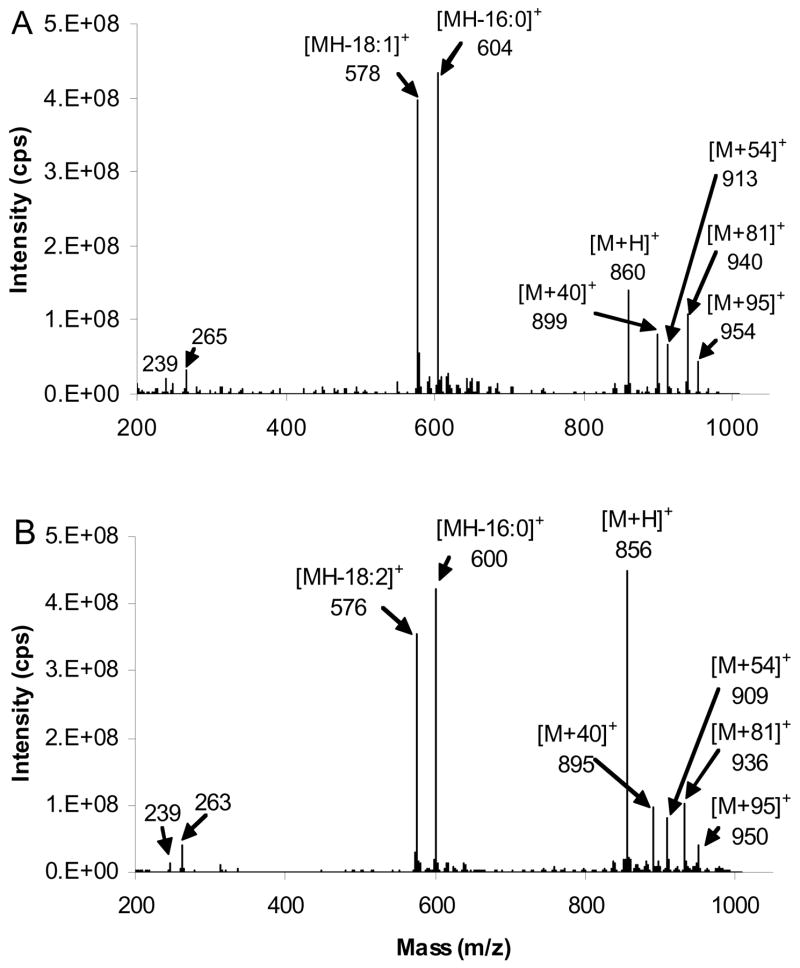
Figure 2A and 2B shows the single-stage MS of TAG of the form ABB with a monoene or diene as fatty acyl group B, 16:0/9-18:1/9-18:1 and 16:0/9,12-18:2/9,12-18:2. The major ions are MH+, [M-RCO2]+ ions from loss of fatty acid moieties, [M+54]+, [M+40]+, [M+81]+ and [M+95]+. [RCO]+ (ketene ions) derived from the fatty acyl moieties themselves were also present at low relative abundance. The MH+ ion intensity for the diene-containing TAG is about double the intensity of the monoene-containing TAG compared to the acyl and ketene neutral loss peaks, relative to the base peak. The [M+40]+ species indicates that the [C2H2N]+ ion from acetonitrile adds to the TAG, and analogous ions have been reported in the acetonitrile CI mass spectra of monoene FAME.49 The [M+54]+ ion corresponds to the addition of [C3H4N]+ to the TAG, consistent with results obtained for FAME in our previous papers.43–47
Figure 2.
APCACI-MS spectra of (A) (16:0/9-18:1/9-18:1)-TAG (B) (16:0/9,12-18:2/9,12-18:2)-TAG. MH+, [M-RCO2]+ ions arise from loss of fatty acid moieties, [M+54]+ ions, [M+40]+, [M+81]+ and [M+95]+.
We first focus interest on the [M+54]+ species since it is by far the best studied adduct ion for analysis of position of double bonds in the carbon chain. The mass spectra are typified by that of rac-glyceryl-1,3-9-octadecenoate-2-palmitate, in which the specific ions are observed: MH+ at m/z 860; two [M-RCO2]+ ions at m/z 604 and 578, corresponding to loss of palmitate to yield [BB]+, loss of octadecenoate to give [AB]+ respectively; [M+54]+ at m/z 913; [M+40]+ at m/z 899; [M+81]+ at m/z 940. Starting with [M+54]+, we discuss spectra arising from collisional dissociation of all the adduct ions.
[M+54]+
APCACI-MS/MS of Monoene-Containing TAG
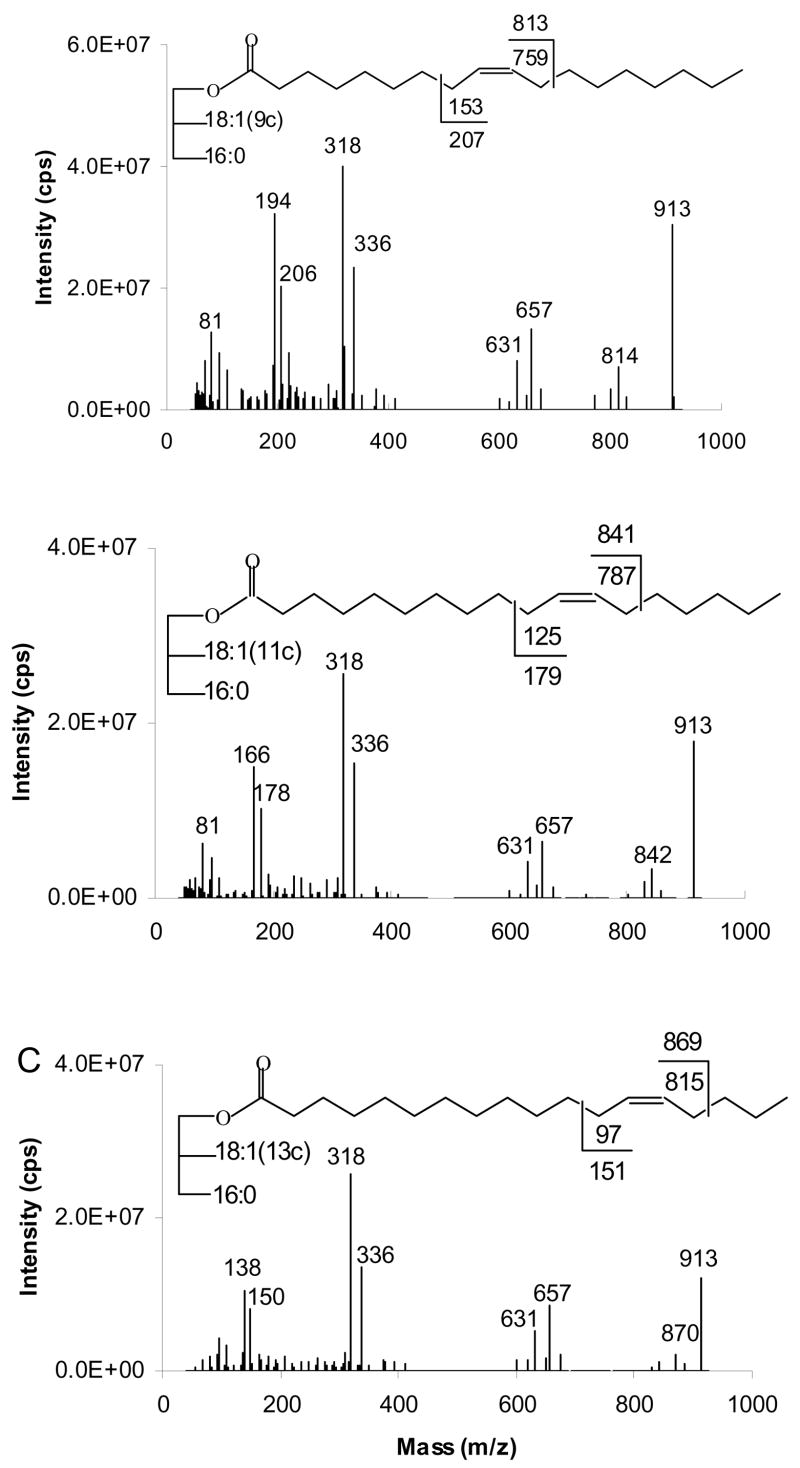
Figure 3 presents the APCACI MS/MS spectra of a series of three ABB TAG isomeric only in the position of the double bond on the monoene group: (16:0/9-18:1/9-18:1)-TAG, (16:0/11-18:1/11-18:1)-TAG and (16:0/13-18:1/13-18:1)-TAG. Mass spectra are generated by collisional dissociation of the isolated [M+54]+ ions. All of the MS/MS spectra show abundant [RCO2H +54]+ at m/z 336, the adduct of monoene fatty acyl moieties and MIE. MS/MS fragmentation of [M+54]+ of TAG also resulted in the adducts of ketene (generated from fatty acyl groups) and 54 ions [RCH=C=O + 54]+, analogous to the [M+54-32]+ loss of methanol in corresponding FAME reported previously. The [RCH=C=O + 54]+ peak at m/z 318 is the base peak. The spectra also contain ions [BB+54]+ and [AB+54]+ at m/z 657 and 631, reflecting neutral loss of 16:0 and 18:1, respectively from [M+54]+.
Figure 3.
[M+54]+- based APCACI-MS/MS spectra (A) (16:0/9-18:1/9-18:1)-TAG (B) (16:0/11-18:1/11-18:1)-TAG (C) (16:0/13-18:1/13-18:1)-TAG. Collisional dissociation of m/z 913 yields diagnostic ions corresponding to cleavage either vinylic or allylic to the site of the erstwhile double bond.
Upon collisional activation, [M+54]+ fragmentation to yield diagnostic ions. These ions correspond to cleavage either vinylic or allylic to the site of the erstwhile double bond, as indicated on the structures in Figure 3. The site of bond breakage for diagnostically important ions and the ion mass expected for homolytic bond breakage, with and without the m/z 54 adduct, is displayed on the structure of the TAG in each spectrum. Consistent with our nomenclature for CACI of FAME, we define the α diagnostic ion as containing the remaining glycerol lipid and ω diagnostic ion as containing the terminal methyl group of the fatty acyl chain. The strongest α diagnostic ion is due to allylic cleavage and appears at 1 u above the expected mass due to H transfer from neutral to ion. In contrast, the strong ω diagnostic ions are observed vinylic and allylic to the former site of the double bond, and are 1 unit lower than those expected from homolytic cleavage. Smaller satellite ions at ±14 were also observed. The ω diagnostic ions for (16:0/9-18:1/9-18:1)-TAG, (16:0/11-18:1/11-18:1)-TAG and (16:0/13-18:1/13-18:1)-TAG appear at m/z 194–206, 166–178, and 138–150, respectively, while the α diagnostic ion diagnostic ions for these TAG appear at m/z 814, 842, and 870, respectively. These spectra show that TAG containing isomeric monoenes can be differentiated on the basis of APCACI collisional dissociation.
Abundant fragment ions in the m/z range from 50 to 110 were also observed in the spectra in Figure 3. These include a series of alkyl ions at m/z 57, 71, etc., and unsaturated series at m/z 67, 81, 95, etc. Similar ion series were observed under ESI condtions.32
APCACI-MS3 of Monoene-containing TAG
An important feature of unsaturated TAG fragmentation is the abundant [RCH=C=O+54]+, the ketene adduct ion. The mass of these ions suggests that they should undergo a similar charge-driven rearrangement and fragmentation as [M+54]+ of FAMEs to yield α and ω diagnostic ions. This hypothesis is supported by MS3 experiments performed on abundant [RCH=C=O + 54]+ ion, at m/z 318. The resultant APCACI-MS/MS/MS spectra are displayed in Figure 4. By analogy to the fragmentation of FAME [M+54]+, each isomer yields fragments characteristic of double bond position, and corresponding to allylic cleavage. The α diagnostic ions of the m/z 318 ion, [RCH=C=O + 54]+, where fatty acyl groups are 9-18:1, 11-18:1, and 13-18:1 appear at m/z 220, 248, and 276, respectively, at mass 1 u higher than would be expected from homolytic bond cleavage. The ω diagnostic ions of corresponding 318 ions appear at m/z 206, 178 and 150, one mass unit lower than expected from homolytic cleavage. Thus, each of the three positional isomers yields a strong and unique APCACI-MS3 spectrum that permits unambiguous identification of double bond location.
Figure 4.
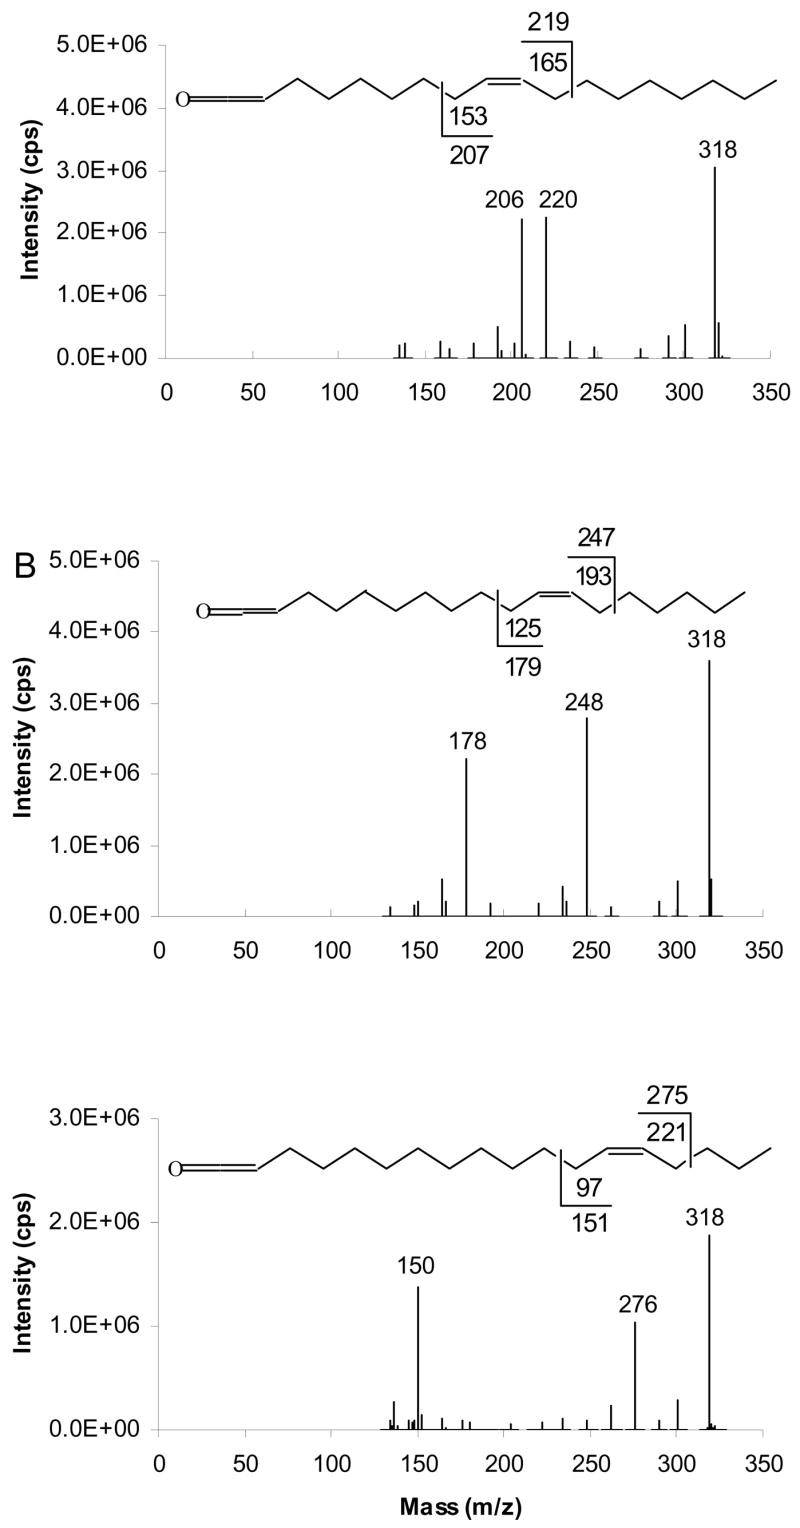
[M+54]+- based APCACI-MS/MS/MS spectra of (A) (16:0/9-18:1/9-18:1)-TAG (B) (16:0/11-18:1/11-18:1)-TAG (C) (16:0/13-18:1/13-18:1)-TAG. The [ketene+54]+ ions at m/z 318 derived from MS/MS of [M+54] of monoene TAG were selected and collisionally dissociated (m/z 913 → m/z 318 → products) to yield a pair of diagnostic ions. Each of these pairs of diagnostic ions is unique to a particular isomer.
APCACI-MS/MS of Dienes-containing TAG
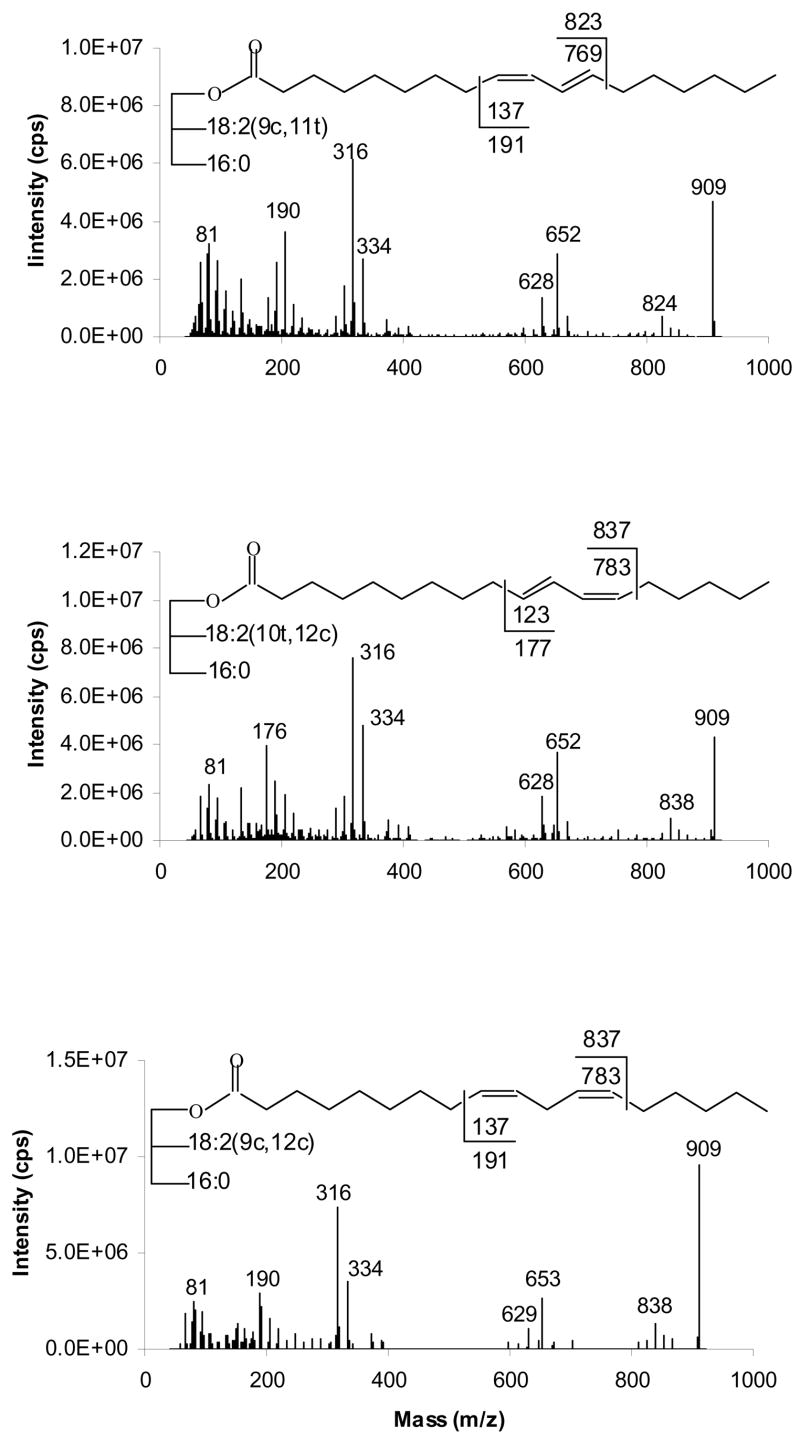
In Figure 5 we present the APCACI-MS/MS mass spectra of TAG containing 18:2 fatty acyl groups, two with conjugated double bonds, and the acyl group of linoleic acid, with a homoallylic (methylene-interrupted) set of double bonds. The spectra show abundant [M+54]+ at m/z 909, [RCO2H +54]+ at m/z 334, [ketene+54]+ at m/z 316, [BB]+ at m/z 652 or 653, [AB]+ at m/z 628 or 629 as well as two diagnostic ions.
Figure 5.
[M+54]+- based APCACI-MS/MS spectra of m/z 909 from (A) (16:0/9,11-18:2/9,11-18:2)-TAG, (B) (16:0/10,12-18:2/10,12-18:2)-TAG and (C) (16:0/9,12-18:2/9,12-18:2)-TAG. Cleavages directly before the first double bond and immediately after the second, as shown in the structures, give rise to diagnostic ions.
For TAG containing conjugated double bonds, C-C cleavage occurs vinylic to the erstwhile double bond producing α and ω diagnostic ions. Figure 5A and 5B show MS/MS spectra of TAG containing two conjugated 18:2, the 9,11 and 10,12 isomers, respectively. The α and ω diagnostic ions for (16:0/9,11-18:2/9,11-18:2)-TAG appear at m/z 824 and 190, respectively while the analogous ions for (16:0/10,12-18:2/10,11-18:2)-TAG occur at m/z 838 and 176, respectively. As with the TAG containing the monoenes, the α ions appear at 1 u above the expected mass while the ω ions appear at masses 1 unit lower than those expected from homolytic cleavage.
For TAG containing homoallylic dienes, collisional dissociation of the [M+54]+ ion also proceeds via bond cleavage at a position vinylic to the site of the original double bond. For (9,12-18:2/16:0/9,12-18:2)-TAG, cleavage directly before the first double bond and immediately after the second gives rise to the diagnostic ions at m/z 190 and 838, as indicated in Figure 5C. As with the TAG containing monoenes, the α ions appear at one u above the expected mass while the ω ions appear at masses 1 unit lower than those expected from homolytic cleavage.
APCACI-MS3 of diene-containing TAG
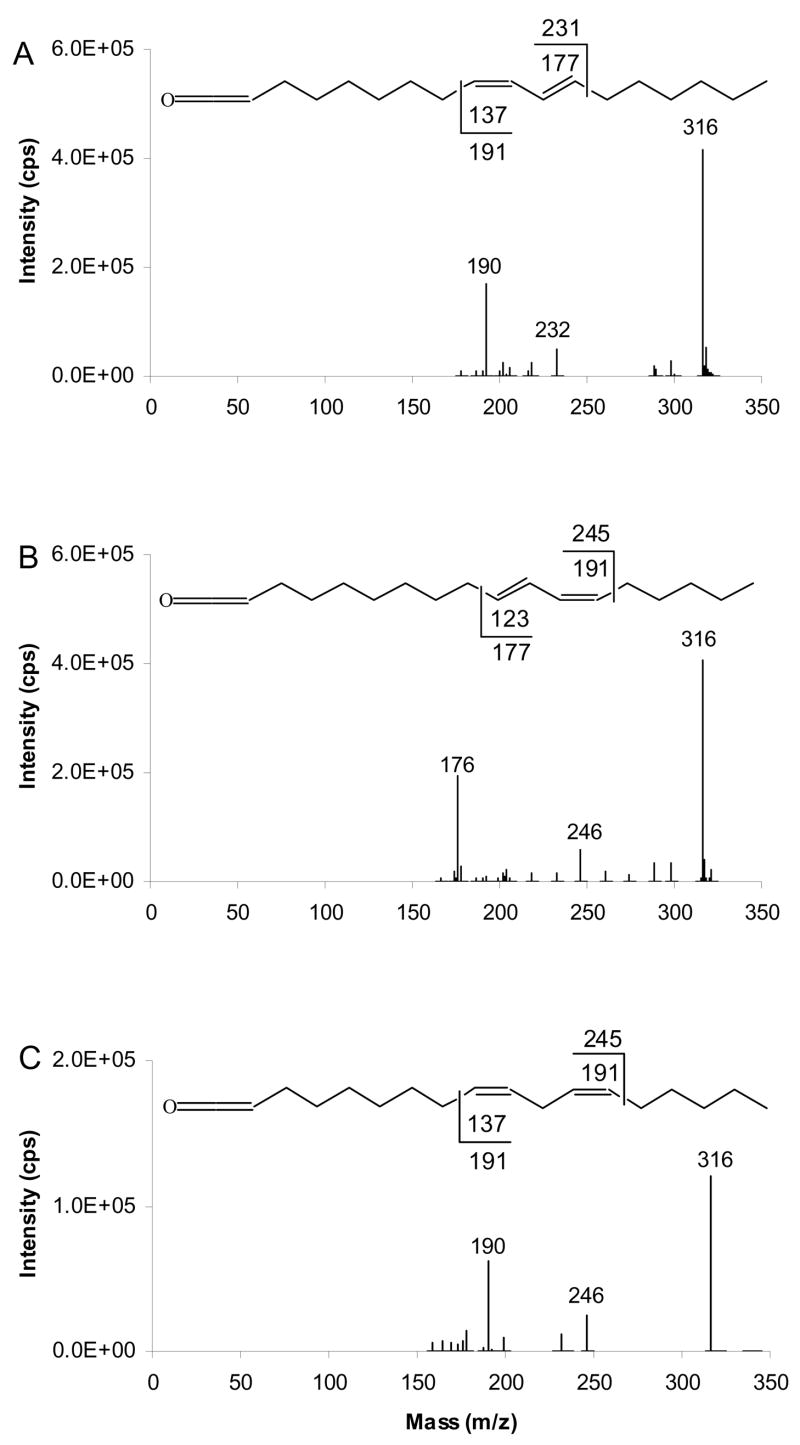
Figure 6 shows the APCACI-MS/MS/MS spectra of a series of TAG containing dienes. The [ketene+54]+ ions at m/z 316 derived from MS/MS of [M+54]+ of TAG were selected and collisionally dissociated to yield MS3 spectra. In Figure 6A and B, ketene derived from TAG containing 9,11-18:2 conjugated fatty acyl group yields m/z 190 and 232 diagnostic ions and can readily be distinguished from ketene derived from TAG containing 10,12-18:2 conjugated fatty acyl group, where m/z 176 and 246 are the diagnostic ions. The APCACI MS/MS/MS spectrum of ketene derived from (16:0/9,12-18:2/9,12-18:2)-TAG is shown in Figure 6C. The diagnostic ions are m/z 190 and 246. These ions originate from C-C bond cleavage at a position that is vinylic to the site of the former double bonds and, as with the TAG containing monoenes, the α ions appear at one u above the expected mass while ω ions appear at masses 1 unit lower than those expected from homolytic cleavage. These spectra show fragments analogous to those presented in figure 4.
Figure 6.
[M+54]+- based APCACI-MS/MS/MS spectra of (A) (16:0/9,11-18:2/9,11-18:2)-TAG, (B) (16:0/10,12-18:2/10,12-18:2)-TAG and (C) (16:0/9,12-18:2/9,12-18:2)-TAG. The [ketene+54]+ ions derived from [M+54]+ of diene TAG (m/z 909 → 318 → products) yield two fragments characteristic of double bond position.
[M+40]+
APCACI-MS/MS of monoene-containing TAG
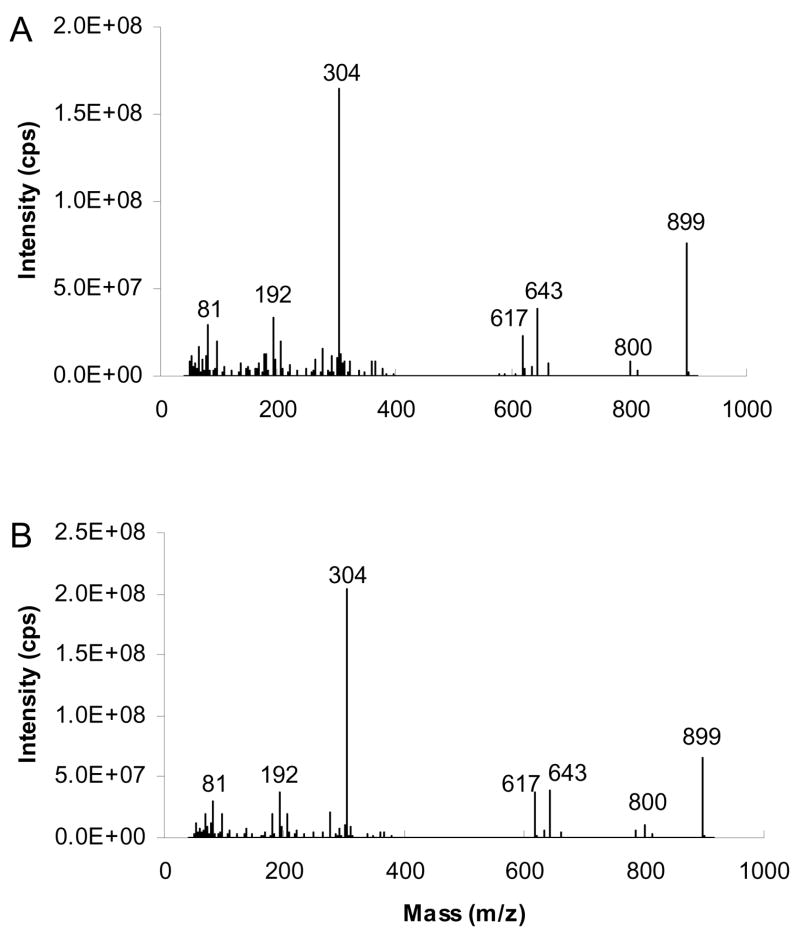
The APCACI MS/MS spectra of [M+40]+ adducts of (16:0/9-18:1/9-18:1)-TAG, (16:0/11-18:1/11-18:1)-TAG and (16:0/13-18:1/13-18:1)-TAG are shown in Figure 7. The base peaks obtained for all three TAG are ions at m/z 304 arising from the adducts of ketene and 40 ions [RCH=C=O + 40]+. Unlike the [M+54]+ MS/MS spectra of figure 3, no loss of acyl group is observed from the [M+40]+ ion. The other expected products for all TAG are the m/z 643 and m/z 617 arising by neutral loss of 16:0 and 18:1, respectively, from [M+40]+ complex. Abundant fragment ions in the m/z range from 50 to 110 were also observed in the spectra in Figure 7. These include a series of alkyl ions at m/z 57, 71, etc., and unsaturated series at m/z 67, 81, 95, similar to those observed under ESI condtions.32
Figure 7.
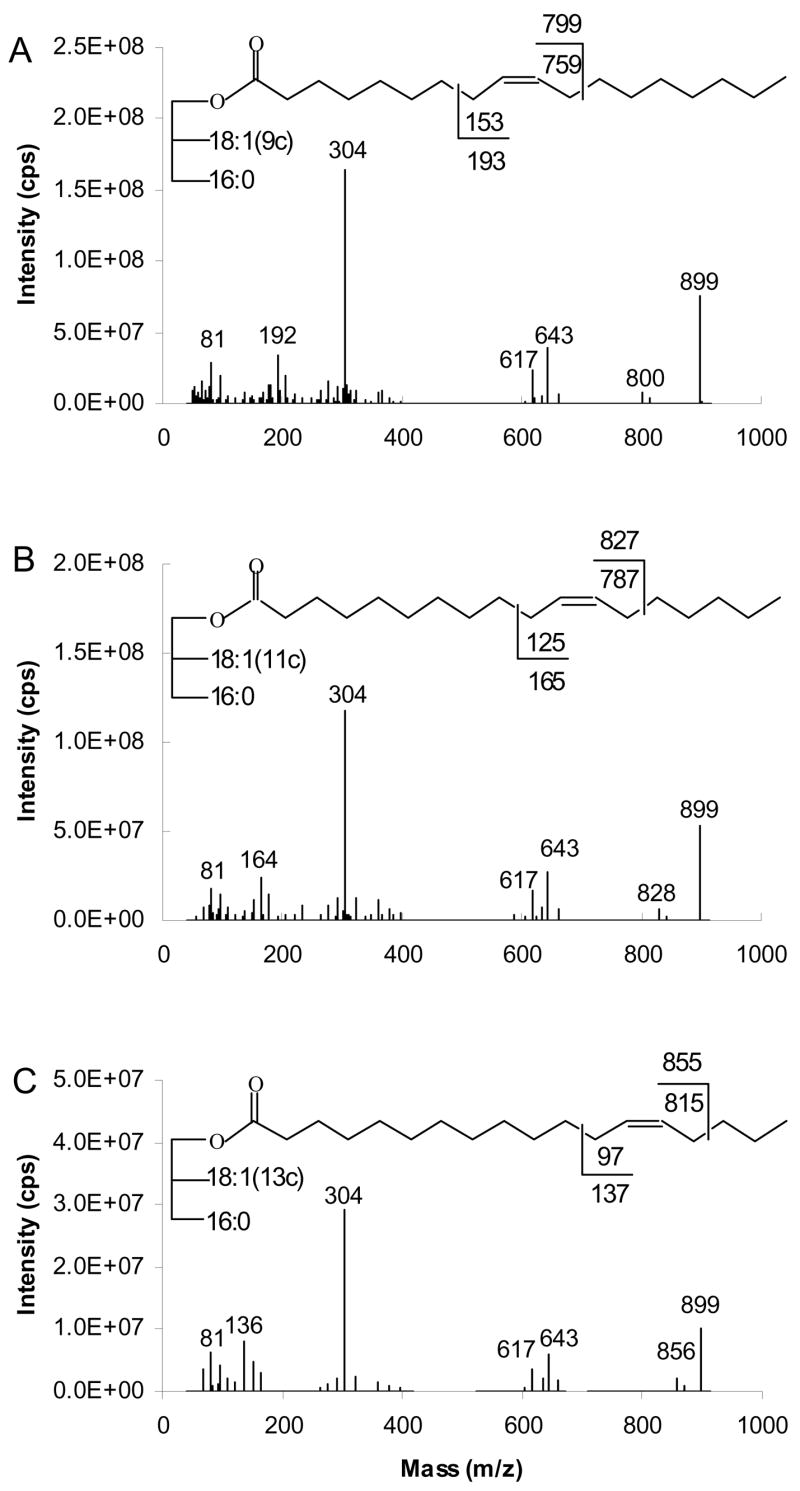
[M+40]+- based APCACI-MS/MS spectra of m/z 899 for (A) (16:0/9-18:1/9-18:1)-TAG (B) (16:0/11-18:1/11-18:1)-TAG (C) (16:0/13-18:1/13-18:1)-TAG. Specific cleavages at the allylic carbons shown in the structures at the top of each spectrum give rise to a pair of diagnostic ions.
The spectra contain two diagnostic ions, with dominant cleavage allylic to the former site of the double bond, as indicated on the structures in Figure 7. Again, the α ions appear at 1 u above the expected mass, thus implying hydrogen transfer from neutral to ion, while ω ions appear at masses 1 unit lower than those expected from homolytic cleavage indicating the reverse. For (16:0/9-18:1/9-18:1)-TAG, the ion appearing at m/z 800 is the α diagnostic ion and at m/z 192 is ω diagnostic ion. The analogous ions are found at m/z 828 and 164 for (16:0/11-18:1/11-18:1)-TAG and at m/z at 856 and 136 for (16:0/13-18:1/13-18:1)-TAG respectively. We also found satellite ions at ±14 u are also observed at lower intensity.
APCACI-MS3 of monoene-containing TAG
The results presented above show that [RCH=C=O + 40]+ ions at m/z 304, the adduct of ketene from fatty group and C2H2N+, are generated in MS/MS. The generation of [RCH=C=O + 40]+ creates the opportunity to analyze the product ions in MS3 in order to confirm the double bond location in unsaturated fatty acyl substituents, indicated in the MS/MS data. Diagnostic ions produced from collisional dissociation of these ions correspond to C-C bond cleavage adjacent to either allylic sites of double bond and produce the α diagnostic ion containing the ketene group, and the ω diagnostic ion containing the terminal methyl group. Diagnostic ions analogous to those observed in figure 4 for the [RCH=C=O + 54]+ ions are observed. The α diagnostic ion appears at mass 1 u higher than would be expected from homolytic bond cleavage. While the ω diagnostic ion appears at one mass unit lower than expected from homolytic cleavage. Figure 8 shows MS/MS/MS spectra of (16:0/9-18:1/9c-18:1)-TAG, (16:0/11-18:1/11-18:1)-TAG and (16:0/13-18:1/13-18:1)-TAG. The α diagnostic ions resulting from [RCH=C=O + 40]+ ion at m/z 304, where fatty acyl groups are 9-18:1, 11-18:1 and 13-18:1 appear at m/z 206, 234, and 262, respectively. The ω diagnostic ions of corresponding ions at m/z 304 appear at m/z 192, 164 and 136. MS3 of [RCH=C=O + 40]+ is dominated by diagnostic ion fragments that stand out more clearly that diagnostic ions in MS/MS (figure 7) to unequivocally confirm double bond location.
Figure 8.
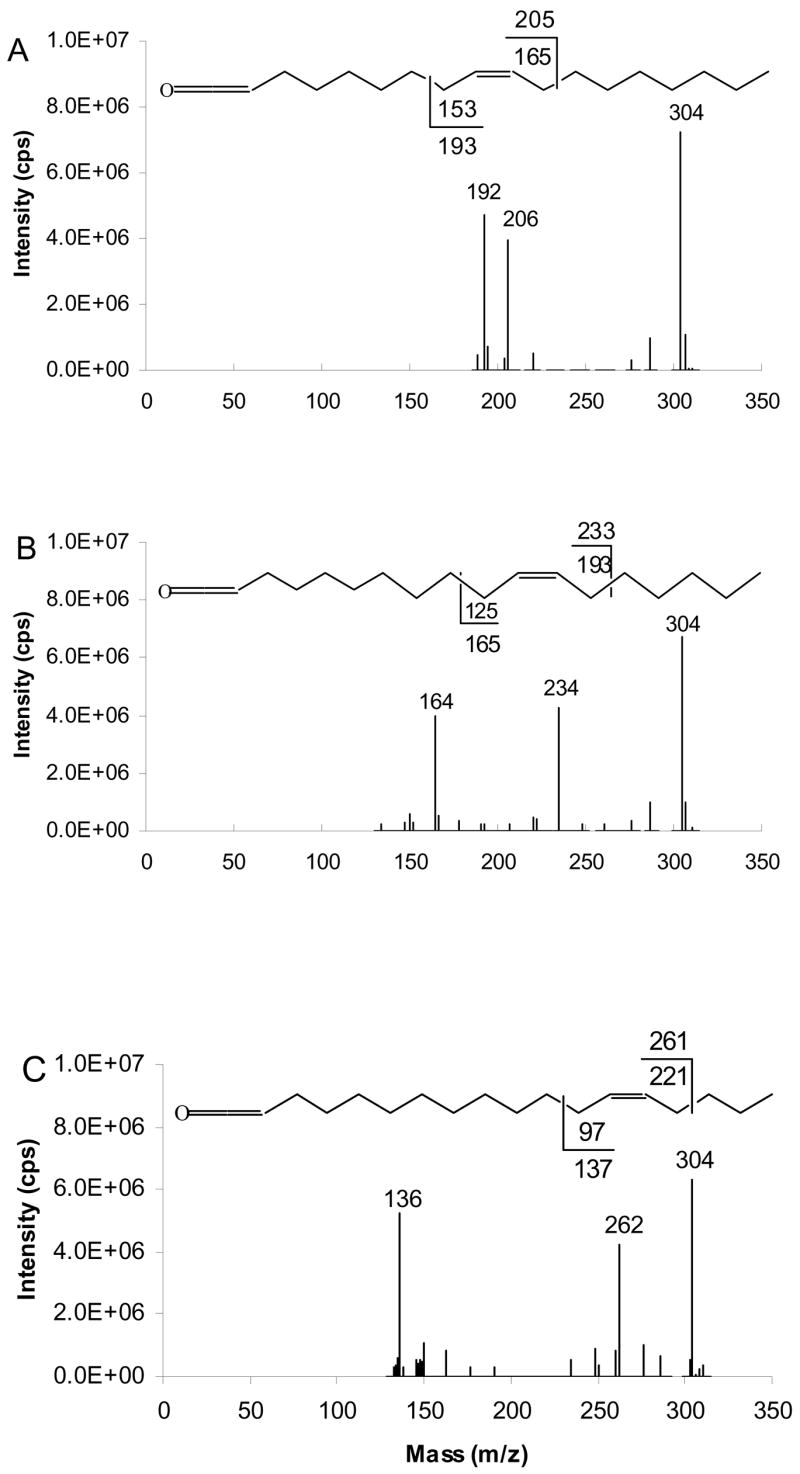
[M+40]+- based APCACI-MS/MS/MS spectra of m/z 899 → m/z 304 → products, for (A) (16:0/9-18:1/9-18:1)-TAG (B) (16:0/11-18:1/11-18:1)-TAG (C) (16:0/13-18:1/13-18:1)-TAG. The [ketene+40]+ ions at m/z 304 derived from MS/MS of [M+40] of monoene TAG were selected and collisionally dissociated to yield a pair of diagnostic ions. Each of these pairs of diagnostic ions is unique to a particular isomer.
APCACI-MS/MS of diene-containing TAG
Figure 9 shows the APCACI-MS/MS spectra of TAG, containing 18:2 fatty acyl groups, derived from collisional activation of [M+40]+ ions. The common products observed for all TAG are [M+40]+ at m/z 895, [RCH=C=O +40]+ at m/z 302, [BB]+ at m/z 639 and [AB]+ at m/z 615 arising, respectively, by loss of C16:0 and C18:2 from the [M+40]+ ions.
Figure 9.
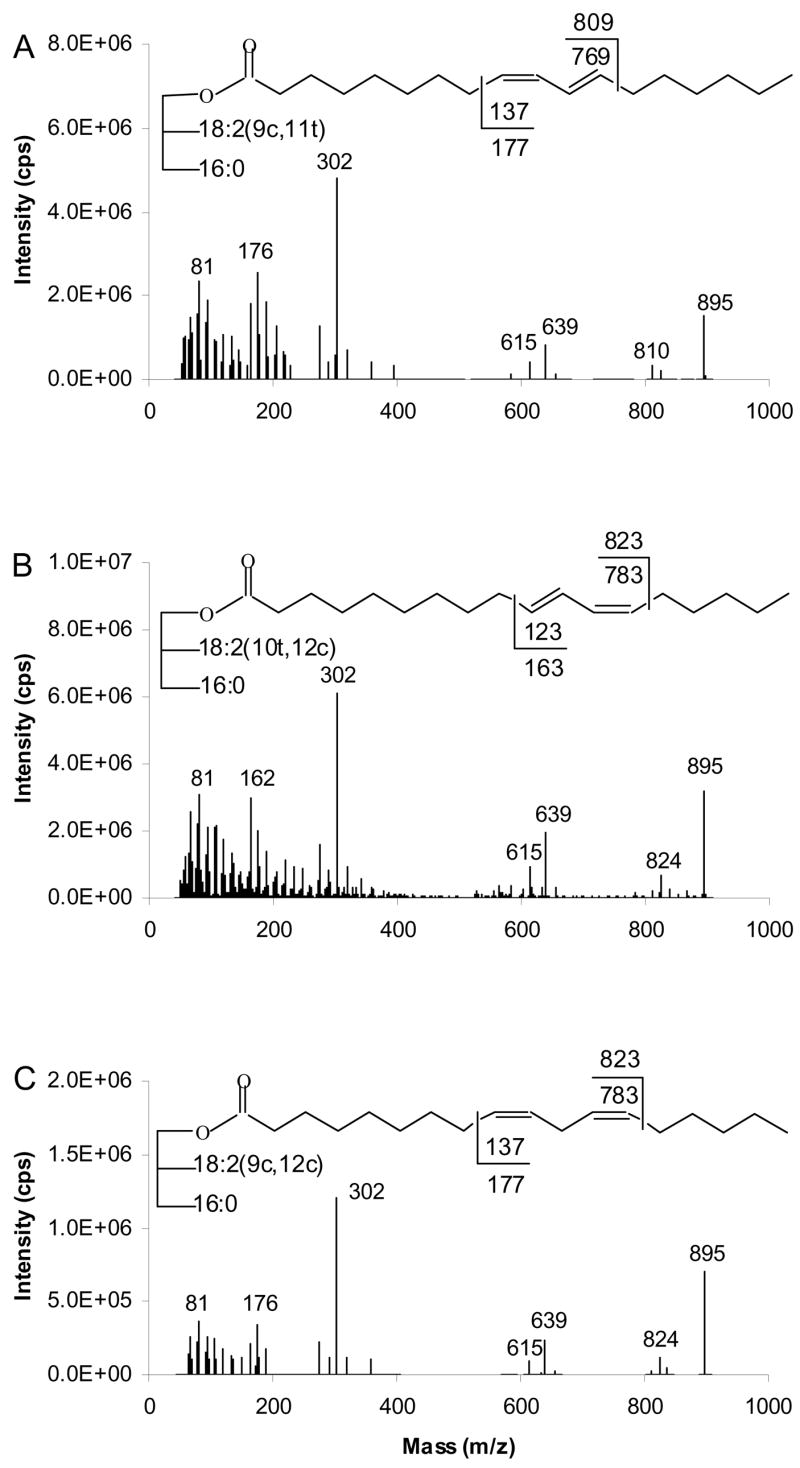
[M+40]+- based APCACI-MS/MS spectra for m/z 895 of (A) (16:0/9,11-18:2/9,11-18:2)-TAG, (B) (16:0/10,12-18:2/10,12-18:2)-TAG and (C) (16:0/9,12-18:2/9,12-18:2)-TAG. Cleavages directly before the first double bond and immediately after the second, as shown in the structures, give rise to diagnostic ions.
Spectra for TAG containing 9,11-CLA and 10,12-18:2 isomers are presented in Figure 9A and 9B, respectively. The α and ω diagnostic ions, at masses predicted by cleavage vinylic to the double bond, are observed at m/z 810 and 176 for (16:0/9,11-18:2/9,11-18:2)-TAG and m/z 824 and 162 for (16:0/10,12-18:2/10,11-18:2)-TAG. For (9,12-18:2/16:0/9,12-18:2)-TAG, vinylic cleavage is also observed to give rise to the diagnostic ions at m/z 176 and 824, as indicated in Figure 9C. As with the TAG containing monoenes, the α ions appear at one u above the expected mass while the ω ions appear at masses 1 unit lower than those expected from homolytic cleavage.
APCACI-MS3 or diene-containing TAG
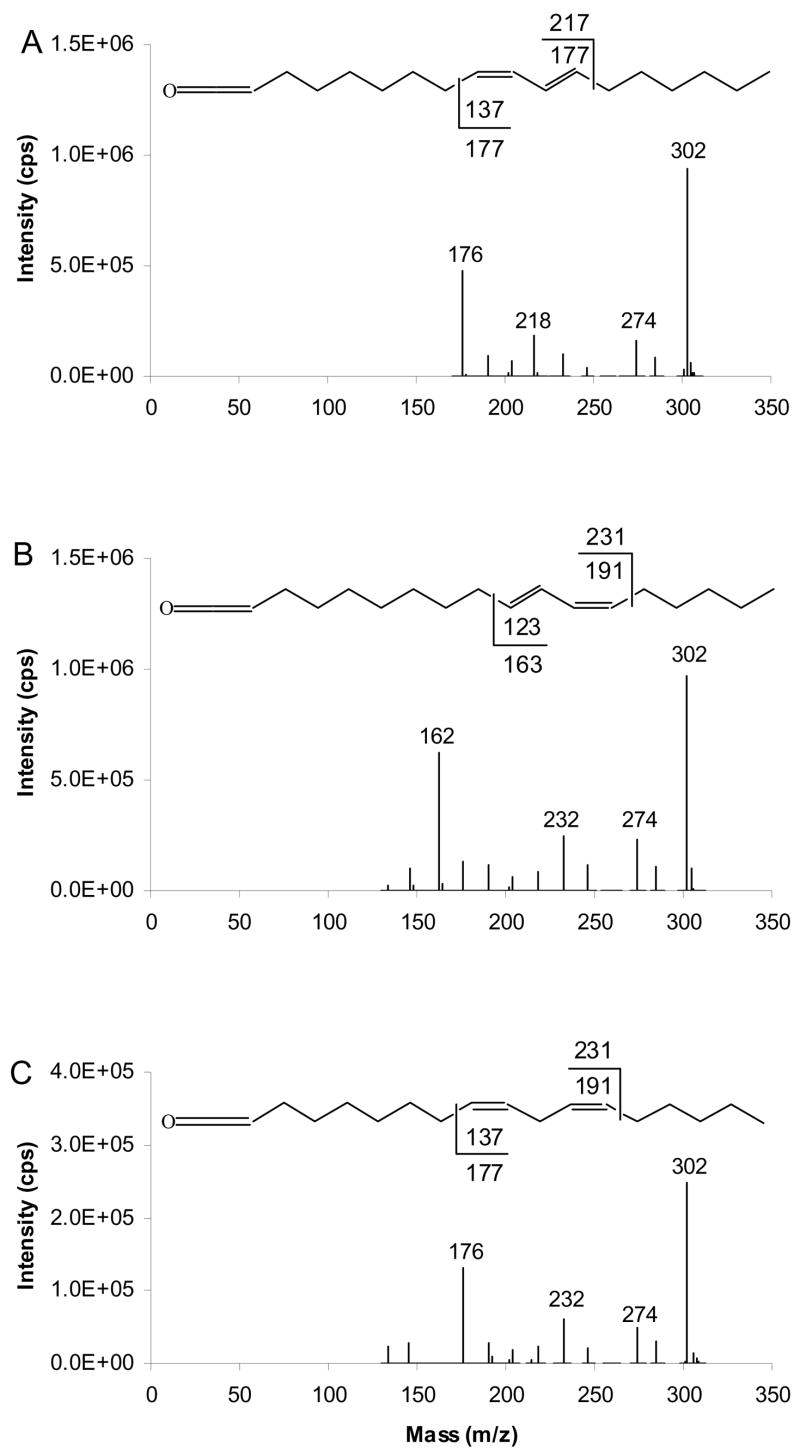
As with TAG containing monoene groups, collisional activation of the [ketene+40]+ ions at m/z 302 derived from MS/MS of [M+40]+ of TAG containing conjugated dienes produces a pair of diagnostic ions resulting from C-C bond cleavage at a position that is vinylic to either site of the conjugated diene unit. A single hydrogen atom is transferred to the charged fragment during α diagnostic ion formation while a single hydrogen atom is transferred to the neutral fragment during ω diagnostic ion formation. CAD of [RCH=C=O +40]+, where R is derived from 9,11-18:2, yields α diagnostic ions at m/z 218 and ω diagnostic ions at m/z 176, as shown in Figure 10A, whereas that of [RCH=C=O +40]+ of 10,12-18:2 gives ions at m/z 232 and 162 respectively (Figure 10B). Figure 10C shows that CAD of the [RCH=C=O+40]+ ion, where ketene containing 9,12-18:2 fatty acyl group yields α diagnostic ion at m/z 232 and ω diagnostic ion at m/z 176 originating from C-C bond cleavage at a position that is vinylic to each double bond. As with the TAG containing conjugated dienes, the α ions appear at 1 u above the expected mass while ω ions appear at masses 1 u lower than those expected from homolytic cleavage. In all three spectra, an ion occurring at m/z 274 is also apparent. This ion represents a neutral loss of 28 Da from [ketene+40]+ ion, likely to be either CO or ethylene.
Figure 10.
[M+40]+- based APCACI-MS/MS/MS spectra of (A) (16:0/9,11-18:2/9,11-18:2)-TAG, (B) (16:0/10,12-18:2/10,12-18:2)-TAG and (C) (16:0/9,12-18:2/9,12-18:2)-TAG. The [ketene+40]+ ions at m/z 302 derived from [M+40]+ of diene TAG (m/z 895 → 302 → products) yield two fragments characteristic of double bond position.
[M+81]+
APCACI-MS/MS of monoene-containing TAG
Figure 11 presents results from CAD of [M+81]+. The spectra are dominated by ions at m/z 345 arising from the adducts of ketene and 81 ions [RCH=C=O + 81]+. Each spectrum consists of products at the m/z 684 and m/z 658 arising by neutral loss of palmitic acid (16:0) and octadecenoic acid (18:1), respectively from [M+81]+.
Figure 11.
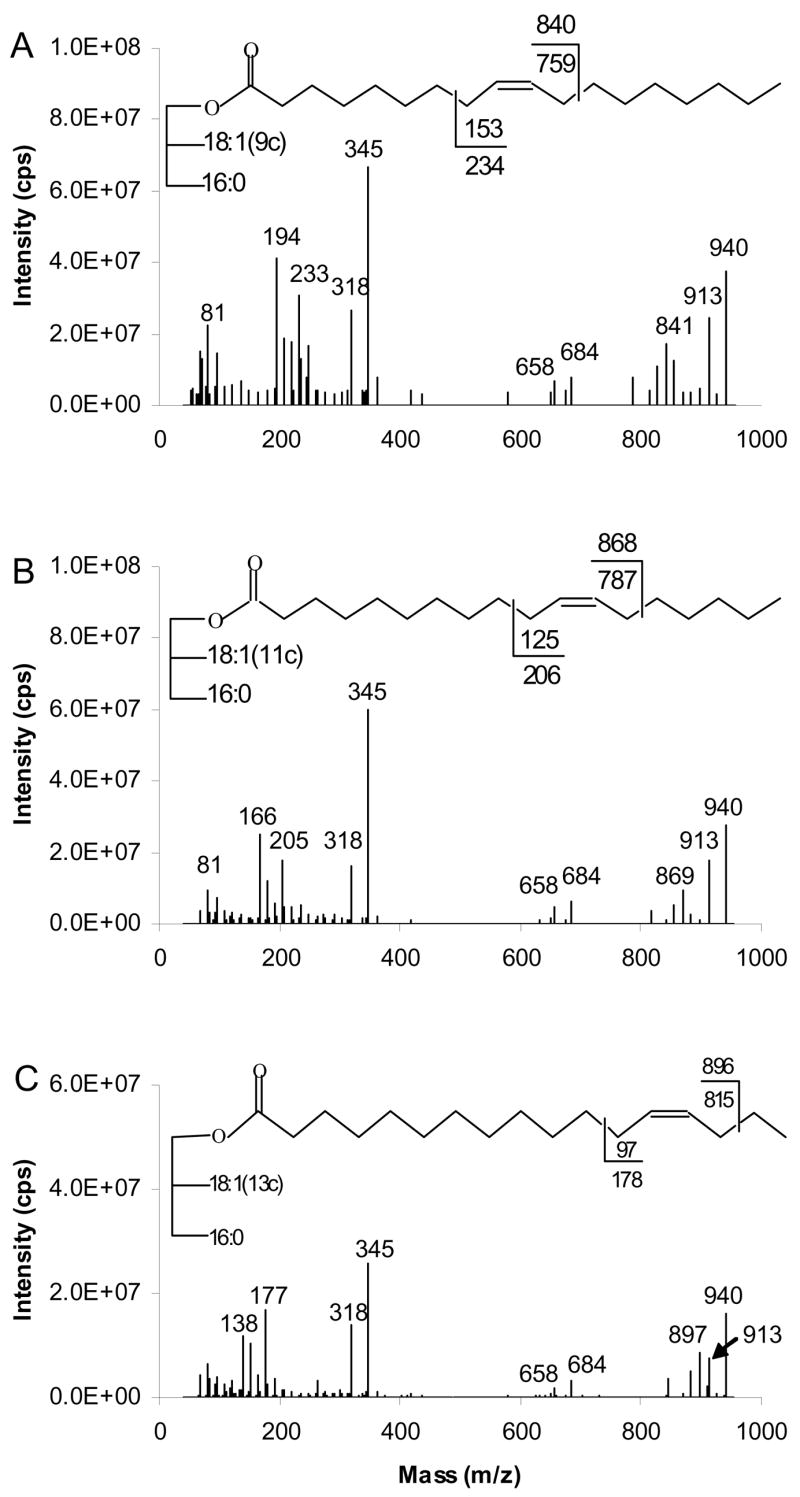
[M+81]+- based APCACI-MS/MS spectra of (A) (16:0/9-18:1/9-18:1)-TAG (B) (16:0/11-18:1/11-18:1)-TAG (C) (16:0/13-18:1/13-18:1)-TAG. Specific cleavages at the allylic carbons shown in the structures at the top of each spectrum give rise to a pair of diagnostic ions. Ions at m/z 194 (A), m/z 166 (B), and m/z 138 (C) correspond to ω diagnostic ions of [M+54]+, which appears at m/z 913 in all spectra.
Diagnostic ions corresponding to cleavage adjacent to either allylic site of the double bond were observed. For (16:0/9-18:1/9-18:1)-TAG (Figure 11A), the ion appearing at m/z 841 is the α diagnostic ion and at m/z 233 is ω diagnostic ion. Similarly, Figure 11B and C show diagnostic ions for the fragmentation of (16:0/11-18:1/11-18:1)-TAG at m/z 869 and 205 and for the fragmentation of (16:0/13-18:1/13-18:1)-TAG at m/z 897 and 177, respectively. The α ions appear at 1 u above the expected mass, while ω ions appear at masses 1 u lower than those expected from homolytic cleavage. Interestingly, in these spectra, we also found [M+54]+ diagnostic ions at m/z 913 resulting from CAD of [M+81]+. The latter ion may dissociate to [M+54], which appears in the spectrum at m/z 913, and further dissociate to an ω diagnostic ion. The [RCH=C=O + 54]+ ions at m/z 318 were also detected. The ω ions derived from [M+54]+ for (16:0/9-18:1/9-18:1)-TAG, (16:0/11-18:1/11-18:1)-TAG and (16:0/13-18:1/13-18:1)-TAG are at m/z 194, 166 and 138 respectively. α ions derived from [M+54]+ may be present at low levels but are isobaric with satellite ions of α derived from [M+81]+.
APCACI-MS/MS of diene-containing TAG
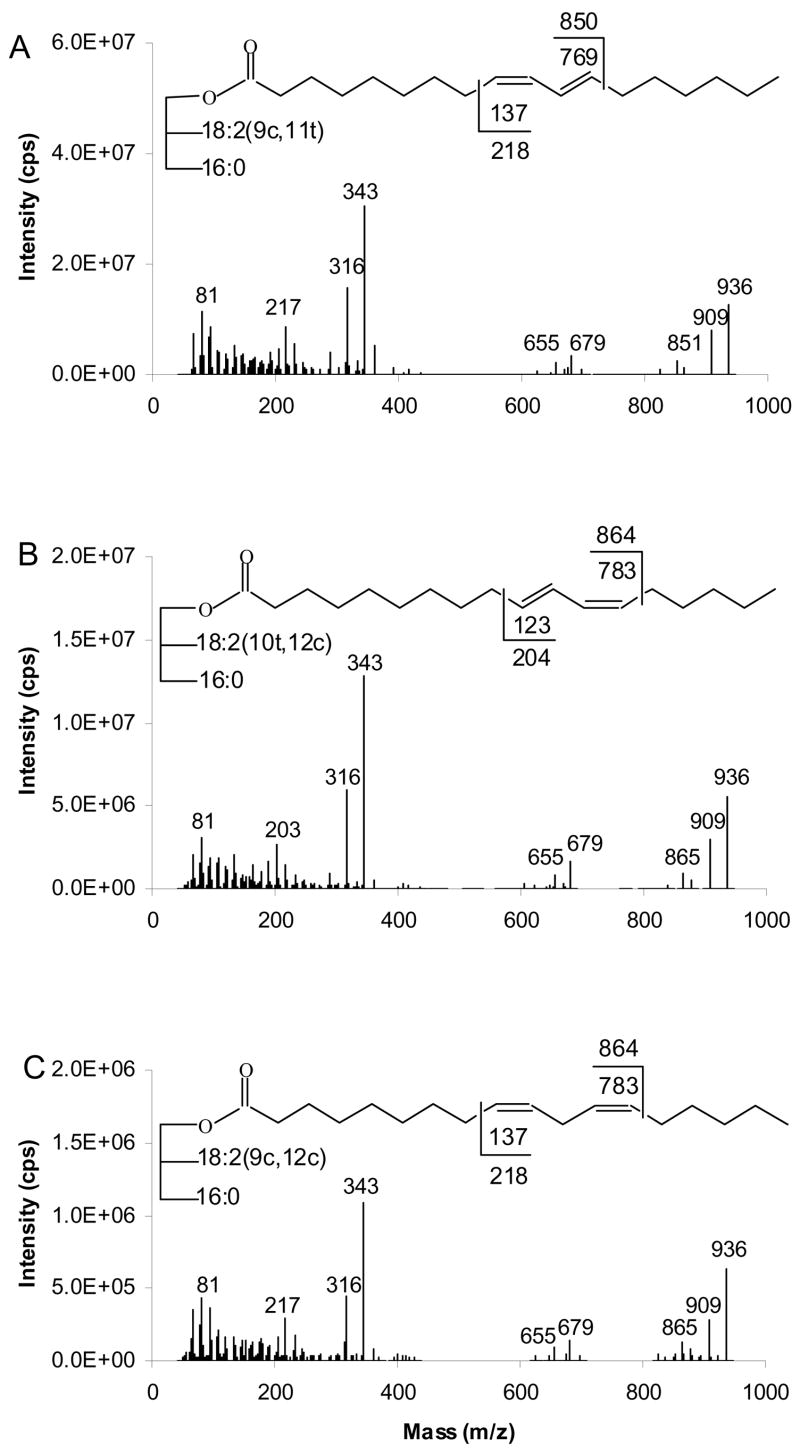
Figure 12 shows the APCACI-MS/MS mass spectra for collisional dissociation of [M+81]+ of TAG containing 18:2 fatty acyl groups. The ions observed for all TAG are [M+81]+ at m/z 936, [ketene+81]+ ion at m/z 343, [BB]+ at m/z 679 and [AB]+ at m/z 655 arising respectively, by loss of 16:0 and 18:2 from the [M+81]+ ions. The [M+54]+ ion at m/z 909 and [RCH=C=O + 54]+ at m/z 316 were also observed, similar to those observed in Figure 11. In Figure 12A and 12B, APCACI MS/MS spectra of TAG containing 9,11 and 10,12 18:2 isomers are presented, respectively. The α and ω diagnostic ions at masses predicted by cleavage vinylic to the former site of the double bond are observed at m/z 851 and 217 for (16:0/9,11-18:2/9,11-18:2)-TAG and m/z 865 and 203 for (16:0/10,12-18:2/10,11-18:2)-TAG. Figure 12C shows APCACI MS/MS spectrum of (16:0/9,12-18:2/9,12-18:2)-TAG. The cleavage vinylic to the former double bond gives rise to the diagnostic ions at m/z 217 and 865. As usual, the α ions appear at 1 u above the expected mass, while ω ions appear at masses 1 u lower than those expected from homolytic cleavage.
Figure 12.
[M+81]+- based APCACI-MS/MS spectra for m/z 936 of (A) (16:0/9,11-18:2/9,11-18:2)-TAG, (B) (16:0/10,12-18:2/10,12-18:2)-TAG and (C) (16:0/9,12-18:2/9,12-18:2)-TAG. Cleavages directly before the first double bond and immediately after the second, as shown in the structures, give rise to diagnostic ions.
[M+95]+
APCACI-MS/MS of monoene-containing TAG
Figure 13 shows the APCACI MS/MS spectra of (16:0/9-18:1/9-18:1)-TAG, (16:0/11-18:1/11-18:1)-TAG and (16:0/13-18:1/13-18:1)-TAG derived from collisional activation of [M+95]+. The base peaks obtained for all three TAG are ions at m/z 357 arising from the adducts of ketene (generated from fatty acid group) and 95 ions [RCH=C=O + 95]+. The other ions for all TAG are the m/z 698 and m/z 672 caused by neutral loss of 16:0 or 18:1, respectively, from [M+95]+ ion. Diagnostic ions were formed by allylic cleavage of double bond, which enable assignment of double bond position. The α and ω ions are observed at m/z 855 and 247 for (16:0/9-18:1/9-18:1)-TAG, at m/z 883, 219 for (16:0/11-18:1/11-18:1)-TAG and at m/z 911, 191 for (16:0/13-18:1/13-18:1)-TAG. The α ions appear at 1 u above the expected mass, while ω ions appear at masses 1 unit lower than those expected from homolytic cleavage.
Figure 13.
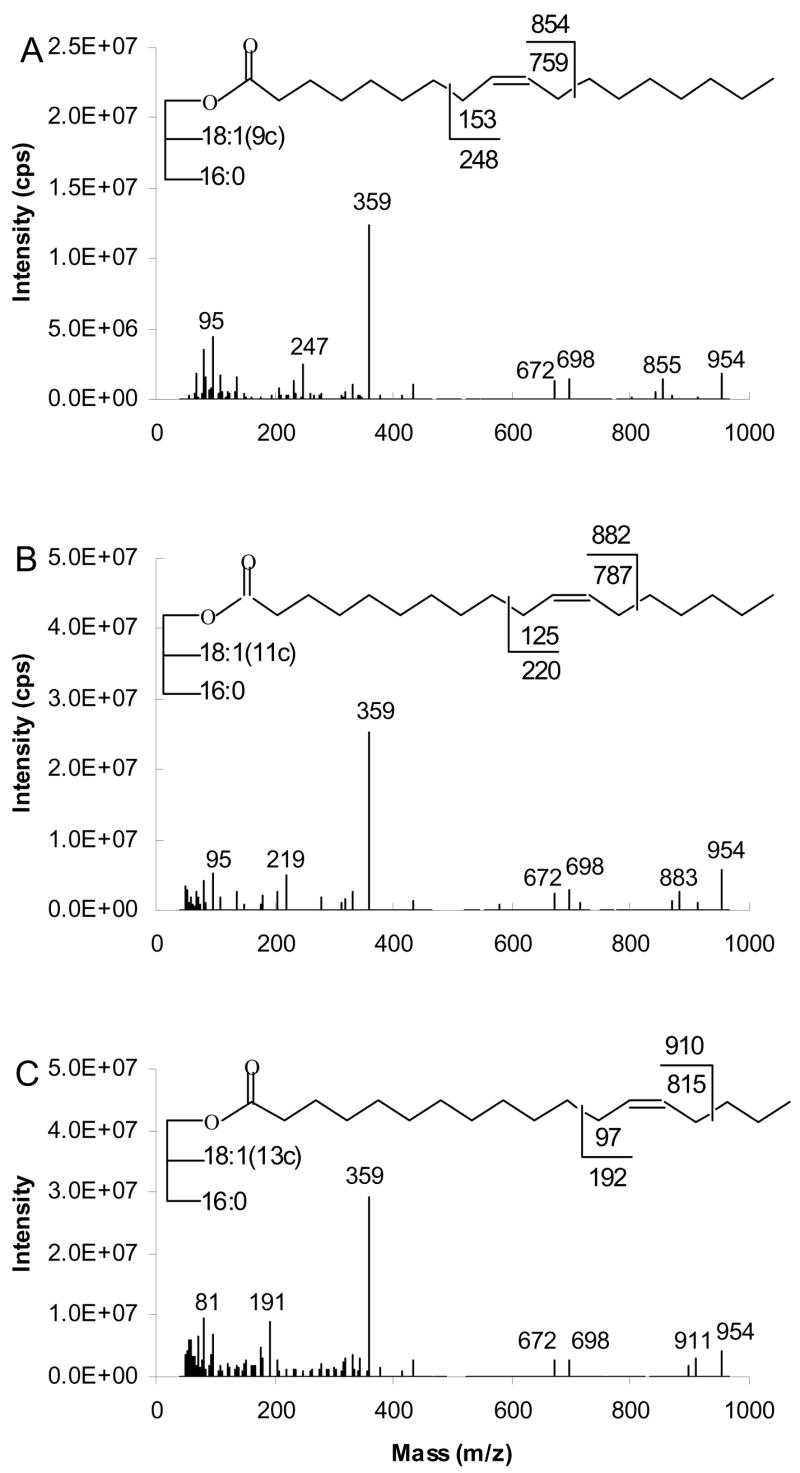
[M+95]+- based APCACI-MS/MS spectra for m/z 954 of (A) (16:0/9-18:1/9-18:1)-TAG (B) (16:0/11-18:1/11-18:1)-TAG (C) (16:0/13-18:1/13-18:1)-TAG. Specific cleavages at the allylic carbons shown in the structures at the top of each spectrum give rise to a pair of diagnostic ions.
APCACI-MS/MS of diene-containing TAG
Collisional activation of [M+95]+ ions of TAG containing dienes produces [RCH=C=O +40]+ ion at m/z 357, [BB]+ at m/z 694 and [AB]+ at m/z 670 caused respectively, by loss of 16:0 and 18:2 from the [M+95]+ ions, as presented in Figure 14. The α and ω diagnostic ions appear at masses predicted by cleavage vinylic to the double bonds.
Figure 14.
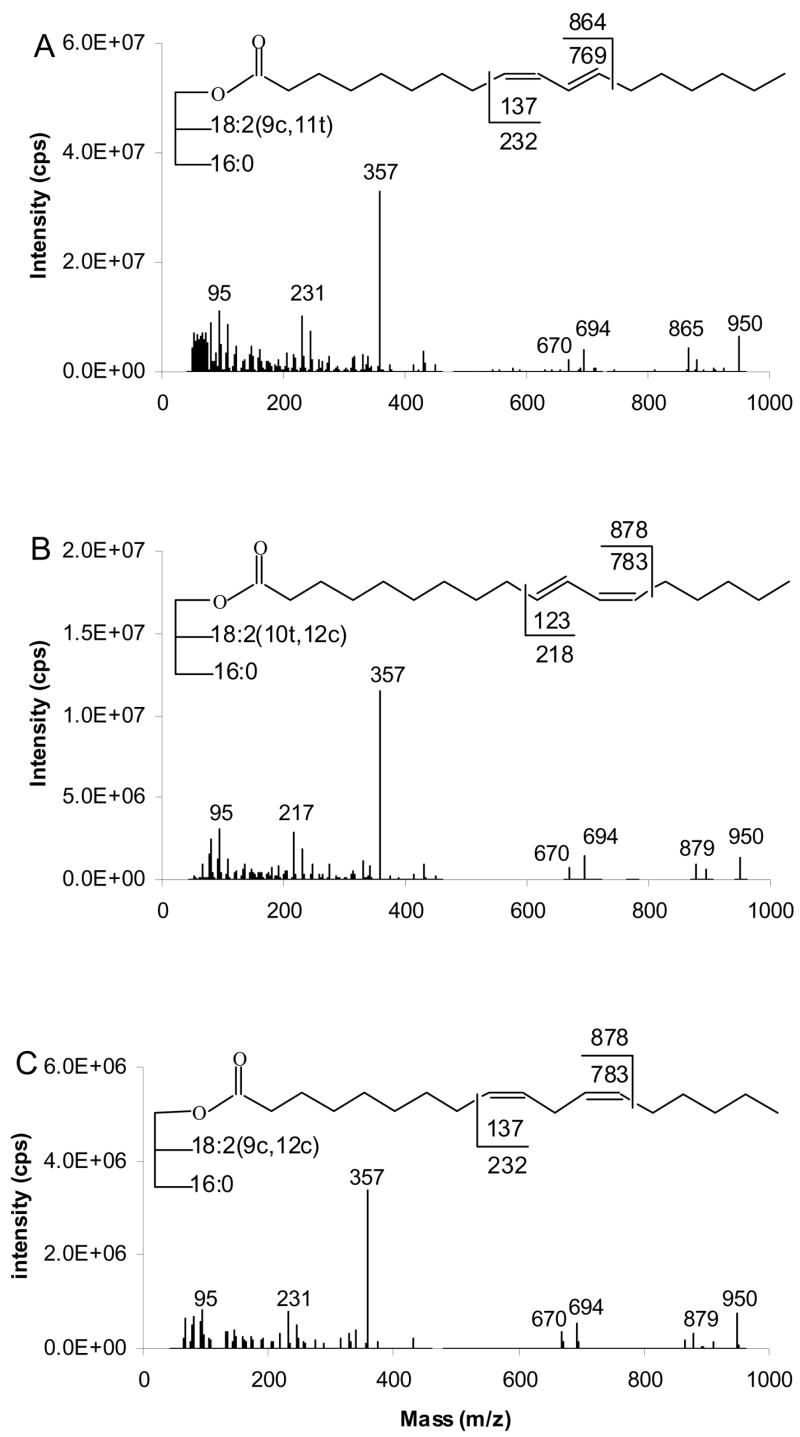
[M+95]+- based APCACI-MS/MS spectra for m/z 950 of (A) (16:0/9,11-18:2/9,11-18:2)-TAG, (B) (16:0/10,12-18:2/10,12-18:2)-TAG and (C) (16:0/9,12-18:2/9,12-18:2)-TAG. Cleavages directly before the first double bond and immediately after the second, as shown in the structures, give rise to diagnostic ions.
As shown in Figure 14A and 14B, the α and ω diagnostic ions for (16:0/9,11-18:2/9,11-18:2)-TAG are observed at m/z 865 and 231, respectively, while the analogous ions for (16:0/10,12-18:2/10,11-18:2)-TAG occur at m/z 879 and 217, respectively. For (16:0/9,12-18:2/9,12-18:2)-TAG, the α and ω diagnostic ions occur at m/z 879 and 231 respectively, as indicated in Figure 14C. The α ions appear at 1 u above the expected mass while the ω ions appear at masses 1 u lower than those expected from homolytic cleavage.
APCACI-MS3 performed on ketene adduct peaks for the [M+81]+ and [M+95]+ ions yielded low signal-to-noise spectra, even though the [M+81]+ and [M+95]+ intensities were similar to those of [M+40]+ and [M+54]+ that produced high quality spectra.
Positions of Acyl Groups on Glycerol Backbone
The relative intensity of neutral loss of fatty acyl groups or ketenes from TAG have long been known to be related to their relative positions (sn-2 vs sn-1,3) in conventional SI-MS/MS analysis. In APCACI-MS/MS, the neutral loss of a fatty acyl group from [M+40]+ of TAG yields [M+40-RCO2]+, while the neutral loss of a fatty acyl group from [M+54]+ of TAG yields [M+54-RCO2]+. We tested whether intensity ratios would yield similar regiospecific information for these ions.
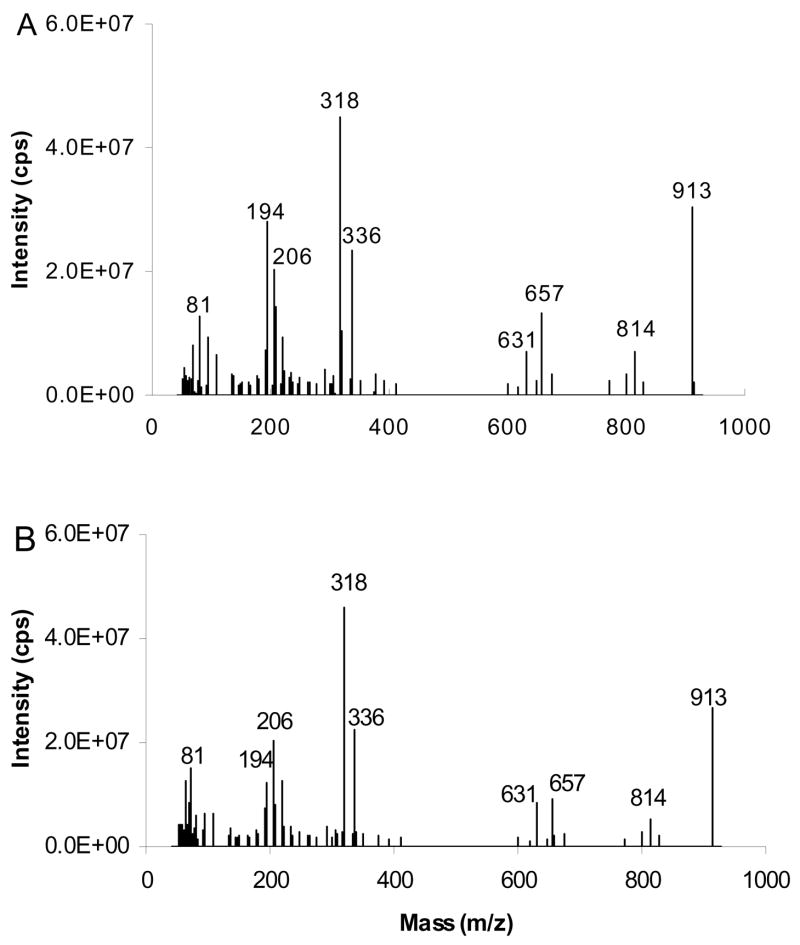
The MS/MS spectra of [M+40]+ of ABB and BAB type TAG containing 16:0 and 9-18:1 fatty acyl groups are given in Figure 15. The ions at m/z 643 and 617 reflect neutral losses of substituent 16:0 and substituent 9-18:1, respectively. The results indicate that ABB TAG produces a [BB+40]+/[AB+40]+ ratio of 1.68±0.08, whereas BAB TAG gives 1.06±0.07. Figure 16 shows similar data for the [M+54]+ adducts. The ions at m/z 657 and m/z 631, formed by neutral loss of 16:0 or 18:1, respectively, yield [BB+54]+/[AB+54]+ of 1.69±0.09 and 1.08±0.12 for TAG of the form ABB and BAB, respectively. Table 1 presents similar data in summary form for six different TAG, yielding highly reproducible and consistent ratios.
Figure 15.
[M+40]+- based APCACI-MS/MS spectra of m/z 899 for (A) (16:0/9-18:1/9-18:1)-TAG (B) (9-18:1/16:0/9-18:1)-TAG. Fragment ions reflecting neutral loss of the sn-2 fatty acyl group are less abundant than the corresponding ions reflecting such losses of either the sn-1 or sn-3 fatty acyl group.
Figure 16.
[M+54]+- based APCACI-MS/MS spectra of m/z 913 for (A) (16:0/9-18:1/9-18:1)-TAG (B) (9-18:1/16:0/9-18:1)-TAG. Fragment ions reflecting neutral loss of the sn-2 fatty acyl group are less abundant than the corresponding ions reflecting such losses of either the sn-1 or sn-3 fatty acyl group.
Table 1.
[BB+40]+/[AB+40]+ and [BB+54]+/[AB+54]+ in BAB and ABB type TAG, where A is 16:0 and B is a monoene or diene unsaturated fatty acyl substituent, respectively.
| [BB+40]+/[AB+40]+ | [BB+54]+/[AB+54]+ | |
|---|---|---|
| ABB | ||
| 16:0/9-18:1/9-18:1 | 1.68 ± 0.08 | 1.69 ± 0.09 |
| 16:0/9E,12E-18:2/9E,12E-18:2 | 1.61 ± 0.10 | 1.58 ± 0.10 |
| 16:0/9,11E-18:2/9,11E-18:2 | 1.73 ± 0.11 | 1.78 ± 0.10 |
| Mean±SD | 1.67 ± 0.06 | 1.68 ± 0.10 |
| BAB | ||
| 9c-18:1/16:0/9-18:1 | 1.06 ± 0.07 | 1.08 ± 0.12 |
| 9,12-18:2/16:0/9,12-18:2 | 1.10 ± 0.09 | 1.12 ± 0.14 |
| 9,11E-18:2/16:0/9,11E-18:2 | 1.13 ± 0.12 | 1.02 ± 0.13 |
| Mean±SD | 1.10 ± 0.04 | 1.07 ± 0.05 |
We have published extensively on the reaction and fragmentation of MI (m/z 54) with FAME using an gas chromatography introduction into an internal ionization 3D ion trap. This gas phase implementation of CACI is able to fully determine double bonds in all homoallylic (methylene-interrupted) FAME including those at very low concentration. It also determines double bond position and geometry in conjugated diene FAME, and in many FAME of unusual double bond structure. In FAME CACI spectra, the major adduct ion is the [M+54]+,40, 49 with smaller amounts of [M+40]+. The [M+54]+ has proven most useful for locating double bonds. Collisional dissociation of the [M+54]+ yields two diagnostic ions that are indicative of double bond position for homoallylic FAME39 and ion intensities provide information on double bond geometry in the specific case of conjugated dienes.42 Mechanistic and structural work indicates that the MIE ion can add to the double bond in a parallel or antiparallel manner, which determines subsequent fragmentation and H transfer.41 In all cases studied to date, H transfer is symmetric with respect to the ion or neutral loss: in the case of monoenes and dienes, the H transfer is to the ion, whereas H transfer is to the neutral with polyenes for both the α and ω ions. Here we observe that H transfer is always to the α and away from the ω ion. This result has no analytical consequences but may reflect a different mechanism or structure than found for FAME [M+54]+.
Cleavage sites of TAG adducts follows a clear pattern, similar to that observed for FAME [M+54]+ ions. Cleavage is allylic to the site of the erstwhile double bond of monoene-containing TAG for all α ions and for ω ions from [M+40]+, [M+81]+, and [M+95]+. Cleavage is both allylic and vinylic for ω ions from [M+54]+, and the [M+81]+ dissociate to yield ω ions at the same masses as [M+54]+. For diene-containing TAG, vinylic cleavage is observed for both α and ω ions.
The [M+40]+ ion appears to be the best choice for analysis. The intensity of this adduct is slightly greater than that of the [M+54]+ in MS mode. More importantly, the MS3 intensity for the ketene fragmentation is most intense of all the adducts, about double that of the [M+54] ketene ion. Finally, the [M+40]+ adduct yields two strong diagnostic ions in MS/MS, both due to allylic cleavage, whereas the [M+54]+ yields an extra ω ion due to vinylic cleavage which slightly complicates the spectrum.
Summary
APCACI using acetonitrile as an APCI reagent has been shown to be an effective method to obtain detailed structural information of TAG, including the location of double bonds along acyl groups and the position of acyl groups on the glycerol backbone. In addition to ions at m/z 40 and 54, ions at m/z 81 and 95 were observed. These ions appear to form a charged covalent adduct across carbon-carbon double bonds in TAG containing unsaturated fatty acyl groups, analogous to those observed for FAME. Collisionally activated dissociation of the [M+40]+, [M+54]+, [M+81]+ and [M+95]+ ions yields two or three diagnostic ions similar to those observed previously in FAME analysis.
With few exceptions, fragmentation behavior is similar for all four ions. For monoenes, the α ions containing the glycerol moiety yield strong fragments at the site allylic to the erstwhile double bond. For the ω ions containing the terminal methyl group of the fatty acyl chain, fragmentation is primarily allylic to the former site of the double bond for [M+40]+ and [M+95]+ and both vinylic and allylic for the [M+54]+ and [M+81]+. For dienes, cleavage is vinylic to the site of the former double bond for all adducts and for both α and ω ions. In all cases of monoenes and dienes, a H is transferred from the neutral to the α ions, but is transferred away from the ω ions.
The fragmentations of ketene adducts [RCH=C=O + 54]+ or [RCH=C=O + 40]+ in MS3 yields two strong diagnostic ions that locate the position of double bonds along fatty acyl chains. Finally, the ratios of [BB+40]+ :/[AB+40]+ and [BB+54]+ :/[AB+54]+ enable determination of the fatty acyl group regiospecificity on glycerol backbone. It is left to future work to establish whether this approach can determine the structures of other glycerolipids.
The extended plasma discharge observed with the present APCI ion source appears to be essential for production of sufficient reagent ions for reaction. While it is possible to run the source under these conditions for an extended period, a re-design of the source is probably required to contain the reactive plasma within a volume distant from the metal heater and other parts vulnerable to degradation with extended plasma exposure.
Acknowledgments
This work was supported by NIH grant GM071534.
References
- 1.Dhalla NS, Elimban V, Rupp H. Molecular and Cellular Biochemistry. 1992;116:3–9. doi: 10.1007/978-1-4615-3514-0_1. [DOI] [PubMed] [Google Scholar]
- 2.Goldberg IJ. Journal of Lipid Research. 1996;37:693–707. [PubMed] [Google Scholar]
- 3.Koyama K, Chen GX, Wang MY, Lee Y, Shimabukuro M, Newgard CB, Unger RH. Diabetes. 1997;46:1276–1280. doi: 10.2337/diab.46.8.1276. [DOI] [PubMed] [Google Scholar]
- 4.Saudek CD, Eder HA. American Journal of Medicine. 1979;66:843–852. doi: 10.1016/0002-9343(79)91126-4. [DOI] [PubMed] [Google Scholar]
- 5.Shimabukuro M, Ohneda M, Lee Y, Unger RH. Journal of Clinical Investigation. 1997;100:290–295. doi: 10.1172/JCI119534. [DOI] [PMC free article] [PubMed] [Google Scholar]
- 6.Stanley WC, Lopaschuk GD, McCormack JG. Cardiovascular Research. 1997;34:25–33. doi: 10.1016/s0008-6363(97)00047-3. [DOI] [PubMed] [Google Scholar]
- 7.Unger RH. Diabetes. 1995;44:863–870. doi: 10.2337/diab.44.8.863. [DOI] [PubMed] [Google Scholar]
- 8.Hites RA. Analytical Chemistry. 1970;42:1736. [Google Scholar]
- 9.Kallio H, Laakso P, Huopalahti R, Linko RR, Oksman P. Analytical Chemistry. 1989;61:698–700. doi: 10.1021/ac00182a012. [DOI] [PubMed] [Google Scholar]
- 10.Demirbuker M, Blomberg LG, Olsson NU, Bergqvist M, Herslof BG, Jacobs FA. Lipids. 1992;27:436–441. doi: 10.1007/BF02536385. [DOI] [PubMed] [Google Scholar]
- 11.Marai L, Myher JJ, Kuksis A. Canadian Journal of Biochemistry and Cell Biology. 1983;61:840–849. doi: 10.1139/o83-107. [DOI] [PubMed] [Google Scholar]
- 12.Cheung M, Young AB, Harrison AG. Journal of the American Society for Mass Spectrometry. 1994;5:553–557. doi: 10.1016/1044-0305(94)90004-3. [DOI] [PubMed] [Google Scholar]
- 13.Huang AS, Robinson LR, Gursky LG, Profita R, Sabidong CG. Journal of Agricultural and Food Chemistry. 1994;42:468–473. [Google Scholar]
- 14.Neff WE, Byrdwell WC. Journal of Liquid Chromatography. 1995;18:4165–4181. [Google Scholar]
- 15.Mottram HR, Evershed RP. Tetrahedron Letters. 1996;37:8593–8596. [Google Scholar]
- 16.Byrdwell WC, Emken EA, Neff WE, Adlof RO. Lipids. 1996;31:919–935. doi: 10.1007/BF02522685. [DOI] [PubMed] [Google Scholar]
- 17.Neff WE, Byrdwell WC. Journal of Chromatography A. 1998;818:169–186. [Google Scholar]
- 18.Neff WE, List GR, Byrdwell WC. Journal of Liquid Chromatography & Related Technologies. 1999;22:1649–1662. [Google Scholar]
- 19.Byrdwell WC, Neff WE. Rapid Communications in Mass Spectrometry. 2002;16:300–319. doi: 10.1002/rcm.581. [DOI] [PubMed] [Google Scholar]
- 20.Laakso P, Kallio H. Lipids. 1996;31:33–42. doi: 10.1007/BF02522407. [DOI] [PubMed] [Google Scholar]
- 21.Stroobant V, Rozenberg R, Bouabsa EM, Deffense E, Dehoffmann E. Journal of the American Society for Mass Spectrometry. 1995;6:498–506. doi: 10.1016/1044-0305(95)00200-W. [DOI] [PubMed] [Google Scholar]
- 22.Anderson MA, Collier L, Dilliplane R, Ayorinde FO. Journal of the American Oil Chemists Society. 1993;70:905–908. [Google Scholar]
- 23.Lehmann WD, Kessler M. Biomedical Mass Spectrometry. 1983;10:220–226. doi: 10.1002/bms.1200100320. [DOI] [PubMed] [Google Scholar]
- 24.Evans N, Games DE, Harwood JL, Jackson AH. Biochemical Society Transactions. 1974;2:1091–1093. [Google Scholar]
- 25.Sundin P, Larsson P, Wesen C, Odham G. Biological Mass Spectrometry. 1992;21:633–641. [Google Scholar]
- 26.Kim HY, Salem N. Analytical Chemistry. 1987;59:722–726. doi: 10.1021/ac00132a009. [DOI] [PubMed] [Google Scholar]
- 27.Lamberto M, Saitta M. Journal of the American Oil Chemists Society. 1995;72:867–871. [Google Scholar]
- 28.Hori M, Sahashi Y, Koike S, Yamaoka R, Sato M. Analytical Sciences. 1994;10:719–724. [Google Scholar]
- 29.Evans C, Traldi P, Bambagiottialberti M, Giannellini V, Coran SA, Vincieri FF. Biological Mass Spectrometry. 1991;20:351–356. [Google Scholar]
- 30.Duffin KL, Henion JD, Shieh JJ. Analytical Chemistry. 1991;63:1781–1788. doi: 10.1021/ac00017a023. [DOI] [PubMed] [Google Scholar]
- 31.Cheng CF, Gross ML. Analytical Chemistry. 1998;70:4417–4426. doi: 10.1021/ac9805192. [DOI] [PubMed] [Google Scholar]
- 32.Hsu FF, Turk J. Journal of the American Society for Mass Spectrometry. 1999;10:587–599. doi: 10.1016/S1044-0305(99)00035-5. [DOI] [PubMed] [Google Scholar]
- 33.Hvattum E. Rapid Communications in Mass Spectrometry. 2001;15:187–190. doi: 10.1002/1097-0231(20010215)15:3<187::AID-RCM211>3.0.CO;2-T. [DOI] [PubMed] [Google Scholar]
- 34.Fard AM, Turner AG, Willett GD. Australian Journal of Chemistry. 2003;56:499–508. [Google Scholar]
- 35.Segall SD, Artz WE, Raslan DS, Ferraz VP, Takahashi JA. Food Research International. 2005;38:167–174. [Google Scholar]
- 36.Asbury GR, Al-Saad K, Siems WF, Hannan RM, Hill HH. Journal of the American Society for Mass Spectrometry. 1999;10:983–991. doi: 10.1016/S1044-0305(99)00113-0. [DOI] [PubMed] [Google Scholar]
- 37.Robins C, Limbach PA. Rapid Communications in Mass Spectrometry. 2003;17:2839–2845. doi: 10.1002/rcm.1275. [DOI] [PubMed] [Google Scholar]
- 38.Calvano CD, Palmisano F, Zambonin CG. Rapid Communications in Mass Spectrometry. 2005;19:1315–1320. doi: 10.1002/rcm.1933. [DOI] [PubMed] [Google Scholar]
- 39.Michaud AL, Diau GY, Abril R, Brenna JT. Analytical Biochemistry. 2002;307:348–360. doi: 10.1016/s0003-2697(02)00037-4. [DOI] [PubMed] [Google Scholar]
- 40.Van Pelt CK, Brenna JT. Analytical Chemistry. 1999;71:1981–1989. doi: 10.1021/ac981387f. [DOI] [PubMed] [Google Scholar]
- 41.Van Pelt CK, Carpenter BK, Brenna JT. Journal of the American Society for Mass Spectrometry. 1999;10:1253–1262. doi: 10.1016/S1044-0305(99)00109-9. [DOI] [PubMed] [Google Scholar]
- 42.Michaud AL, Yurawecz MP, Delmonte P, Corl BA, Bauman DE, Brenna JT. Analytical Chemistry. 2003;75:4925–4930. doi: 10.1021/ac034221+. [DOI] [PubMed] [Google Scholar]
- 43.Lawrence P, Brenna JT. Analytical Chemistry. 2006;78:1312–1317. doi: 10.1021/ac0516584. [DOI] [PubMed] [Google Scholar]
- 44.Moneti G, Pieraccini G, Dani FR, Catinella S, Traldi P. Rapid Commun Mass Spectrom. 1996;10:167–170. [Google Scholar]
- 45.Moneti G, Pieraccini G, Favretto D, Traldi P. J Mass Spectrom. 1998;33:1148–1149. doi: 10.1002/(SICI)1096-9888(199912)34:12<1354::AID-JMS894>3.0.CO;2-1. [DOI] [PubMed] [Google Scholar]
- 46.Oldham NJ. Rapid Commun Mass Spectrom. 1999;13:1694–1698. doi: 10.1002/(SICI)1097-0231(19990830)13:16<1694::AID-RCM702>3.0.CO;2-1. [DOI] [PubMed] [Google Scholar]
- 47.Moneti G, Pieraccini G, Dani FR, Turillazzi S, Favretto D, Traldi P. J Mass Spectrom. 1997;32:1371–1373. [Google Scholar]
- 48.Moneti G, Pieraccini G, Favretto D, Traldi P. J Mass Spectrom. 1999;34:1354–1360. doi: 10.1002/(SICI)1096-9888(199912)34:12<1354::AID-JMS894>3.0.CO;2-1. [DOI] [PubMed] [Google Scholar]
- 49.Oldham NJSA. Rapid Communications in Mass Spectrometry. 1999;13:331–336. doi: 10.1002/(SICI)1097-0231(19990830)13:16<1694::AID-RCM702>3.0.CO;2-1. [DOI] [PubMed] [Google Scholar]
- 50.Jie M, Lam CC, Yan BFY. Journal of Chemical Research-S. 1993:141–141. [Google Scholar]


