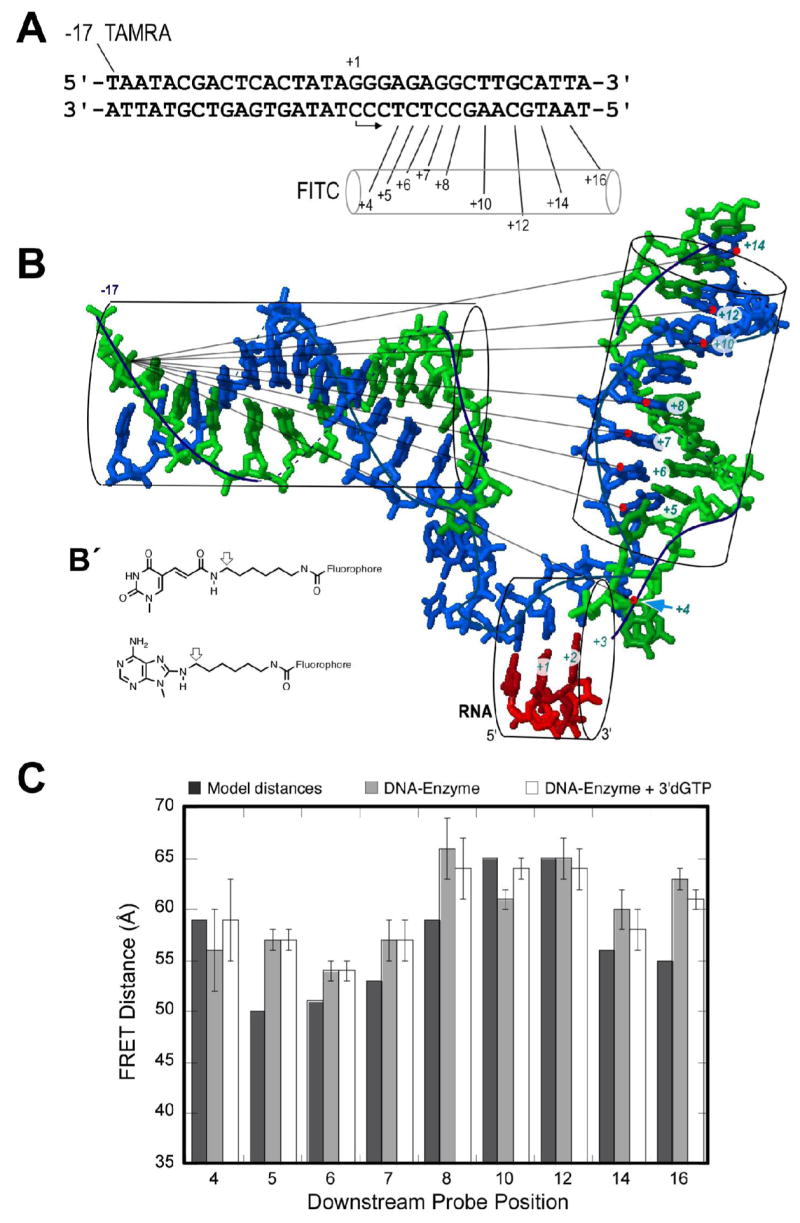
Figure 2. FRET measurements test the model.

A) The sequence of the DNA constructs. B) Modeled structure (protein omitted) showing expected distances. The FITC probe is conjugated to bases in the downstream template strand (positions +4, +5, +6, +7, +8, +10, +12, +14 and +16). TAMRA is coupled to the thymidine base at position -17 of the upstream nontemplate strand. Although the model shows DNA only to position +14, the constructs used were fully duplex to position +17. B′) Fluorophore coupling to A, C, or T is as shown. Modeled distances are approximated from the positions of the arrows, assuming base geometries from the model in (B). C) FRET distance data for each labeled DNA construct were obtained from an average of 4 measurements with standard deviations shown as error bars. From left to right within a set are: 1) model distances; 2) FRET distance on addition of enzyme at 4:1 ratio over DNA; and 3) FRET distances after addition of 100 μM 3′dGTP to (2).
