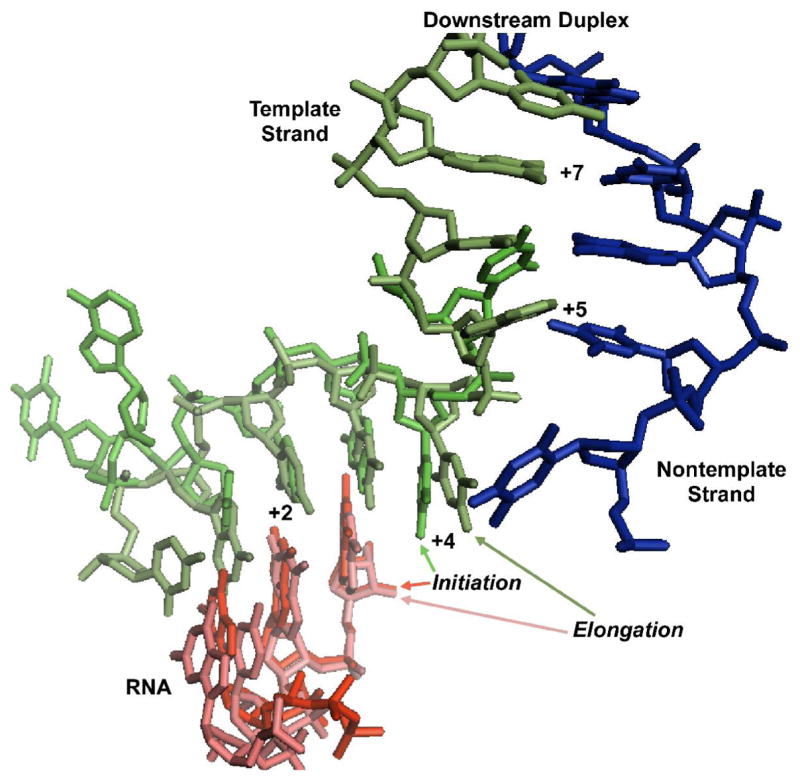
Figure 4. Modeling the downstream edge of the initiation bubble.

Alignment of the C-terminal domains of the initiating complex stalled at position +3 (1QLN) and the elongation complex clear of the promoter (1MSW) yields excellent alignment of the DNA template strand backbones (the source of the coordinates is indicated above: Initiation/Elongation). The model predicts a return to base pairing at position +5, as observed in the current fluorescence study. The coincidence of the template strand backbones also suggests that the downstream duplex in the initiation complex will take the same overall path as seen in the elongation complex, a result confirmed by the observed FRET distance phasing.
