

Abstract
Background
Physician income varies threefold among specialties. Lower incomes have produced shortages in primary care fields.
Objective
To investigate the impact of government policy on generating income differentials among specialties.
Design and Participants
Cross-sectional analysis of the 2004 MEPS.
Measurements
For outpatient care, total payments made to 27 different types of specialists from five types of payers: Medicare, Medicaid, other government (the Veterans Administration and other state and local programs), private insurance, and out-of-pocket payments. For inpatient care, aggregate (i.e., all-specialty) inpatient physician reimbursement from the five payers.
Results
In 2004, physicians derived 78.6% of their practice income ($149,684 million, 95% CI, $140,784 million—$158,584 million) from outpatient sources and 21.4% of their income ($40,782 million, 95% CI, $36,839 million—$44,724 million) from inpatient sources. Government payers accounted for 32.7% of total physician income. Four specialties derived > 50% of their outpatient income from public sources, including both the lowest and highest paid specialties (geriatrics and hematology/oncology, respectively).
Conclusions
Inter-specialty income differences result, in part, from government decisions.
Electronic supplementary material
The online version of this article (doi:10.1007/s11606-008-0660-7) contains supplementary material, which is available to authorized users.
Key words: physician income, contribution of government payments, specialist–generalist income gap
INTRODUCTION
Primary care reduces illness and death,1–6 promotes equity in health,7,8 and reduces cost.2,9–12 Greater reliance on primary care in Canada and the United Kingdom may explain part of those nations’ lower health care costs relative to the US.13 Yet too few US medical students and internal medicine trainees are entering primary care fields.14 Several states have recently reported a shortage of primary care doctors,15 and the American College of Physicians has described primary care as being “at grave risk of collapse.”16 Low remuneration for primary care relative to specialty practice is believed to underlie this problem.17,18
A recent study 19 analyzed Medicare RVU distribution among specialties but provided no information on physician payments by other government or private insurers. We are unaware of prior studies that have analyzed the overall effect of government payments on inter-specialty income differences.
We analyzed nationally representative population-based data on payment to the various medical specialties. We hypothesized that many specialties derive a sizeable proportion of their income from government sources. If so, changes in government reimbursement policy could narrow income differentials and thus bolster primary care.
METHODS
Data Source
We analyzed data from the 2004 Medical Expenditure Panel Survey (MEPS),20 a nationally representative survey designed to provide estimates of expenditures and health services utilization for the US civilian non-institutionalized population. The MEPS is co-sponsored by the Agency for Health Care Research and Quality (AHRQ) and the National Center for Health Statistics (NCHS). AHRQ provides weights that adjust for the complex sample design and survey non-response, and allow extrapolation to the nation as a whole. We used data from two components of the MEPS: the household component and the medical provider component.
The MEPS’ household component collects detailed data for approximately 34,000 people on demographic characteristics, use of medical services, health insurance coverage, and medical payments. Respondents identify medical care events and the associated medical providers; surveyors then contact these medical providers and collect data from them on medical care reimbursement, including source of payment for each outpatient medical visit. The hospital inpatient stays file provides detailed information on hospital inpatient stays, including sources of payment for physician services. The MEPS identifies each physician’s specialty for outpatient medical visits but not for hospital inpatient visits.
Data Analyses
For outpatient care, we calculated the total payments made to 27 different types of specialists from five types of payers: Medicare, Medicaid, other government (the Veterans Administration and other state and local programs), private insurance, and out-of-pocket payments. We also calculated, for each of the 27 specialties, the payer-mix of patients seen.
MEPS does not record physician specialty for payments for inpatient care. However, we were able to look at aggregate (i.e., all-specialty) inpatient physician reimbursement and determine the share paid by each of the five payer types. Similarly, we analyzed aggregate physician reimbursement for all care; both inpatient and outpatient.
To place these payment data into context, we also report median physician income according to medical specialty in 2004.21 Because this study used publicly available anonymous data, the Institutional Review Board of Cambridge Health Alliance deemed it exempt from review.
Statistical Methods
We used SAS statistical software, version 9.1, for frequency analyses (SAS Institute Inc, Cary, NC). Confidence intervals are adjusted for stratification and clustering.
RESULTS
Sources of Physician Income
Figure 1 shows mean 2004 physician practice income by specialty type.21 For each specialty, Figure 2 shows the share of outpatient income derived from each payer according to the MEPS. A table listing confidence intervals around the share of outpatient income derived from each payer is available in an online e-Table. Thirty-one percent (95% CI, 29.1%-33.2%) of all outpatient physician income is derived from public sources; these include Medicaid (6.8%; 95% CI, 5.8%-7.8%), Medicare (21.1%; 95% CI, 19.2%-23.0%), and other government sources (3.2%; 95% CI, 2.6%-3.8%). Obstetrician-gynecologists, pediatricians, and psychiatrists derived more of their income from Medicaid than did other specialists, while cardiologists, geriatricians, hematologist-oncologists, nephrologists, rheumatologists and urologists each derived more than one-third of their income from Medicare alone. Four specialties-geriatrics, hematology-oncology, nephrology, and rheumatology-derived more than half of outpatient income from public sources, while net incomes among these publicly-supported specialties varied substantially, from $164,649 (geriatrics) to $504,307 (hematology-oncology).
Figure 1.
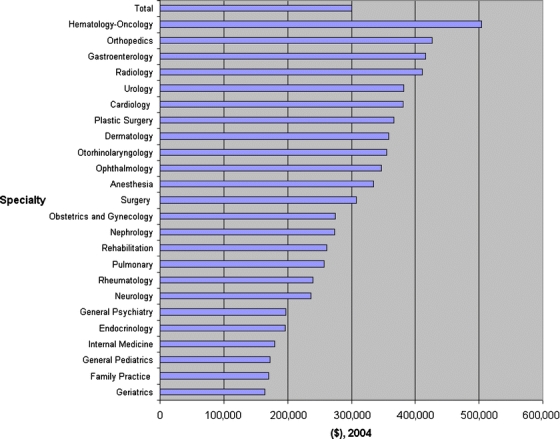
Mean 2004 physician net income, by specialty. Box identifyingthe line bars: Mean Physician Income from Inpatient and Outpatient Sources.
Figure 2.
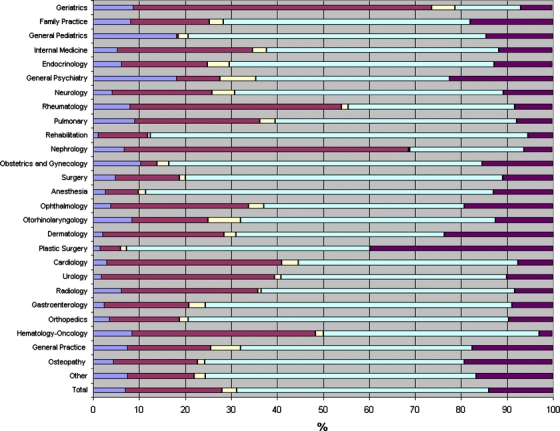
Share of physician’s outpatient revenues from various payers, by physician specialty, 2004. Box identifying the line bars: Medicaid, Medicare, Other Government, Private Insurance, Out-of-Pocket.
Outpatient Payer Mix
Figure 3 shows the number of outpatient visits according to specialty and insurance type. A table listing confidence intervals around the percentage of outpatient visits to specialists according to each insurance type is available in an online e-Table. Again, there was considerable variability in the proportion of visits to different specialists made by patients with differing types of health insurance. Patients with Medicaid accounted for 9.1% (95% CI 8.3%-10.0%) of all outpatient visits but only 6.8% (95% CI 5.8%-7.8%) of all outpatient income, while patients with Medicare, private insurance, or a combination thereof comprised 73.3% (95% CI 72.1%-74.5%) of all outpatient visits and generated 75.9% (95% CI 74.4%-77.4%) of all outpatient income. Some form of public insurance covered a sizeable proportion (41.9%; 95% CI, 40.4%-43.4%) of outpatient visits.
Figure 3.
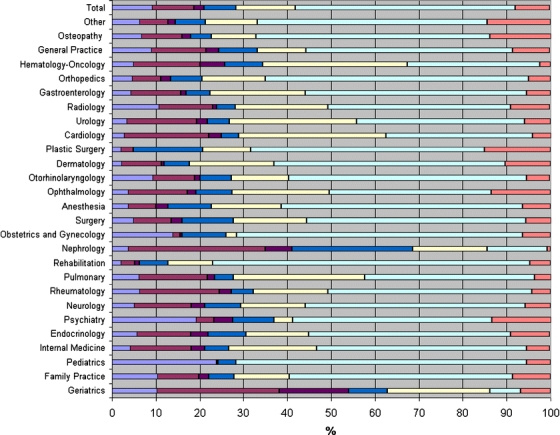
Outpatient visits to specialists according to insurance type. Box identifying the line bars: Medicaid only, Medicare only, Medicare + Medicaid, Other Government, Medicare + Private, Private only, Out-of-Pocket only.
In 2004, physicians derived 78.6% of their income ($149,684 million, 95% CI, $140,784 million-$158,584.0 million) from outpatient care and 21.4% of their income ($40,782 million, 95% CI, $36,839 million-$44,724 million) from inpatient care. The proportion of inpatient physician income from each payer type differed slightly from that for outpatient-based income. More of inpatient income was derived from Medicare (29.4% of inpatient income; 95% CI 25.5%-33.3% versus 21.1% of outpatient income; 95% CI 19.2%-23.0%) and less came from out-of-pocket payments (5.1% of inpatient income; 95% CI 4.0%-6.2% versus 14.0% of outpatient income; 95% CI 13.0%-15.1%). A similar proportion of physician inpatient and outpatient income came from Medicaid (7.4% of inpatient income; 95% CI 6.1%-8.8% versus 6.9% of outpatient income; 95% CI 6.0%-7.9%), other government (1.8% of inpatient income 95% CI.9%-2.7% versus 3.2% of outpatient income; 95%CI 2.6%-3.8%) and private insurance (56.2% of inpatient income 95% CI 52.5%-60.0% versus 54.8% of outpatient income; 95% CI 52.7%-56.9%). Among all U.S. physicians, we estimate that 22.9% of practice income comes from Medicare, 7.0% from Medicaid, and 2.9% from other government sources.
DISCUSSION
Physicians derive approximately one-third of their income from public payers. Among physician specialties deriving more than half of revenues from government sources, incomes vary more than threefold.
Some have argued that certain specialties should receive higher payments than others due to high malpractice insurance costs and the need to purchase expensive medical equipment. This assumption is built into the Medicare RVU payment formula. Yet the income differentials we present reflect net income, i.e., income after all practice expenses are paid. Moreover, the problem of practice expenses applies only to the approximately 60% of physicians who are self-employed; the remainder are employees. Shifting income from specialists to primary care providers might lengthen waits for some specialists’ services, waits which some might view as proof of a specialist shortage. However, regions of the U.S. with greater supply and use of specialist services may actually suffer worse outcomes,22 and no evidence suggests a widespread unmet need for specialist care. Other nations (e.g., Canada) have achieved superior health outcomes 23–24 with far fewer specialists (and more primary care physicians) than in the US.
Certainly longer work hours or additional years of training might justify a higher income. Yet, according to the most recent AMA physician socioeconomic statistics,25 hours in professional activities correlate poorly with income. For example, general internists spend a mean of 58 hours in professional activities per week, while otolaryngologists spend 57 hours and radiologists spend 60 hours. Similarly, while both dermatologists and geriatricians spend a minimum of 4 years in postgraduate training, geriatricians earn less than half of a dermatologist’s income.
Government’s role in creating inter-specialty income discrepancies may actually be larger than indicated by our payment analyses, since many private insurers base their fees on Medicare’s fee schedule.26 Political barriers to reducing income disparities include specialists’ greater resources for lobbying and disproportionate representation on the AMA’s Specialty Society Relative Value Scale Update Committee (RUC), which advises the Centers for Medicare and Medicaid Services (CMS). Government policy-makers may also perceive, incorrectly, that income inequality is generated by a free market beyond their control.
Even lower-paid US physicians earn far more than the average American, making it difficult to generate a groundswell of public sympathy for the financial plight of primary care doctors. Yet the income inequality between specialists and generalists unbalances the health care system and ultimately puts patients at risk. If fewer medical trainees are attracted to primary care, patients will be left without physicians to coordinate their care and to follow them longitudinally. Of particular concern is the national shortage of geriatricians, the lowest paid specialty. The American Geriatrics Society estimates there are 7,600 certified geriatricians in the U.S. despite a need for approximately 20,000 geriatricians.27 Ironically, Medicare’s priority population, the elderly, is vastly underserved, in part because of Medicare’s own payment policies.
Study Limitations
Our study has several limitations. Our estimates of inter-specialty differences in payer-specific income were based solely on outpatient income, as the MEPS does not include data on inpatient physician specialty. The MEPS surveys only non-institutionalized civilians, excluding physician care of nursing home patients (the majority of whom have Medicare and/or Medicaid), and two groups whose care is completely government paid (active duty military personnel and prisoners). Inclusion of these patient groups would have increased our estimate of the government’s share of total physician revenue.
Government could narrow inter-specialty income differentials by aligning billing codes and fee schedules with the amount of time physicians actually spend providing and coordinating care. Such a change might increase the supply of US primary care physicians.
Addressing income inequality within society may lead to better population health outcomes;28 the same may hold true for addressing income inequalities between physicians.
Electronic supplementary material
Below is the link to the electronic supplementary material.
(DOC 159 kb)
Acknowledgements
Maxim D. Shrayer Ph.D. provided constructive comments on earlier drafts of this paper; Melbeth G. Marlang, BA, assisted in manuscript preparation.
Conflict of Interest None disclosed.
Footnotes
Electronic supplementary material
The online version of this article (doi:10.1007/s11606-008-0660-7) contains supplementary material, which is available to authorized users.
References
- 1.Campbell RJ, Ramirez AM, Perez K, Roetzheim RG. Cervical cancer rates and the supply of primary care physicians in Florida. Fam Med. 2003;35(1):60–4. [PubMed]
- 2.Franks P, Fiscella K. Primary care physicians and specialists as personal physicians. Health care expenditures and mortality experience. J Fam Pract. 1998;47(2):105–9. [PubMed]
- 3.Gulliford MC. Availability of primary care doctors and population health in England: is there an association? J Public Health Med. 2002;24(4):252–4. [DOI] [PubMed]
- 4.Jarman B, Gault S, Alves B, et al. Explaining differences in English hospital death rates using routinely collected data. Br Med J (Clinical Research Ed.). 1999;318(7197):1515–20. [DOI] [PMC free article] [PubMed]
- 5.O’Malley AS, Forrest CB, Politzer RM, Wulu JT, Shi L. Health center trends, 1994–2001: what do they portend for the federal growth initiative? Health Aff (Millwood). 2005;24(2):465–72. [DOI] [PubMed]
- 6.Shi L, Starfield B, Kennedy B, Kawachi I. Income inequality, primary care, and health indicators. J Fam Pract. 1999;48(4):275–84. [PubMed]
- 7.Shi L, Macinko J, Starfield B, Politzer R, Wulu J, Xu J. Primary care, social inequalities, and all-cause, heart disease, and cancer mortality in US counties, 1990. Am J Public Health. 2005;95(4):674–80. [DOI] [PMC free article] [PubMed]
- 8.Shi L, Macinko J, Starfield B, Politzer R, Xu J. Primary care, race, and mortality in US states. Soc Sci Med. 2005;61(1):65–75. [DOI] [PubMed]
- 9.Baicker K, Chandra A. Medicare spending, the physician workforce, and beneficiaries’ quality of care. Health Affairs. 2004;Suppl Web Exclusives:W184–97. [DOI] [PubMed]
- 10.Mark DH, Gottlieb MS, Zellner BB, Chetty VK, Midtling JE. Medicare costs in urban areas and the supply of primary care physicians. J Fam Pract. 1996;43(1):33–9. [PubMed]
- 11.Starfield B, Shi L, Macinko J. Contribution of primary care to health systems and health. Milbank Mem Fund Q. 2005;83(3):457–502. [DOI] [PMC free article] [PubMed]
- 12.Welch WP, Miller ME, Welch HG, Fisher ES, Wennberg JE. Geographic variation in expenditures for physicians' services in the United States. N Engl J Med. 1993;328(9):621–7. [DOI] [PubMed]
- 13.Starfield B, Shi L. Policy relevant determinants of health: an international perspective. Health Policy. 2002;60(3):201–18. [DOI] [PubMed]
- 14.Bodenheimer T. Primary care-will it survive? N Engl J Med. 2006;355(9):861–4. [DOI] [PubMed]
- 15.Berenson A. Sending back the doctor’s bill. The New York Times 2007 July 29;3.
- 16.American College of Physicians. The impending collapse of primary care medicine and its implications in the state of the nation’s health care. A public policy report of the American College of Physicians, Philadelphia: January 30, 2006. Available at http://www.acponline.org/advocacy/events/state_of_healthcare/statehc06_1.pdf Accessed March 31, 2008.
- 17.Bodenheimer T, Berenson RA, Rudolf P. The primary care-specialty income gap: why it matters. Ann Intern Med. 2007;146(4):301–6. [DOI] [PubMed]
- 18.Woo B. Primary care-the best job in medicine?. N Engl J Med. 2006;355(9):864–6. [DOI] [PubMed]
- 19.Maxwell S, Zuckerman S, Berenson RA. Use of physicians' services under Medicare's resource-based payments. N Engl J Med. 2007;356(18):1853–61. [DOI] [PubMed]
- 20.Cohen JW, Monheit AC, Beauregard KM, et al. The Medical Expenditure Panel Survey: a national health information resource. Inquiry. 1996;33(4):373–89. [PubMed]
- 21.Medical Group Management Association, Englewood, Colorado, December 2005.
- 22.Fisher ES, Wennberg DE, Stukel TA, et al. The implications of regional variations in Medicare spending. Part 1: the content, quality, and accessibility of care. Ann Intern Med. 2003;138(4):273–287. [DOI] [PubMed]
- 23.OECD Health Data 2004: A Comparative Analysis of 30 Countries. Paris: Organisation for Economic Cooperation and Development; 2004.
- 24.Guyatt G, Devereaux PJ, Lexchin J, et al.. A systematic review of studies comparing health outcomes in Canada and the United States. Open Medicine. 2007;1(1):27–36. [PMC free article] [PubMed]
- 25.Wassenaar JD, Thran SL, eds. Physician Socioeconomic Statistics. 2000–2002 ed. Chicago, Illinois: American Medical Association; 2001.
- 26.Ginsburg PB, Berenson RA. Revising Medicare's physician fee schedule-much activity, little change. N Engl J Med. 2007;356(12):1201–3. [DOI] [PubMed]
- 27.American Geriatrics Society and Association of Directors of Geriatric Academic Programs (ADGAP). Geriatric Medicine: A Clinical Imperative for an Aging Population. New York; 2007.
- 28. Social Epidemiology Oxford: Oxford University Press; 2000.
Associated Data
This section collects any data citations, data availability statements, or supplementary materials included in this article.
Supplementary Materials
Below is the link to the electronic supplementary material.
(DOC 159 kb)