

Abstract
Previous studies have investigated a potential method for targeted drug delivery in the central nervous system that uses focused ultrasound bursts combined with an ultrasound contrast agent to temporarily disrupt the blood-brain barrier (BBB). The purpose of this work was to investigate the integrity of the tight junctions (TJs) in rat brain microvessels after this BBB disruption. 1.5-MHz ultrasound bursts in combination with a gas contrast agent (Optison) was applied at two locations in the brain in 25 rats to induce BBB disruption. Using immunoelectron microscopy, the distributions of the TJ-specific transmembrane proteins occludin, claudin-1, claudin-5, and of submembranous ZO-1 were examined at 1, 2, 4, 6 and 24 h after sonication. A quantitative evaluation of the protein expression was made by counting the number of immunosignals per micrometer in the junctional clefts. BBB disruption at the sonicated locations was confirmed by the leakage of intravenously administered horseradish peroxidase (HRP, m.w. 40,000 Da) and lanthanum chloride (La3+, m.w. ~ 139 Da). Leakage of these agents was observed at 1 and 2 h and in a few vessels at 4 h after ultrasound application. These changes were paralleled by the apparent disintegration of the TJ complexes, as evidenced by the redistribution and loss of the immunosignals for occludin, claudin-5 and ZO-1. Claudin-1 seemed less involved. At 6 and 24 h after sonication, no HRP or lanthanum leakage was observed, and the barrier function of the TJs, as indicated by the localization and density of immunosignals, appeared to be completely restored. This study provides the first direct evidence that ultrasound bursts combined with a gas contrast agent cause disassembling of the TJ molecular structure, leading to loss of the junctional barrier functions in brain microvessels. The BBB disruption appears to last up to 4 h after sonication and permits the paracellular passage of agents with molecular weights up to at least 40 kDa. These promising features can be exploited in the future development of this method that could enable the delivery of drugs, antibodies or genes to targeted locations in the brain.
Keywords: blood-brain barrier, ultrasound, tight-junctions, immunoelectron microscopy
Introduction
The ability of the blood-brain barrier (BBB) to restrict the paracellular transport of substances to the brain is attributed to the tight junctions (TJs), well-differentiated zones that lie between adjacent endothelial cells (ECs) in the brain microvessels. They consist of integral (transmembrane) proteins that form belt-like strands between the EC membranes and are associated with submembranous cytoplasmic proteins and the ECs’ cytoskeleton. Occludin was the first transmembrane protein identified as a structural element of the TJs (Furuse et al. 1993; Hirase et al. 1997) and is considered to play a key regulatory role for their “tightness” (Balda et al. 2000; Huber et al. 2000). Claudins are other transmembrane TJ proteins (Furuse et al. 1998) that appear to determine directly the barrier and fence functionalities, which restrict passage and maintain cell polarity, respectively (Tsukita et Furuse 1999, 2000; Heiskala et al. 2001; Tsukita et al. 2001). While members of this large protein family are present in several different tissues, claudin-1 and claudin-5 are believed to be the principal elements in regards to the structure and function of the BBB (Liebner et al. 2000; Ohtsuki et al. 2006). Among the submembranous tight junction-associated proteins, the zonula occludens proteins (ZO-1, ZO-2 and ZO-3) participate in anchoring the transmembrane TJ proteins to the cytoskeleton and in signal transduction, thus providing important mechanisms for TJ regulation (Gonzales-Mariscal et al. 2000). Impairment of TJ proteins has been suggested as a reason for BBB dysfunction in different diseases and experimentally-evoked pathological processes (Plumb et al. 2002; Liebner et al. 2000;Wolburg et al. 2003). When the BBB is disrupted in such processes, the normal paracellular localization of the TJ proteins can also be altered (Willis et al. 2004).
In addition to restricting the passage of circulating molecules, the BBB also limits penetration of the large majority of therapeutic and imaging agents to the brain. During the last two decades, several strategies to modulate or bypass the BBB and allow drug transfer have been examined. In one method, intracarotid injection of an inert hypertonic solution is applied, which results in shrinkage of the ECs and dilatation of the interendothelial clefts (Rapoport 2000). Immunoelectron microscopic examination after this procedure has found changes in the distribution and expression of the TJ proteins in the osmotically-dilated clefts (Dobrogowska and Vorbrodt 2004). Although this method shows promise and has been applied to patients with brain tumors (Kroll and Neuwelt 1998), it has several disadvantages, including associated physiological stress, transient increase in intracranial pressure, and unwanted drug delivery to non-targeted regions of the brain.
Recently, it has been shown that focused ultrasound bursts, when applied in the presence of preformed gas bubbles, results in temporary localized BBB disruption (Hynynen et al. 2001; 2005; 2006; Choi et al. 2007; Yang et al. 2007). Since the ultrasound beam can be generated from an external source and applied at frequencies suitable for transcranial exposure (Hynynen 2005; 2006), this technique could provide a noninvasive means for targeted drug delivery to the brain. Passage of an intravenously injected tracer protein, horseradish peroxidase (HRP), and also of circulating antibodies (immunoglobulin G) through the endothelial lining has been demonstrated in examination of rat and rabbit brain microvessels (Sheikov et al. 2004; 2006). Other work has demonstrated the delivery of a dopamine D4 receptor antibody to its antigen in mice (Kinoshita et al. 2006), liposomal doxorubicin in rats (Treat et al. 2007), and the antibody-based anticancer drug Herceptin in mice (Kinoshita et al. 2006a).
There is currently no detailed information on how burst sonication combined with an ultrasound contrast agent affects the TJ proteins. Previous work with HRP (Hynynen et al. 2005) has found passage via the interendothelial clefts in addition to transcytoplasmic transport via caveolae, which suggests that the ultrasound interaction with the microbubbles in microvessels can affect the integrity of the tight junctional-complexes. Because paracellular passage does not require an energy supply or receptor-specific interactions as transcytoplasmic transfer does, transport through opened intercellular clefts could be particularly useful for delivery of pharmaceutical agents to brain tissue.
The purpose of this work was to study the response of the TJs in brain microvessels after BBB disruption resulting from burst ultrasound exposures combined with a gas contrast agent. Using immunoelectron microscopy, we examined the expression of TJ-related antigens occludin, claudin-1, claudin-5 and ZO-1 at different times after sonication in the presence of the ultrasound contrast agent Optison. We also examined the duration of the disruption, up to a full restoration of the BBB, using tracers visible in electron microscopy. This duration will indicate the possible “therapeutic window” for tight-junction-based drug delivery to the central nervous system.
Materials and methods
Experimental animals
Twenty five male Sprague-Dawley rats weighing 250–300 g were used, in accordance with guidelines of our Institutional Animal Committee. The animals were anesthetized with a mixture of 40 mg/kg ketamine (Aveco Co., Inc., Fort Dodge, IA, USA) and 10 mg/kg xylazine (Lloyd Laboratories, Shenandoah, IA, USA). Before the experiments, the tail vein was catheterized and the hair over the skull was removed with depilatory lotion.
Ultrasound equipment and sonications
An air-backed spherically curved transducer (frequency: 1.5 MHz; diameter/radius of curvature: 10/8 cm) generated the ultrasound beam. The transducer was driven by a function generator (Model 271, Wavetek, San Diego, CA, USA) and RF amplifier (model 240L, ENI Inc, Rochester, NY, USA), and the electrical power was measured with a power meter (model 438A, Hewlett Packard, Palo Alto, CA, USA) and dual directional coupler (model C173, Werlatone, Brewster, NY, USA). The electrical impedance of the transducer was matched to the output impedance of the amplifier by an external matching network.
The transducer was characterized as described elsewhere (Hynynen et al. 1997). The transducer’s efficiency was measured using a force balance (absorbing target attached to a digital scale (AE200, Mettler, Toledo, OH, USA)).The half intensity beam diameter and length of the focal spot was measured in a water tank with a needle hydrophone (spot diameter 0.2 mm, Precision Acoustics, Dorchester, UK) to be 1.0 and 4.8 mm, respectively. Pressure measurements were performed in degassed, deionized water with a calibrated membrane hydrophone (spot diameter 0.5 mm, GEC-Marconi Research Center, Chelmsford, England). The peak negative pressure amplitude in the brain was estimated to be 1.1 MPa after taking into account ultrasound attenuation through 5 mm of brain, using a mean attenuation coefficient of 5 Np/m/MHz at 1.5 MHz (Goss et al. 1978) and the insertion loss of the rat skull (Treat et al. 2007). The acoustic power during the burst was 0.6 W. Since the duty cycle was 1% (see parameters below), the time-averaged acoustic power during the entire sonication was 6 mW.
The sonications consisted of thirty 10 ms bursts at a repetition frequency of 1 Hz. An ultrasound contrast agent (Optison, GE Healthcare, Milwaukee, WI, USA) was injected intravenously through the tail vein at the start of the sonications at a dosage of 0.05–0.07 ml per kg of body weight, which was in the range (0.5–5.0 ml; i.e, 0.0071–.071 ml/kg for a 70 kg adult) recommended by the manufacturer for human use during ultrasound imaging. A delay between sonications of at least two min allowed the bubbles to mostly clear from the circulation. The sonication parameters were based on previous work at this frequency in rats (Treat et al. 2007). We assumed that sonications without the contrast agent would not produce effects to the BBB or the tight junctions, so sonications without Optison were not tested. This assumption was based on previous work that tested continuous wave sonication at 1.5 MHz in rabbit brain over a range of exposure levels (Hynynen et al. 1997, Vykhodtseva et al. 2000). In those studies, the threshold for damage detected in MRI and light microscopy was at peak acoustic intensities approximately 6–12 times higher than the exposure levels used here. Also, no BBB disruption was observed in contrast MRI for sonications below those damage thresholds (Hynynen et al. 1997, Vykhodtseva et al. 2000). More relevantly burst sonications without microbubbles did produce only a slight increase in the contrast enhancement (3%) in another study at much higher pressure amplitude level of 4.7 MPa and burst length of 100 ms (Hynynen et al., 2001).
The transducer was mounted in a three axis manual positioning system and submerged in a tank of degassed, deionized water. The animal lay supine on a tray that was placed above this tank. A thin plastic bag filled with degassed water provided acoustic coupling between the transducer and the skin on the head of the animal. A diagram of the experimental set up is shown in Fig. 1. In the first nine experiments, the sonication system was placed in a clinical 3T MRI scanner (GE Healthcare, Milwaukee, WI, USA). A transmit/receive MRI surface coil (6 cm diameter, constructed in-house) was placed below the head. The focal target in the MRI coordinate system was found before the sonication in a silicone phantom by visualizing changes in MR images induced by heating. In the MRI experiments, BBB disruption was confirmed immediately after sonication in axial contrast-enhanced T1-weighted fast spin echo images (parameters: TR/TE: 500/15–23 ms; echo train length: 4; bandwidth: 16 kHz; matrix size: 256×256; NEX: 4; FOV: 8 cm; slice thickness: 1.5 mm). The MRI contrast agent used was gadopentetate dimeglumine (Magnevist®, Berlex Laboratories, Inc., Wayne, NJ, USA) given as an i.v. bolus at a dose of 0.03 mmol per kg of body weight. An example of this imaging is shown in Fig. 2. In the remaining animals, the sonications were performed without MRI-guidance using anatomical landmarks for targeting.
Fig. 1.
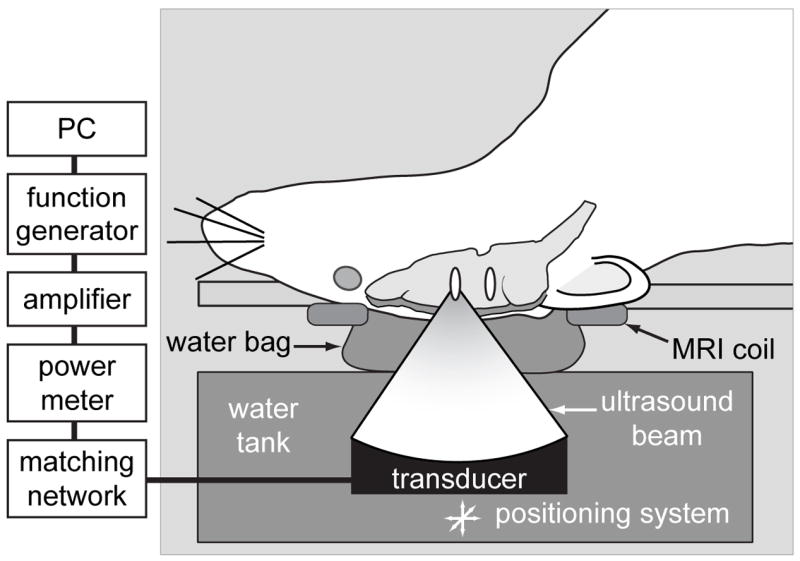
Experimental set-up.
Fig. 2.
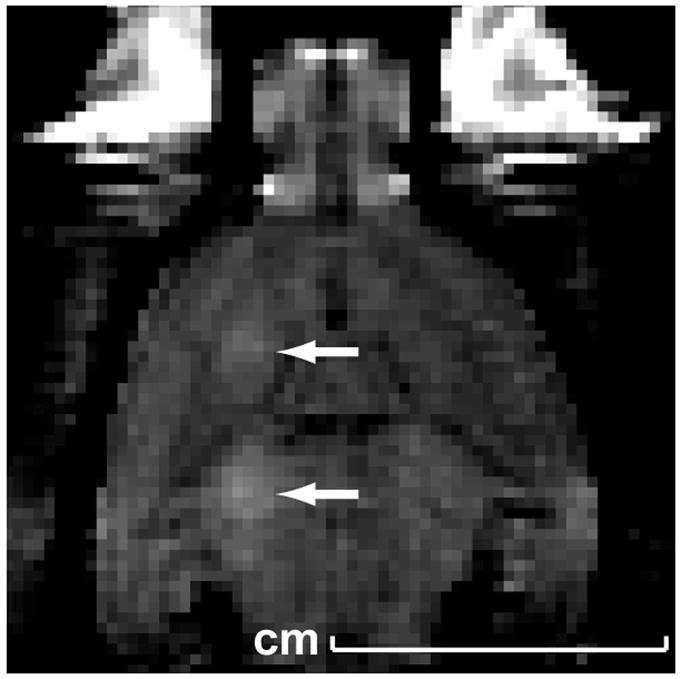
Magnetic resonance image showing contrast enhancement at two targets in the brain (arrows) resulting from BBB disruption at the focal spot.
In each animal, two targets in the left hemisphere approximately 5 mm deep and 2 mm apart were sonicated. Corresponding areas in the non-sonicated hemisphere served as controls. Immediately after the second sonication, an i.v injection of 0.6 ml solution of 4% Trypan blue dissolved in saline was administered. Passage of this agent through the BBB disruption permitted macroscopic visualization of sonicated locations on brain slices (Figure 3).
Fig. 3.
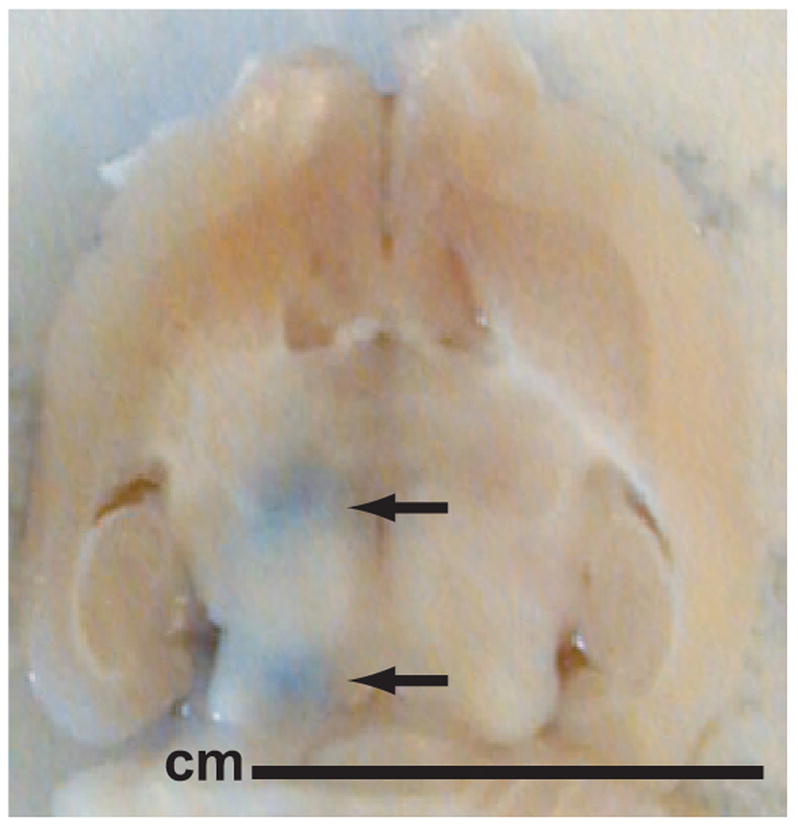
Macroscopic view of a brain section. The blue spots show trypan blue leakage at the sites of the BBB disruption.
Perfusion and tissue preparation
At 1, 2, 4, 6 and 24 hours after the sonications the animals were re-anesthetized and transcardially perfused with 4% paraformaldehyde and 0.1% glutaraldehyde in 0.1 M phosphate buffer (pH=7.4) and the brains removed. Three animals at each of these time-intervals were used for immunoelectron microscopic examination of the TJ proteins and for a tracer study with horseradish peroxidase (HRP). Eight additional animals were used for a tracer study using lanthanum chloride. These animals were sacrificed at 1, 4, 6 and 24 hours after the sonications, and two animals were used for each time-interval. Two intact animals were used as pure controls. A total of 50 locations were examined.
After the brain was removed, a rat brain matrix (ASI instruments, Warren, MI, USA) was used to bisect the brain at 5 mm from the brain surface to expose the blue spots at the targeted locations (Figure 3). Two to four tissue blocks of approximately 1 mm³ from each blue spot and from corresponding areas in the nonsonicated hemisphere were sampled and then fixed by immersion in the same fixative for 2 h. Half of the blocks were frozen and proceeded for immunoelectron microscopic examination of the TJ proteins (see below). The remaining blocks were incubated for HRP visualization in diaminobenzidine (DAB-reaction, see below). The brains used in the lanthanum study were immersed in the fixative overnight and then cut to obtain tissue blocks for transmission electron microscopy. The tissue blocks for the HRP and lanthanum studies were washed in PBS, postfixed in 2% osmium tetraoxide for 2 h, dehydrated in alcohol, passed through propylene oxide and embedded in Epon-Araldite. Ultrathin sections were obtained with Reichert Ultracut-Smicrotom and stained with uranyl acetate and lead citrate. All sections, including the TJ-protein immunogold-treated frozen sections, were examined with a JEOL 1200EX electron microscope at an accelerating voltage of 80 kV.
Tracer application and assessment of BBB permeability
A. Horseradish peroxidase application
The tracer HRP (m.w. 40,000 Da, effective hydrate radius 29.8 Å) was used to assess whether BBB disruption allowed passage of large molecules. Twenty minutes prior to perfusion, HRP (“Type VI”, Sigma-Aldrich Chemical Co., St. Louis, MO, USA) in saline was injected i.v at a dose of 300 mg/kg. After the tissue blocks were removed, they were washed in TRIS-HCl buffer (pH = 7.4) and incubated in 3,3′-diaminobenzidine tetrahydrochloride (Electron Microscopy Sciences, Hatfield, PA, USA) for 45 min at room temperature in a 0.05 M TRIS-HCl buffer containing 1% H2O2. After washing in PBS, the blocks were embedded in Epon-Araldite by the standard procedure described above.
B. Lanthanum chloride application
This relatively low molecular weight marker (lanthanum ions ~ 139 Da, effective hydrated radius 3.1 Å) which normally does not penetrate the BBB was used to assess the restoration of the barrier function. The rats were perfused first with a 10 mM solution of lanthanum chloride (Sigma-Aldrich Chemical Co., St. Louis, MO, USA) in saline for 10 min, followed by perfusion with fixative described above along with 2% lanthanum chloride and then removal of the brains and the tissue blocks.
Immunoelectron microscopy
After the perfusion fixation, the tissue blocks for study in immunoelectron microscopy were washed in 0.12% glycine in phosphate-buffered saline (PBS) for 15 min to quench free aldehyde groups, infiltrated with 2.3 M sucrose in PBS for 15 min, frozen in liquid nitrogen and then sectioned at −120°C. The sections were collected on formwar/carbon-coated cooper grids and treated for 10 min with 1% bovine serum albumin (BSA) to block unspecific labeling. The grids were further incubated overnight at 4°C with the primary antibodies and then washed in PBS and incubated for 1 h at room temperature with the secondary antibody. The following primary antibodies were used: rabbit polyclonal anti-occludin antibody, rabbit polyclonal anti-claudin-1 antibody, rabbit polyclonal anti-ZO-1antibody (all from Tight Junction Antibody Sampler Pack, Zymed Laboratories Inc. CA, USA), and mouse anti-claudin-5 monoclonal antibody (Zymed Laboratories Inc., CA, USA). The secondary antibody was goat antirabbit immunoglobulin G conjugated to 10 nm colloidal gold particles (Sigma-Aldrich Chemical Co., St. Louis, MO, USA) that were diluted 1:10 in 1% BSA in PBS. After incubation, the grids were washed in PBS and double distilled water and treated with 0.3% uranyl acetate in 2% methyl cellulose for 10 min. on ice. Controls for the specificity of the immunostaining consisted of sections that were pre-incubated overnight at 4°C with goat antirabbit antiserum (non-conjugated with gold) that was diluted 1:5 in 1% BSA in PBS.
Morphometry and statistical analysis
The density of the TJ protein labeling was measured on scanned photomicrographs of the immunoelectron microscopy using ImageJ (Abramoff et al. 2004). The number of gold particles per micrometer of TJ length was counted in ten TJs for each location and each time-interval after sonication. This analysis was performed blindly by two people. The results were expressed as a mean ± standard deviation (SD). The effect of the BBB disruption on the TJs protein labeling was compared by using one-way analysis of variance (ANOVA) followed by the Bonferroni test.
Results
Expression of junctional antigens
A). Occludin
In non-sonicated locations, most of the interendothelial clefts were abundant with occludin-labeled gold particles. The immunosignals were localized inside the clefts, between or over the cell membranes, or in close proximity to the cell membrane (Fig. 4A). At 1 h and 2 h after sonication, the number of immunosignals was reduced. In some clefts, only one or a few colloidal gold particles were observed (Fig. 4B, C). The localization of the occludin immunosignals was also atypical, indicating a disassembling of the junctional complexes. They appeared at a distance from the junctional cleft in the perijunctional cytoplasm (Fig. 4B, C). At 4 and 6 h after sonication, the density of the immunosignals was higher, and most of the particles were again located inside the clefts (Fig. 4D, E). At 24 h, the expression and localization appeared normal (Fig. 4F).
Fig. 4.

Photomicrographs of immunogold expression of occludin. A. A section from control (non-sonicated) tissue sample. The interendothelial cleft is labeled with numerous immunosignals represented by the grains of colloidal gold. The signals (arrows) are located inside the cleft, over the cell membranes or very close to the membranes. B. One hour after sonication. A few signals are present in this cleft, three of which are located more distant from the cell membrane (arrows). A detachment of the membranes forming a large dilatation of the first third of the cleft is indicated by an asterisk. C. Two hours after sonication. Reduction of the immune expression of occludin is evident: only three signals are present in this long junctional cleft. Two of the signals are atypically located at a distance from the cleft (arrow). D. Four hours, and E. six hours after sonication. The immunosignals in both micrographs are more numerous, compared with those in B and C, and they are typically located between or over the cell membranes of the cleft. F. 24 hours after sonication. The immunosignals (arrows) are seen along the cleft, showing a normal density and localization.
Symbols: L=lumen; B=basement membrane. Curved arrows show the luminal entrance of the interendothelial cleft. Scale bars: A, B, D, E = 100 nm; C, F = 200 nm
B). Claudin-1 and claudin-5
The localization of the immunosignals for claudin-1 and claudin-5 were similar in the non-sonicated areas to those of occludin, but they were less numerous (Fig. 5A, Fig. 6A). Their localization was atypical and their numbers reduced at 1 and 2 h after sonication (Fig. 5 B, C and Fig. 6B, C). These changes were more pronounced for claudin-5. At 4 and 6 h after sonication, the density of the immunosignals increased, with most showing typical localization between or very close to the cell membranes (Fig. 5 D, E and 6D, E). At 24 h after sonication, the number and the localization were both comparable with of the non-sonicated controls (Fig. 5F and Fig. 6F).
Fig. 5.

Photomicrographs showing immunogold expression of claudin-1. A. Section from control (nonsonicated) brain tissue. The distribution of the immunosignals resembles that of occludin: golden grains are localized along the cleft and are between, over, or in close proximity to the cell membranes (arrows). B, C – sections from vessels, obtained 1 and 2 h after sonication, respectively. The density of signals is reduced and some of their locations were atypical, more distant from the cleft (arrows). D. Four hours after sonication. Most of the gold particles appear inside the cleft. Two are still expressed atypically in perijunctional cell cytoplasm (arrow). E. Six hours and F. 24 h after sonication. The density and localization of the gold particles are similar to these shown in controls (A).
Symbols: L=lumen; B=basement membrane. Curved arrows show the luminal entrance of the cleft. Scale bars: A, B, C= 100 nm; D, E, F=200 nm.
Fig. 6.

Immunogold expression of claudin-5. A. A nonsonicated microvessel. The signals are localized inside the cleft or are attached or are very close to the cell membrane. B. One hour, and C. two hours after sonication. Only a few signals are present in the junctional clefts, demonstrating a considerable reduction of the claudin-5 expression. D. Four hours after sonication. Some grains are still located in the cytoplasm and are more distant from the cell membrane (arrows). E. Six hours after sonication. An enhanced number of immunosignals are seen in this cleft compared to those in B and C. Most of the gold particles are typically localized inside the cleft or are attached to the cell membranes. F. 24 h after sonication. The location and the density of the immunosignals are normal.
Symbols: L=lumen; B=basement membrane. Curved arrows show the luminal entrance of the cleft. Scale bars: A, E = 200 nm; B, C, D, F=100 nm.
C). ZO-1 molecules
After ZO-1 immunolabeling, the non-sonicated microvessels appeared with numerous signals localized at the TJ level along the cell membrane at the cytoplasmic surface (Fig. 7A). This labeling often occurred inside the cells near the membrane at opposite sides of the cleft. The ZO-1 immunoreactivity was substantially reduced at 1 and at 2 h after sonication (Fig. 7B, C). The distribution of the ZO-1 immunosignals was also abnormal in some vascular profiles at these times, with the gold grains often being located farther from the TJs than in the vessels that were not sonicated. At 4 and 6 h, an increased density and a more typical localization of the immunosignals was observed (Fig. 7D, E). At 24 h, the expression of ZO-1 appeared to be restored (Fig. 7F).
Fig. 7.

Immunogold localization of ZO-1. A. Expression of ZO-1 in a nonsonicated capillary. Numerous immunosignals are seen along the interendothelial cleft. Most of the signals are located at the cytoplasmic side of the junctional space (arrows). B. One hour after sonication. Only few signals present along the cleft. C. Two hours after sonication. The number of the signals is reduced along the initial part of the cleft. A group of several gold particles are seen at both sides of the abluminal end of the cleft. D, E. Four and six hours after sonication, respectively. Most of the immunosignals are again typically located in the submembranous cytoplasm or are attached to the cytoplasmic side of the cell membrane. F. 24 h after sonication. An augmentation of the expression of ZO-1 is evident. The number and localization of the gold particles are comparable with those in the control (A.).
Symbols: L=lumen; B=basement membrane. Curved arrows point the luminal entrance of the cleft. Scale bars: 100 nm.
The mean density of all of the immunosignals at different times after sonication is summarized in Fig. 8. As can be seen, a significant decrease (indicated by asterisks) of the immunogold labeling density occurred 1 and 2 h after sonication for occludin, claudin-5 and ZO-1, but not for claudin-1. At 4 and 6 h after sonication, the density of immunosignals of the sonicated locations was not significantly different than that in the controls.
Fig. 8.

Immunoelectron microscopic expression of the tight junction proteins at different time-intervals after sonication. The histograms show the mean number of the colloidal-gold particles count per micrometer of interendothelial cleft. Ten clefts for each value were examined, and the mean densities from each time-interval after sonication were compared with the controls. Statistically significant differences are marked with asterisks (*P<0.05; **P<0.01).
Blood-brain barrier permeability
A). Horseradish peroxidase passage
A functioning BBB in the non-sonicated microvessels prevented circulating HRP from passing into the subendothelial structures, with only a few endosomes and caveolae containing HRP found in the cytoplasm in some of the ECs. The ECs and basement membranes were free of HRP, as well as the surrounding pericytes, arteriole smooth muscle cells, and perivascular neuropil (Fig. 9A). In contrast, the tracer was clearly seen in these places at 1 and 2 h after sonication. Both vesicular transendothelial transfer of HRP, demonstrated by an enhanced number of caveolae filled with HRP, and paracellular passage of the tracer through junctional clefts was seen (Fig. 9B, C). At 4 h, the tracer was only occasionally present in the basement membrane in a few vessels. At 6 and 24 h after sonication, no HRP passage beyond the endothelial lining was seen. At these later time-intervals, HRP was also not present in paracellular space, apparently being stopped at the luminal estuary of the junctional cleft from evidently re-functioning TJ complexes (Fig. 9D).
Fig. 9.

BBB permeability for HRP. A. Photomicrograph showing part of a cross-sectioned microvessel and the surrounding nerve tissue from a nonsonicated area. No HRP passage to the basement membrane (arrowheads) or the neuropil (NP) can be seen. The lumen (L) appears empty because the tracer was washed out during perfusion fixation. B. A portion of a microvessel with adjacent nerve tissue from a sample obtained 1 h after sonication. Passage of HRP (black color) through several interendothelial clefts is indicated by arrowheads. The tracer has infiltrated the basement membrane (B) and the interstitial space (arrows) in the neuropil. C. A portion of longitudinally sectioned capillary in a sample obtained 2 h after sonication. The tracer is present in the junctional cleft (arrows), the basement membrane (B) and the interstitial spaces (asterisks) between myelinated axons (Ax). D. Full restoration of the tight-junctional barrier function 4 h after sonication. Immersion fixation (instead of perfusion fixation) was used in this brain and permits visualization of the tracer (black) filling the lumen (L) and being stopped at the first tight-junction (arrow). No penetration can be seen in the rest of the junctional cleft (arrowheads), nor in the basement membrane (B) or neuropil (NP). E-endothelial cell cytoplasm; RBC-red blood cell in the lumen.
Scale bars: 200 nm.
B). Lanthanum passage
In the non-sonicated vessels there was no passage of lanthanum beyond the endothelial lining, and the tracer was present in the lumen, covering the luminal surface of the ECs. Often the tracer penetrated in the initial part of the interendothelial clefts, but it was stopped at the first tight junction (Fig. 10A). No tracer transport occurred via pinocytosis. While a few caveolae containing lanthanum were rarely seen in the luminal part of EC cytoplasm, they did not reach the basement membrane, which was not infiltrated by the tracer. Lanthanum deposits were also not present in the neuropil. In contrast, at 1 h after sonication, the microvessels’ endothelium was clearly leaky. In these vessels, lanthanum passed through the paracellular clefts and spread into the basement membrane and the interstitium of the surrounding neuropil (Fig. 10B). At 4 h, such leaky microvessels were rarely seen. In some vessels at this time, the tracer passed several junctional complexes, filling the initial third or half of the cleft, before being stopped from reaching the basement membrane (Fig. 10C, D). At 6 and 24 h, lanthanum did not penetrate beyond the first tight junction (Fig. 10E). Occasionally in a few microvessels (two of ten at 4 h and one of ten at 24 h after sonication), single ECs or segments of ECs were observed with diffuse penetration of lanthanum into the cytoplasm. Small tracks of diffused tracer were also sometimes seen in the basement membrane at these times, but they did not pass beyond it into the neural parenchyma, suggesting that the barrier function of this membrane was intact (Fig. 10F).
Fig. 10.

Blood-brain barrier permeability for lanthanum. A. Photomicrograph of a microvessel from a nonsonicated area. The tracer has entered the interendothelial cleft, but is stopped at the first tight junction (arrow). The endothelium and subendothelial structures are free from lanthanum. Deposits of the tracer are seen only on the luminal surface of the endothelial cells (EC). B. One hour after sonication. Lanthanum has passed the entire length of the interendothelial cleft and has infiltrated both sheets of the basement membrane (B). Deposits of lanthanum are also seen beyond the basement membrane (arrowheads). C, D. Four hours after sonication. In C the tracer is stopped at the first tight junction and does not pass through (arrow). In D, a longer part of the cleft is labeled, but again the penetration was stopped (arrow). In both vessels the subendothelial structures appear free of lanthanum deposits. Note the diffusion of a small amount of lanthanum in endothelial cell cytoplasm in C (arrowheads). E. 24 h after sonication. No passage of the tracer beyond the first tight junction (arrow). Endothelium and all subendothelial structures appear free from lanthanum. F. 24 hours after sonication. Part of one of endothelial cell’s cytoplasm is diffusely stained by the tracer (large arrow). The interendothelial cleft (arrowheads) does not appear to be filled with lanthanum, and neither is the basement membrane (B) or the neuropil (NP).
Scale bars: 200 nm.
Discussion
From the viewpoint of drug delivery to brain, the tight junctions are attractive targets for temporary BBB disruption. Transjunctional (paracellular) drug transfer might be more advantageous than transcellular passage because it does not require specific transport mechanisms or the energy supplement needed for the process of transcytosis. Previously, we demonstrated that ultrasound bursts combined with circulating microbubbles results in both forms of passage. We showed that such sonication enhanced transcellular vesicular transport of blood-born macromolecules (immunoglobulin G) to the brain parenchyma and made the interendothelial clefts permeable for IgG and for HRP, thus providing clear evidence for an effect on the TJs (Sheikov et al. 2004; Hynynen et al. 2005).
In the present study we have examined, for the first time, some of the detailed changes which take place in the TJ complexes of the cerebral microvascular endothelium as a result of sonication combined with an ultrasound contrast agent. The results clearly indicate that: 1. The method causes a disintegration of the TJ molecular complexes, as demonstrated by the redistribution and loss of immunosignals for the junctional proteins; 2. It produces changes in immunoelectron microscopic expression for all four TJs antigens examined (occludin, claudin-1, claudin-5 and ZO-1); 3. It produces in parallel BBB breakdown and paracellular leakage of the tracers HRP and lanthanum into the brain parenchyma; 4. The changes appear to be reversible and last up to approximately four hours after ultrasound application.
It is known that many pathological conditions within central nervous system, such as ischemia, inflammation and tumor growth, are typically accompanied by BBB dysfunction. It has been shown that this dysfunction is often accompanied by loss of immunodetectable tight junction molecules. For example, the localization of claudin-3 was found to be selectively lost in BBB TJs during experimental autoimmune encephalomyelitis and glioblastoma multiforme (Wolburg H. et al. 2003). Others have shown abnormal localization of occludin, ZO-1 and claudin-5 that paralleled leakage of fibrinogen and dextran through astrocyte-lesioned brain microvessels (Willis et al. 2004). Here, we found pronounced abnormalities in immunolocalization of the proteins examined, maximally expressed at 1 and 2 h after sonication. Instead of the normal localization inside or close to the junctional clefts, gold particles were often found more distant from the clefts in the perijunctional cytoplasm. The morphometrical data showed up to a three times reduction in the density of immunosignals at these times after sonication compared to controls. Occludin seemed to be the most affected, with claudin-5 and ZO-1 also showing significant reduction. Claudin-1 showed similar, but less pronounced (statistically not significant) changes. These findings are in concordance with the data of Dobrogowska and Vorbrodt (2004), who showed both redistribution and loss of immunosignals for occludin, claudin-5 and ZO-1 after osmotic opening of the tight junctions. Those authors concluded that these proteins could be sensitive indicators of normal and impaired function of the BBB.
The mechanism by which the ultrasound wave interacts with the microbubbles and the microvessel walls to evoke impairment in the TJ proteins remains unknown. In general, a lack of immunosignals means that the antibody no longer recognizes its antigen. It could be that conformational changes in the protein molecules mask the epitopes of the antigens. The spatial organization of the junctional protein complexes may be changed, reducing the barrier’s tightness. Based on a loss of BBB impermeability and a reduction in tight junctional particles in freeze-fracture electron microscopy of cultured brain endothelial cells (Wolburg et al. 1994), some have suggested that a spatial molecular shift could take place from protoplasmic (P-face) to ectoplasmic (E-face)-associated TJs, which are less tight (Wolburg et al. 1994; Engelhardt B. 2006). Phosphorylation, a key biochemical process of protein function regulation may also be a source of TJ protein modification. Phosphorylation of ZO-1 has been shown to accompany increased monolayer permeability in kidney and cerebral vascular endothelial cells (Staddon et al. 1996; Stevenson et al. 1989). In both cell cultures and diabetic rats, Harhaj and co-workers (2006) have found that vascular endothelial growth factor (VEGF) induces rapid phosphorylation of the TJ proteins occludin and ZO-1, resulting in blood-retinal barrier breakdown and enhanced vascular permeability. Phosphorylation-dependant redistribution and reduction in the total level of occludin, together with diminished barrier functions, has also been shown in brain endothelial cells exposed to glutamate (Andras et al. 2007).
There are several potential interactions between the microbubbles and the microvasculature that could potentially evoke such changes, including acoustic radiation force on the microbubbles, bubble oscillation, acoustic streaming or inertial cavitation. Stress inflicted on cells as a result these interactions could evoke the release of pro-inflammatory agents like bradykinine, histamine or other bioactive substances such as metalloproteinases from the endothelium or perivascular astroglia, which also could mediate TJ protein degradation and BBB dysfunction (Gurney et al. 2006). Both the ultrasound interaction with microbubbles in the microvasculature and its relation to biology of the BBB are complex processes. Future work will be necessary to work out exactly what mechanism or mechanisms are in play.
Transvascular leakage of the tracers HRP and lanthanum followed the dynamics of the TJ protein changes. Their passage through the interendothelial clefts and infiltration of the basement membrane and interstitium of the neuropil occurred at 1 and 2 h after sonication, the same time as the greatest inhibition of occludin, claudin-5 and ZO-1 expression. Only a few vessels had clefts with passage of tracers at 4 h, and no passage occurred at 6 or 24 h. This result correlates with time where the immunosignals’ location and density were re-normalized and supports the conclusion that increased BBB permeability is associated with disruption of TJs in our experiments.
The behavior of lanthanum, especially its diffusion into the ECs’ cytoplasm, requires further discussion. The lanthanum ion - the smallest possible opaque marker in electron microscopy - is commonly considered an extracellular tracer that does not normally penetrate the BBB or cross the intact endothelium (Bouldin and Krigman, 1975; Brightman and Reese 1969; Hirano et al. 1994). However, there have been descriptions of diffuse deposits of lanthanum in ECs, and there is some disagreement in the literature regarding the interpretation of such cytoplasmic accumulation. After a long perfusion duration (12–45 min), Nag et al. (1982) found a time-dependent, diffuse passage of the tracer through the endothelium and the clefts in normal rat cerebral arterioles, but not in the capillaries and venules. They concluded that the ECs and TJs in the arterioles differ from those of the other brain microvessels. Others have posited that such lanthanum deposits are artifacts (Brightman et al. 1970) or a result of cell membrane damage (Sanovich et al. 1995; Hoffstein et al. 1975). We suspect that the lanthanum passage in our experiments was the result of local damage or changes in the EC membranes induced by the sonications. Recent high-speed imaging studies have shown that microbubbles oscillating in an ultrasound field can deform cell membranes and enhance permeability (van Wamel et al. 2006). Others have associated this permeability with local hydrogen peroxide formation (Juffermans et al. 2006). It is possible that the sonications in our experiments produced such membrane permeabilization at the luminal surface of selected ECs, leaving the neighboring cells intact. Why such selective events occurred is not known, but it could reflect a sparse population of microbubbles having a direct effect on individual ECs. We should note that when the diffuse cytoplasmic deposits of lanthanum were observed in individual ECs, passage of the agent through the intercellular clefts was not observed.
The restoration of the tight-junctional integrity, evident at a relatively short period of about 4 h after sonication, raises another group of interesting questions. Mechanisms by which BBB restores its functional potency are far from being understood. However, recent studies have shown that some biochemical substances released by endothelial and glial cells after BBB breakdown may act as protective agents and counterbalance BBB-disrupting pro-inflammatory factors like metalloproteinases. In an in vitro co-culture of human brain endothelial cells and astrocytes, Cucullo et al. (2003) reported that BBB damage induces a release of α2-macroglobulin, an inhibitor of matrix metalloproteinase. Serum samples taken from patients undergoing osmotic BBB disruption revealed small changes in α2-macroglobulin expression minutes after the procedure, and a significantly increased expression 4 hours after BBB disruption (Cucullo et al. 2003). Although the role of α2-macroglobulin as an endogenous counterbalancing agent against BBB failure or factor contributing for its repair remains still hypothetical, these data are consistent with our findings that BBB function was largely restored 4 h after sonication.
Conclusion
These results demonstrate that ultrasound bursts combined with an ultrasound contrast agent induced a disintegration of the TJ complexes in brain microvessels. This disintegration was manifested as a redistribution and loss of immunosignals for the transmembrane junctional proteins occludin and claudin-5, and a reduction in the expression of the submembranous junction-related proteins ZO-1 and, to a lesser extent, claudin-1. It was correlated with BBB disruption evidenced by paracellular leakage of the tracers HRP and lanthanum chloride from the vasculature into the brain parenchyma. This leakage lasted up to 4 h after sonication and permitted paracellular passage of molecules weights 139 and 40,000 Da, a promising range for the targeted delivery of drugs, antibodies or genes to brain.
Acknowledgments
The authors wish to thank Mrs. M. Eriksson, Mrs. E. Benecchi and Mrs. L. Trakimas for their valuable technical assistance. This study was supported by grants from the National Institutes of Health (R01EB003268, R33EB000705, U41RR019703) and the Brigham Radiology Research and Education Foundation.
Footnotes
Publisher's Disclaimer: This is a PDF file of an unedited manuscript that has been accepted for publication. As a service to our customers we are providing this early version of the manuscript. The manuscript will undergo copyediting, typesetting, and review of the resulting proof before it is published in its final citable form. Please note that during the production process errors may be discovered which could affect the content, and all legal disclaimers that apply to the journal pertain.
References
- Abramoff MD, Magelhaes PJ, Ram SJ. Image processing with ImageJ. Biophotonics Int. 2004;11:36–42. [Google Scholar]
- Andras IE, Deli MA, Veszelka S, Hayashi K, Henning B, Toborek M. The NMDA and AMPA/KA receptors are involved in glutamate-induced alterations of occludin expression and phosphorylation in brain endothelial cells. J Cereb Blood Flow Metab. 2007;24 doi: 10.1038/sj.jcbfm.9600445. Epub ahead of print. [DOI] [PubMed] [Google Scholar]
- Balda MS, Flores-Maldonado C, Cereijido M, Matter K. Multiple domains of occludin are involved in the regulation of paracellular permeability. J Cell Biochem. 2000;78:85–96. [PubMed] [Google Scholar]
- Bolton SJ, Anthony DC, Perry VH. Loss of tight junction protein occludin and zonula occludens-1 from cerebral vascular endothelium during neutrophil-induced blood-brain barrier breakdown in vivo. Neuroscience. 1998;86:1245–1257. doi: 10.1016/s0306-4522(98)00058-x. [DOI] [PubMed] [Google Scholar]
- Bouldin TW, Krigman MR. Differential permeability of cerebral capillary and choroid plexus to lanthanum ion. Brain Res. 1975;99:444–448. doi: 10.1016/0006-8993(75)90053-0. [DOI] [PubMed] [Google Scholar]
- Brightman MW, Reese TS. Junctions between intimately apposed cell membranes in the vertebrate brain. J Cell Biol. 1969;40:648–677. doi: 10.1083/jcb.40.3.648. [DOI] [PMC free article] [PubMed] [Google Scholar]
- Brightman MW, Klatzo I, Olsson Y, Reese TS. The blood-brain barrier to proteins under normal and pathological conditions. J Neurol Sci. 1970;10:215–239. doi: 10.1016/0022-510x(70)90151-6. [DOI] [PubMed] [Google Scholar]
- Choi JJ, Pernot M, Small SA, Konofagou EE. Noninvasive, transcranial and localized opening of the blood-brain barrier using focused ultrasound in mice. Ultrasound Med Biol. 2007;33:95–104. doi: 10.1016/j.ultrasmedbio.2006.07.018. [DOI] [PubMed] [Google Scholar]
- Cucullo L, Marchi N, Marroni M, Fazio V, Namura S, Janigro D. Blood-Brain Barrier Damage Indices Release of α2-Macroglobulin. Mol Cell Proteomics. 2003;2:234–241. doi: 10.1074/mcp.M200077-MCP200. [DOI] [PubMed] [Google Scholar]
- Dobrogowska DH, Vorbrodt AW. Immunogold localization of tight junctional proteins in normal and osmotically-affected rat blood-brain barrier. J Mol Histol. 2004;35:529–539. doi: 10.1007/10.1007/s10735-004-1318-3. [DOI] [PubMed] [Google Scholar]
- Engelhardt B. Development of the Blood-brain barrier interface. In: Dermietzel R, Spray DC, Nedregaard M, editors. Blood-Brain Barriers. From Ontogeny to Artificial Interfaces. Vol. 1. WILEI-VCH Verlag GmbH & Co KGaA; Weinheim: 2006. p. 27. [Google Scholar]
- Furuse M, Hirase T, Itoh M, Nagafuchi A, Yonemura S, Tsukita S, Tsukita S. Occludin –a novel integral membrane-protein localizing at tight junctions. J Cell Biol. 1993;123:1777–1788. doi: 10.1083/jcb.123.6.1777. [DOI] [PMC free article] [PubMed] [Google Scholar]
- Furuse M, Fujita K, Hiiragi T, Fujimoto K, Tsukita S. Claudin-1 and –2: novel integral membrane proteins localizing at tight junctions with no sequence similarity to occludin J. Cell Biol. 1998;141:1539–1550. doi: 10.1083/jcb.141.7.1539. [DOI] [PMC free article] [PubMed] [Google Scholar]
- Gonzales-Mariscal L, Chavez de Ramirez B, Avila-Flores A. MAGUK proteins: structure and role in the tight junction. Cell Dev Biol. 2000;11:315–324. doi: 10.1006/scdb.2000.0178. [DOI] [PubMed] [Google Scholar]
- Goss SA, Johnston RL, Dunn F. Comprehensive compilation of empirical ultrasonic properties of mammalian tissues. J Acoust Soc Am. 1978;64:423–457. doi: 10.1121/1.382016. [DOI] [PubMed] [Google Scholar]
- Gurney KJ, Estrada EY, Rosenberg GA. Blood-brain barrier disruption by stromelysin-1 facilitates neutrophil infiltration in neuroinflammation. Neurobiol Dis. 2006;23:87–96. doi: 10.1016/j.nbd.2006.02.006. [DOI] [PubMed] [Google Scholar]
- Harhaj NS, Felinski EA, Wolpert EB, Sundstrom JM, Gardner TW, Antonetti DA. VEGF activation of protein-kinase C stimulates occludin phosphorylation and contributes to endothelial permeability. Invest Ophthalmol Vis Sci. 2006;47:5106–15. doi: 10.1167/iovs.06-0322. [DOI] [PubMed] [Google Scholar]
- Heiskala M, Peterson PA, Yang Y. The roles of claudin superfamily proteins in paracellular transport. Traffic. 2001;2:92–98. doi: 10.1034/j.1600-0854.2001.020203.x. [DOI] [PubMed] [Google Scholar]
- Hirano A, Kawanami T, Llena JF. Electron microscopy of the blood-brain barrier in disease. Microsc Res Tech. 1994;27:543–556. doi: 10.1002/jemt.1070270609. [DOI] [PubMed] [Google Scholar]
- Hirase T, Staddon JM, Saitou M, Ando Akatsuka Y, Itoh M, Furuse M, Fujimoto K, Tsukita S, Rubin LL. Occludin as a possible determinant of tight junction permeability in endothelial cells. J Cell Sci. 1997;110:1603–1613. doi: 10.1242/jcs.110.14.1603. [DOI] [PubMed] [Google Scholar]
- Hoffstein S, Gennaro DE, Fox AC, Hirsch J, Streuli F, Weissmann G. Colloidal Lanthanum as a marker for impaired plasma membrane permeability in ischemic dog myocardium. Am J Pathol. 1975;79:207–218. [PMC free article] [PubMed] [Google Scholar]
- Huber D, Balda MS, Matter K. Occludin modulates transepithelial migration of neutrophils. J Biol Chem. 2000;275:5773–5778. doi: 10.1074/jbc.275.8.5773. [DOI] [PubMed] [Google Scholar]
- Hynynen K, Vykhodtseva NI, Chung AH, Sorrentino V, Colucci V, Jolesz FA. Thermal effects of focused ultrasound on the brain: determination with MR imaging. Radiology. 1997;204:247–53. doi: 10.1148/radiology.204.1.9205255. [DOI] [PubMed] [Google Scholar]
- Hynynen K, McDannold N, Vykhodtseva N, Jolesz FA. Noninvasive MR imaging-guided focal opening of the blood-brain barrier in rabbits. Radiology. 2001;220:640–646. doi: 10.1148/radiol.2202001804. [DOI] [PubMed] [Google Scholar]
- Hynynen K, McDannold N, Sheikov NA, Jolesz FA, Vykhodtseva N. Local and reversible blood-brain barrier disruption by noninvasive focused ultrasound at frequencies suitable for trans-skull sonications. Neuroimage. 2005;24:12–20. doi: 10.1016/j.neuroimage.2004.06.046. [DOI] [PubMed] [Google Scholar]
- Hynynen K, McDannold N, Vykhodtseva N, Raymond S, Weissleder R, Jolesz FA, Sheikov N. Focal disruption of the blood-brain barrier by 260 KHz ultrasound bursts – A method for molecular imaging and targeted drug delivery. J Neurosurg. 2006;105:445–454. doi: 10.3171/jns.2006.105.3.445. [DOI] [PubMed] [Google Scholar]
- Juffermans LJ, Dijkmans PA, Musters RJ, Visser CA, Kamp O. Transient permeabilization of cell membranes by ultrasound-exposed microbubbles is related to formation of hydrogen peroxide. Am J Physiol Heart Circ Physiol. 2006;291:H1595–1601. doi: 10.1152/ajpheart.01120.2005. [DOI] [PubMed] [Google Scholar]
- Kinoshita M, McDannold N, Jolesz FA, Hynynen K. Targeted delivery of antibodies through the blood-brain barrier by MRI-guided focused ultrasound. Biochem Biophys Res Commun. 2006;340:1085–1090. doi: 10.1016/j.bbrc.2005.12.112. [DOI] [PubMed] [Google Scholar]
- Kinoshita M, McDannold N, Jolesz FA, Hynynen K. Noninvasive localized delivery of Herceptin to the mouse brain by MRI-guided focused ultrasound-induced blood-brain barrier disruption. PNAS. 2006;103:11719–11723. doi: 10.1073/pnas.0604318103. [DOI] [PMC free article] [PubMed] [Google Scholar]
- Kroll RA, Neuwelt EA. Outwitting the blood-brain barrier for therapeutic purposes: osmotic opening and other means. Neurosurgery. 1998;42:1083–1099. doi: 10.1097/00006123-199805000-00082. [DOI] [PubMed] [Google Scholar]
- Liebner S, Fischmann A, Rascher G, Duffner F, Grote E-H, Kalbacher H, Wolburg H. Claudin-1 and claudin-5 expression and tight junction morphology are altered in blood vessels of human glioblastoma multiforme. Acta Neuropathol. 2000;100:323–331. doi: 10.1007/s004010000180. [DOI] [PubMed] [Google Scholar]
- Lossinsky AS, Vorbrodt AW, Wisniewski HM. Scanning and transmission electron microscopic studies of microvascular pathology in the osmotically impaired blood-brain barrier. J Neurocytol. 1995;24:795–806. doi: 10.1007/BF01191215. [DOI] [PubMed] [Google Scholar]
- Nag S, Robertson DM, Dinsdale HB. Intracerebral Arteriolar Permeability to Lanthanum. Am J Pathol. 1982;107:336–341. [PMC free article] [PubMed] [Google Scholar]
- Ohtsuki S, Sato S, Yamaguchi H, Kamoi M, Asashima T, Terasaki T. Exogenous expression of claudin-5 induces barrier properties in cultured rat brain capillary endothelial cells. J Cell Physiol. 2006;210:81–86. doi: 10.1002/jcp.20823. [DOI] [PubMed] [Google Scholar]
- Plumb J, McQuaid S, Mirakhur M, Kirk J. Abnormal endothelial tight junctions in active lesions and normal-appearing white matter in multiple sclerosis. Brain Pathol. 2002;12:154–169. doi: 10.1111/j.1750-3639.2002.tb00430.x. [DOI] [PMC free article] [PubMed] [Google Scholar]
- Rapoport SI. Osmotic opening of the blood-brain barrier: principles, mechanism, and therapeutic applications. Cell Mol Neurobiol. 2000;20:217–230. doi: 10.1023/A:1007049806660. [DOI] [PMC free article] [PubMed] [Google Scholar]
- Sanovich E, Bartus RT, Friden PM, Dean RL, Le HQ, Brightman MW. Pathway across blood-brain barrier opened by the bradykinin agonist, RMP-4. Brain Res. 1995;705:125–135. doi: 10.1016/0006-8993(95)01143-9. [DOI] [PubMed] [Google Scholar]
- Sheikov N, McDannold N, Vykhodtseva N, Jolesz F, Hynynen K. Cellular mechanisms of the blood-brain barrier opening induced by ultrasound in presence of microbubbles. Ultrasound Med Biol. 2004;30:979–989. doi: 10.1016/j.ultrasmedbio.2004.04.010. [DOI] [PubMed] [Google Scholar]
- Sheikov N, McDannold N, Jolesz F, Zhang Y-Z, Tam K, Hynynen K. Brain arterioles show more active vesicular transport of blood-borne tracer molecules than capillaries and venules after focused ultrasound-evoked opening of the blood-brain barrier. Ultrasound Med Biol. 2006;32:1399–1409. doi: 10.1016/j.ultrasmedbio.2006.05.015. [DOI] [PubMed] [Google Scholar]
- Staddon JM, Herrenknecht K, Smales C, Rubin LL. Evidence that tyrosine phosphorylation may increase tight junction permeability. J Cell Sci. 1995;108:609–619. doi: 10.1242/jcs.108.2.609. [DOI] [PubMed] [Google Scholar]
- Stevenson BR, Anderson JM, Braun ID, Mooseker MS. Phosphorylation of the tigh-junctions protein ZO-1 in two strains of Madin-Darby canine kidney cells which differ in transepithelial resistance. Biochem J. 1989;263:597–599. doi: 10.1042/bj2630597. [DOI] [PMC free article] [PubMed] [Google Scholar]
- Treat LH, McDannold N, Zhang Y, Vykhodtseva N, Hynynen K. Targeted delivery of doxorubicin to the rat brain at therapeutic levels using MRI-guided focused ultrasound. Int J Cancer. 2007;121:901–907. doi: 10.1002/ijc.22732. [DOI] [PubMed] [Google Scholar]
- Van Wamel A, Kooiman K, Harteveld M, Emmer M, ten Cate FJ, Versluis M, de Jong N. Vibrating microbubbles poking individual cells: drug transfer into cells via sonoporation. J Control Release. 2006;112:149–155. doi: 10.1016/j.jconrel.2006.02.007. [DOI] [PubMed] [Google Scholar]
- Vykhodtseva NI, Sorrentino V, Jolesz FA, Bronson RT, Hynynen K. MRI detection of the thermal effects of focused ultrasound on the brain. Ultrasound Med Biol. 2000;26:871–880. doi: 10.1016/s0301-5629(00)00216-7. [DOI] [PubMed] [Google Scholar]
- Willis CL, Leach L, Clarke GJ, Nolan CC, Ray DE. Reversible disruption of tight junction complexes in the rat blood-brain barrier, following transitory focal astrocyte loss. Glia. 2004;48:1–13. doi: 10.1002/glia.20049. [DOI] [PubMed] [Google Scholar]
- Wolburg H, Neuhaus J, Kniesel U, Krauss B, Schmid EM, Ocalan M, Farrell C, Risau W. Modulation of tight junction structure in blood-brain barrier endothelial cells. Effects of tissue culture, second messengers and cocultured astrocytes. J Cell Sci. 1994;107:1347–1357. doi: 10.1242/jcs.107.5.1347. [DOI] [PubMed] [Google Scholar]
- Wolburg H, Wolburg-Buchholz K, Kraus J, Rascher-Eggstein G, Liebner S, Hamm S, Duffner F, Grote E-H, Risau W, Engelhardt B. Localization of claudin-3 in tight junctions of the blood-brain barrier is selectively lost during experimental autoimmune encephalomyelitis and human glioblastoma multiforme. Acta Neuropathol. 2003;105:586–592. doi: 10.1007/s00401-003-0688-z. [DOI] [PubMed] [Google Scholar]
- Yang FY, Fu WM, Yang RS, Liou HC, Kang KH, Lin WL. Quantitative evaluation of focused ultrasound with a contrast agent on blood-brain barrier disruption. Ultrasound Med Biol. 2007;33:1421–7. doi: 10.1016/j.ultrasmedbio.2007.04.006. [DOI] [PubMed] [Google Scholar]