

Abstract
Three phenols with pendant, hydrogen-bonded bases (HOAr-B) have been oxidized in MeCN with various one-electron oxidants. The bases are a primary amine (–CPh2NH2), an imidazole, and a pyridine. The product of chemical and quasi-reversible electrochemical oxidations in each case is the phenoxyl radical in which the phenolic proton has transferred to the base, •OAr-BH+, a proton-coupled electron transfer (PCET) process. The redox potentials for these oxidations are lower than other phenols, predominately from the driving force for proton movement. One-electron oxidation of the phenols occurs by a concerted proton-electron transfer (CPET) mechanism, based on thermochemical arguments, isotope effects, and ΔΔG‡/ΔΔG°. The data rule out stepwise paths involving initial electron transfer to form the phenol radical cations [•+HOAr-B] or initial proton transfer to give the zwitterions [−OAr-BH+]. The rate constant for heterogeneous electron transfer from HOAr-NH2 to a platinum electrode has been derived from electrochemical measurements. For oxidations of HOAr-NH2, the dependence of the solution rate constants on driving force, on temperature, and on the nature of the oxidant, and the correspondence between the homogeneous and heterogeneous rate constants, are all consistent with the application of adiabatic Marcus Theory. The CPET reorganization energies, λ = 23 – 56 kcal mol−1, are large in comparison with those for electron transfer reactions of aromatic compounds. The reactions are not highly nonadiabatic, based on minimum values of Hrp derived from the temperature dependence of the rate constants. These are among the first detailed analyses of CPET reactions where the proton and electron move to different sites.
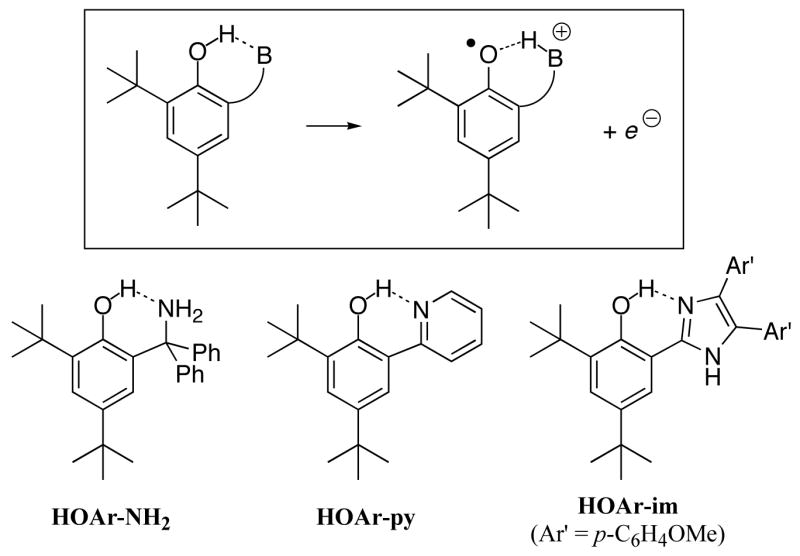
Proton-coupled electron transfer (PCET) is of much current interest as it is important in a variety of chemical and biological processes.1,2 Such reactions can occur by concerted or stepwise mechanisms. The stepwise possibilities include initial transfer of the proton followed by electron transfer (PT-ET), sometimes termed proton-gated electron transfer,3 and ET followed by PT (ET-PT). Reactions in which the proton and electron transfers occur in one single kinetic step have recently been termed concerted proton-electron transfer (CPET).4,5 CPET encompasses a range of processes that involve the transfer of an electron and a proton, including hydrogen atom transfer (HAT),6 and non-HAT processes where the e− and H+ are separated in the reactants, products, and/or at the transition structure.7–8,9,10,11 While HAT reactions continue to be the subject of extensive study in organic radical chemistry, the second class of CPET has received less attention. This report describes studies of a set of reactions of the latter class: oxidations of intramolecularly hydrogen bonded phenols (Scheme 1). Removal of an electron from these compounds results in transfer of the phenolic proton to the base. These reactions involve movement of both e− and H+ but cannot be described as HAT.
Scheme 1.
PCET oxidations of phenols to phenoxyl radicals are of particular importance in biological systems because of the widespread involvement of tyrosyl radicals in enzymatic processes.12 They have been implicated as intermediates in class I ribonucleotide reductases,13 photosystem II,14 prostaglandin H synthases 1 and 2,15 cytochrome c oxidase,16 galactose oxidase,17 amine oxidases18 and other systems.12 In many cases, the phenoxyl radical is generated from the phenol by outer-sphere electron transfer, with release of the proton to a nearby residue (histidine, arginine, lysine, etc.) or to a hydrogen bonded network.12 An interesting example is the oxidation of tyrosine 160 of the D2 subunit (YZ) in Photosystem II by long-range electron transfer to the light-induced chlorophyll radical cation P680+.19 The phenolic proton of YZ is likely transferred to a hydrogen-bonded histidine (His190 of subunit D1). This tyrosyl radical then is involved in the oxidation of the manganese cluster and eventually the conversion of water to O2.
The HOAr-B systems examined here were designed to model such phenol oxidations with concomitant proton transfer. Related model studies include oxidation of tyrosine by a pendant photogenerated [Ru(bpy)3]3+ or a photoexcited ReI center8,9 and electron transfer from phenol-pyridine adducts to photoexcited C60.7 These previous studies have all involved intermolecular proton transfer (PT), in some cases to bulk solution, while the HOAr-B compounds reported here have an intramolecular PT in aprotic media. The use of aprotic media and a strong initial hydrogen bond provides the advantage of being able to keep track of the proton but may limit the generality of the conclusions. More studies are required to model biological and chemical systems with weaker hydrogen bonding interactions, and systems in which the formation of charged intermediates is more facile (perhaps with a higher local effective dielectric constant). Our studies and the model systems mentioned above all conclude that concerted proton-electron transfer is the dominant pathway under most conditions, but Hammarström and co-workers have shown that a proton-first mechanism takes over at high pH where deprotonation of tyrosine is energetically accessible.8 Similarly, elegant work by Okamura and others has indicated stepwise mechanisms for quinone reduction in photosystem I.20
The motif of a tyrosine hydrogen-bonded to a base may be viewed as a biological redox cofactor. A variety of other electron transfer cofactors, such as iron-sulfur clusters, hemes, and quinones, have been studied and understood based on the Marcus-Hush Theory of electron transfer.21 We have previously shown that rate constants for hydrogen atom transfer reactions are in many cases well predicted by the Marcus cross relation.22 This report shows that Marcus Theory can also be applied to non-HAT CPET reactions, and it describes the characteristics of the HOAr-B compounds as electron transfer reagents, highlighting the influence of the PT on the thermodynamics and kinetics of electron transfer. The results are also discussed in light of the more recent and more sophisticated theoretical models of CPET.23 A preliminary report has described the oxidation of one of the phenols, HOAr-NH2.24
Results
1. Syntheses and Characterization of Compounds
The phenol-amine HOAr-NH2 was synthesized as outlined in Scheme 2, following literature precedents.25 The tertiary -CPh2NH2 and tBu substituents in the 2, 4, and 6 positions confer stability on the derived phenoxyl radical; 2,4,6-tBu3C6H2O•, for instance, is stable in solution.26 Recently 2,4-di-tert-butyl-6-(N-methyl-2-pyrrolidyl)phenol was reported to give a persistent oxidized form, decaying over 30 min after bulk electrolysis.27 Related compounds with a –CH2– spacer between the amine and the phenol are readily available via the Mannich reaction (phenol + formaldehyde + amine),28 but such compounds are susceptible to radical attack at the benzylic hydrogens (and at other C–H bonds α to the amine).29 The Mannich procedure cannot be used to make tertiary substituents because of the decreased reactivity of the ketone-derived iminium cation.28 HOAr-NH2 was therefore synthesized by addition of benzophenone to the lithiated phenol, leading to the gem-diphenyl substituents.25a Subsequent trityl chemistry leads to products.25b,c The corresponding chemistry with gem-methyl groups is diverted by elimination from the HOArCMe2OH intermediate under the mild acidic conditions.
Scheme 2.

Synthesis of HOAr-NH2.
The related phenol with a 4,5-bis(4-anisyl)-2-imidazolyl substituent, HOAr-im, has been reported by Benisvy30 and the pyridyl compound HOAr-py has been prepared by Fujita.31 In each case, the authors explored the compounds’ properties as ligands to metals. Both compounds fluoresce under ultraviolet light due to excited-state intramolecular proton transfer (ESIPT).32
The X-ray crystal structures of HOAr-NH2, HOAr-py, and HOAr-im (Figure 1) all show molecules with intramolecular hydrogen bonds from the phenol to the nitrogen base. There is some twisting between the phenol and pyridyl or imidazolyl rings, with inter-ring torsion angles of 22.6° for HOAr-im and 11.9–15.4° for the three crystallographically independent molecules of HOAr-py. In the two independent molecules of HOAr-NH2, the NCCC torsion angles are 33.4 and 42.0°. Similar structures have been observed for related molecules.33 The O•••N distances across the hydrogen bond vary from between 2.550(3) and 2.646(2) Å (Table 1), which are in the shorter portion of the known range for OH••N hydrogen bonds.33,34 Crystal packing forces appear to play a significant role in these distances, as the two independent molecules of HOAr-NH2 in the unit cell have O•••N distances that differ by 0.063 (4) Å; for the three molecules of HOAr-py, the O •••N distances vary by 0.012(3) Å. The imidazole derivative crystallizes with a molecule of methanol that is hydrogen-bonded to the imidazole hydrogen.
Figure 1.

ORTEP drawings of (a) HOAr-NH2, (b) HOAr-im, and (c) HOAr-py
Table 1.
Structural, spectroscopic, and electrochemical data for phenol-bases.
| phenol (HOAr-B) | dO•••N (Å) | δO–H (ppm)a | E1/2 [V] (δEp [mV])b |
|---|---|---|---|
| HOAr-NH2 | 2.550(2), 2.613(3)c | 12.32 | 0.37 (143)d |
| HOAr-im | 2.646(2) | 13.42 | 0.42 (105)e |
| HOAr-py | 2.561(3), 2.567(3), 2.573(3)f | 14.83 | 0.58 (100)d |
1H NMR data in CD3CN.
E vs. Cp2Fe+/0.
Two independent molecules in the unit cell.
Scan rate = 200 mV s−1.
Scan rate = 100 mV s−1.
Three independent molecules in the unit cell.
NMR spectra of the phenols in dry CD3CN all show sharp downfield resonances for the phenolic proton, e.g., 12.32 ppm for HOAr-NH2, typical of intramolecularly hydrogen-bonded phenols.35a The chemical shifts for HOAr-py (14.83 ppm) and HOAr-im (13.42 ppm) are farther downfield as has been previously observed for related compounds36 that have ‘resonance-assisted hydrogen bonds’ due to the conjugation between the phenol and the basic site.34c,37 The two p-anisyl groups in HOAr-im are inequivalent, indicating that intermolecular proton transfer between imidazole nitrogen atoms is slow on the NMR timescale, presumably due in part to the strong OH••N hydrogen bond.
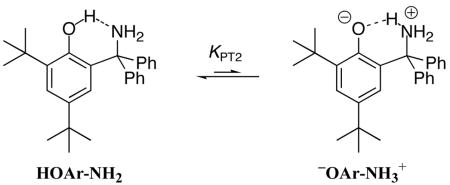
The UV-vis spectrum of HOAr-NH2 contains absorptions typical of aromatic compounds35b at 207 nm (40,000) and 287 nm (3600) (Figure 2a; the ε value is stated parenthetically after each λmax in M−1 cm−1) The deprotonated phenol (−OAr-NH2) is generated in MeCN by addition of excess di(tetra-n-butylammonium) succinate.38−OAr-NH2 has additional absorptions at 259 (6900) and 327 nm (4700) (Figure 2b), low energy absorptions that are typical of phenoxides.35 A UV-vis spectrum of a saturated (16.0 mM) MeCN solution of HOAr-NH2 in a 10.00 cm quartz cell shows no absorption maximum in the phenoxide region (inset of Figure 2a). These optical spectra provide an estimate of the equilibrium constant KPT2 for formation of the zwitterion −OAr-NH3+ (eq 1). Mannich bases with strongly acidic phenols can exist in this tautomeric form, and the optical spectrum of the phenoxide (e.g., −OAr-NH2) has often been taken as a model for the low-energy part of the spectrum of the zwitterion.39 With this assumption, the lack of an absorption maximum at 327 nm (εHOAr-NH2(327) = 1.1 M−1 cm−1) implies that essentially no zwitterion is present in MeCN solution, that KPT2 < 10−4. Similarly, the UV-vis spectrum of HOAr-py shows no peak above 385 nm that would be characteristic of the proton-transferred structure.40
Figure 2.

UV-vis spectra of (a) phenol HOAr-NH2 and (b) phenoxide −OAr-NH2 in MeCN. The inset of spectrum (a) is the spectrum of a saturated solution of HOAr-NH2 in a 10 cm pathlength cell.
 |
(1) |
2. Cyclic Voltammetry and Chemical Oxidations
Oxidations of HOAr-NH2, HOAr-im and HOAr-py with near stoichiometric amounts of [N(p-C6H4Br)3]•+ yield the corresponding phenoxyl radical (Scheme 1 above), by both UV-vis and 1H NMR spectroscopies (at ~10 μM and ~1 mM concentrations, respectively). The reactions are marked by rapid decrease of the intense absorption of the blue aminium ion at 699 nm (40,000 M−1 cm−1). These reactions, and most of the solution measurements in this report, were done in MeCN.
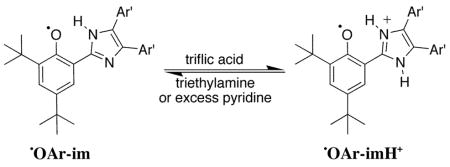
Oxidation of HOAr-im with [N(p-C6H4Br)3]•+ yields a blue solution of •OAr-imH+ with an absorption at 695 nm (8300) which decays to ~33% intensity over 1.5 h. Phenoxyl radicals typically have absorptions between 420 and 720 nm, with higher intensity for the more conjugated radicals [λmax, nm (ε, M−1 cm−1)]: 2,4,6-tri-t-butylphenoxyl radical (tBu3ArO•), 630 (400), benzene;41 2,6-tBu2-4-Ph-C6H2OH, 488 (2780); 2,6-tBu2-4-(Me2NC6H4)C6H2OH, 650 (6000).26 Treating •OAr-imH+ in MeCN with triethylamine or excess pyridine (pKa = 18, 12, respectively38) produces a purple solution with λmax = 544 nm (approx. 6100) due to the deprotonated phenoxyl radical •OAr-im (Figure 3, eq 2). This species likely still has an intramolecular hydrogen bond from the imidazole hydrogen to the oxyl radical. •OAr-im was prepared independently by heterogeneous PbO2 oxidation of HOAr-im in MeCN or DMSO.42 This isolated •OAr-im had an absorption at 544 nm and contained some HOAr-im by 1H NMR. Addition of 1 equivalent of triflic acid to solutions of •OAr-im formed the 695 nm absorption characteristic of •OAr-imH+ (eq 2).
Figure 3.

Visible spectra of (a) •OAr-imH+ and (b) •OAr-im in MeCN.
 |
(2) |
Oxidation of HOAr-py by [N(p-C6H4Br)3]•+ gives a yellow solution with λmax = 481 nm (1600) which fades with t1/2 ≈ 8 h. Reactions of HOAr-NH2 with [N(p-C6H4Br)3]•+ show no absorptions above 400 nm at 100 μM, indicating a colorless radical product. A complex EPR spectrum was recorded for one of the oxidation mixtures of HOAr-NH2 in CH2Cl2 (see Supporting Information of ref 24). 1H NMR monitoring of reactions of HOAr-NH2 with substoichiometric amounts of [N(p-C6H4Br)3]•+ in MeCN showed reduced signals for HOAr-NH2 and the appearance of N(p-C6H4Br)3. With excess [N(p-C6H4Br)3]•+, the amine is not observed because there is rapid exchange between NAr3 and [NAr3]•+ by electron transfer.43
The cyclic voltammograms of the three phenols in 0.1 M nBu4NPF6/MeCN (Table 1, EFigures 4a and S20 in Supporting Information) are quasi-reversible, with almost equal anodic and cathodic currents but with peak separations (Δp) larger than the theoretical 59 mV. The rate constant for heterogeneous electron transfer (kel) for HOAr-NH2 has been determined by analysis of the CV data at different scan rates ν (Figure 4a).44 kel is related to ΔEp and ν by eqs 3 and 4:
| (3) |
| (4) |
where DO and DR = diffusion constant (cm2 s−1) for the oxidized and reduced forms of the analyte, α = the transfer coefficient (taken to be 0.545), and R and T have their standard meanings. A, DO, and DR were determined using chronoamperometry (see Supporting Information). kel was found to be (3 ± 1) × 10−3 cm s−1 from the slope of a plot of ψ vs. ν−1/2. (Figure 4b). To support our measurements, these parameters were used to simulate the CVs using DigiSim46 with good results (inset, Figure 4a). For comparison, Evans, Savéant, and co-workers have recently reported a much slower heterogeneous rate constant of (9 ± 5) × 10−7 cm s−1 for CPET reduction of a water-superoxide complex, which exhibits a much more distorted cyclic voltammogram.4
Figure 4.

(a) Cyclic voltammograms of HOAr-NH2 with ν = 20, 50, 100, and 200 mV s−1. Inset: an overlay of the simulated (blue dots) and experimental CV’s at 100 mV s−1. (b) Plot of ψ vs. ν−1/2 for HOAr-NH2 (see eqs 3 and 4 in text).
Similar quasi-reversible voltammograms have been reported for other phenols with intra-or intermolecularly hydrogen-bonded amine or pyridine bases.7,27,30,47 In contrast, electrochemical oxidations of phenols without an attached base are irreversible in dried aprotic solvents, occurring via an EC mechanism. The chemical step (“C”) is typically proton transfer into the bulk solution which is effectively irreversible in aprotic media.48 Thus oxidation of 2,4,6-tBu3ArOH is irreversible in dry MeCN even though the radical 2,4,6-tBu3ArO• is stable.48a Matsumura et al. have shown27 that moving the attached base from the ortho to the para position changes the oxidation from quasi-reversible to irreversible. Oxidation of the methyl ether MeOAr-NH2 is irreversible (Ep,a = 1.2 V, all potentials in this report are vs. Cp2Fe0/+ in MeCN), probably because without the stabilizing proton transfer the high energy anisyl or aminium radical cation decays rapidly. The related phenol-alcohol HOAr-OH [(2-CPh2OH)(4,6-tBu2)C6H2OH] also shows irreversible electrochemistry (Ep,a = 1.1 V), possibly because proton transfer to the weakly basic primary alcohol is not favored and the proton is lost to the bulk solution. CV of the phenoxide −OAr-NH2, as the nBu4N+ salt, shows a reversible oxidation wave centered at −0.57 V, essentially equal to the E1/2 for 2,4,6-tri-tert-butylphenoxide, −0.572 V.48a,53
The average of the anodic and cathodic peaks for HOAr-NH2, HOAr-im and HOAr-py are taken as the E1/2 for the coupled proton-electron transfer (CPET), the potential for transfer of both an electron to the electrode and the phenolic proton to the amine (Scheme 1). This is the interpretation of most of the previous electrochemical studies of phenol/base systems.7,27,30 One recent paper has interpreted the large ΔEp for oxidation of a phenol-amine as indicating a stepwise EC (ET-PT) mechanism47a but this is, in our view, inappropriate.47b The assignment of E1/2 as the energetics of CPET is supported by the thermodynamic discussion below and by the following equilibration experiment.
Oxidation of HOAr-NH2 by [N(tol)3]•+ yields an equilibrium mixture with the phenoxyl radical and the tri-p-tolylamine, with equilibrium constant K5 (eq 5). Addition of N(tol)3 to the
| (5) |
reaction mixture causes an increase in the optical absorbance due to [N(tol)3]•+, yielding K5 = 2.4. Alternatively, addition of aliquots of triflic acid to solutions containing large excesses of N(tol)3 and HOAr-NH2 versus [N(tol)3]•+ quantitatively protonates HOAr-NH2 and therefore shifts the equilibrium toward [N(tol)3]•+. This experiment afforded K5 = 1.5, and also established that a second proton transfer equilibrium, eq 6, is not significant (K6 ≪ 1).49 It should be noted that
| (6) |
these equilibrium experiments are only possible because of the stability of the phenoxyl radical on the chemical timescale. Together, the equilibria establish an overall equilibrium constant K5 = 2.0 + 0.5, which implies a difference in redox potential between E(HOAr-NH2+/0) and E([N(tol)3]•+/0) of 18 ± 8 mV. This is in excellent agreement with the 20 ± 30 mV difference in the electrochemical E1/2 values: 0.36 ± 0.02 V for HOAr-NH2+/0 and 0.38 ± 0.02 V for [N(tol)3]•+/0. The agreement validates the assignment of the phenol E1/2 values as E° (CPET).
The oxidants used in this study include variously substituted triarylaminium ions [N(p-C6H4X)3]•+, iron(III) tris-polypyridyl complexes [Fe(N–N)3]3+ (N–N = 2,2′-bipyridine or 1,10-phenanthroline derivative), and the 10-methylphenothiazinium ion [MPT]•+. All displayed reversible cyclic voltammograms (Table 2). The [Fe(N–N)3]3+/2+ potentials in MeCN vary substantially with ionic strength due to differences in ion pairing between the FeII and FeIII forms.50 For [Fe(5,5′-Me2bpy)3]3+/2+, the potential changes by −40 ± 4 mV/log(i). Kinetic studies using [Fe(R2bpy)3]3+ and [Fe(MeXphen)3]3+ were done at 0.1 M ionic strength to match the electrochemical conditions. For the singly-charged [N(tol)3]•+, the change in potential with ionic strength was found to be minimal [3 ± 1 mV/log(i)].
Table 2.
Potentials of oxidants (in MeCN, V vs. Cp2Fe+/0)a
| Oxidant | E1/2 | Oxidant | E1/2 |
|---|---|---|---|
| [N(p-C6H4Br)3]•+ | 0.67 | [Fe(bpy)3]3+ | 0.70 |
| [N(p-C6H4OMe)(p-C6H4Br)2]•+ | 0.48 | [Fe(5,5′-Me2bpy)3]3+ | 0.58 |
| [N(tol)3]•+b | 0.38 | [Fe(4,7-Me2phen)3]3+ | 0.53 |
| [N(p-C6H4OMe)2(p-C6H4Br)]•+ | 0.32 | [Fe(3,4,7,8-Me4phen)3]3+ | 0.46 |
| [N(p-C6H4OMe)3] •+ | 0.16 | [MPT]•+c | 0.32 |
See Experimental for conditions.
Tri-p-tolylaminium.
10-Methylphenothiazinium.
3. Kinetics
The rates of oxidation of the phenols have been monitored by stopped-flow kinetics, following the disappearance of the oxidant in reactions of [NAr3]•+or the appearance of [Fe(N–N)3]2+ in reactions with iron oxidants. Reactions of the iron complexes were performed in MeCN containing 0.1 M nBu4NPF6 to match the electrochemical conditions (see above). When possible, reactions were performed with a large excess of phenol relative to oxidant (>5 equiv).
The time sequences of optical spectra were globally analyzed to derive rate constants using SPECFIT™ software51 (or, in one instance,49 Microsoft Excel®) (Table 3). For thermodynamically favorable reactions (Keq » 1) run under pseudo-first order conditions, the second-order rate constant was taken as the slope of a plot of kobs vs. [HOAr-B]. Particularly fast reactions were analyzed with second-order kinetics, and reactions with Keq ≲ 1 were analyzed as opposing second-order reactions. In each case, the rate constant was derived from approximately 25 kinetic runs, at five different concentrations. The temperature dependence of the rate constants was measured over 30–47 K ranges (Figure 5), yielding the Eyring parameters52 in Table 4 below. Variations in driving force over the appropriate temperature ranges for the reactions of HOAr-NH2 + [N(tol)3]•+ and HOAr-py + [Fe(5,5′-Me2bpy)3]3+ were evaluated by cyclic voltammetry of the individual reagents. The difference between the half-reaction potentials measured at 2 °C and 46 °C (for HOAr-py and [Fe(5,5′-Me2bpy)3]3+) or 49 °C (for HOAr-NH2 and [N(tol)3]•+) were found to be within the propagated experimental error (±30 mV).
Table 3.
Rate constants for phenol oxidations (295 ± 2 K, MeCN).
| Phenol | oxidanta | k (M−1 s−1) | Erxnb(V) |
|---|---|---|---|
| HOAr-NH2 | [Fe(bpy)3]3+ | (4 ± 1) ×106 | 0.34 |
| [N(p-C6H4Br)3]•+ | (4 ± 2) × 107 | 0.31 | |
| [Fe(5,5′-Me2bpy)3]3+ | (1.5 ± 0.2) ×l05 | 0.22 | |
| [Fe(4,7-Me2phen)3]3+ | (3.8 ± 0.4) × 105 | 0.16 | |
| [N(p-C6H4OMe)(p-C6H4Br)2]•r | (8 ± 1) × 105 | 0.12 | |
| [Fe(3,4,7,8-Me4phen)3]3+ | (3.0 ± 0.3) × 104 | 0.09 | |
| [N(tol)3]•+ | (1.1 ± 0.2) ×105 | 0.02 | |
| [N(p-C6H4OMe)3]•+ | (1.1±0.1) ×103 | −0.20 | |
| [N(p-C6H4OMe)2(p-C6H4Br)]•+ | (2.7 ± 0.3) × 104 | −0.04 | |
| [MPT]•+ | (3.2 ± 0.3) × 104 | −0.04 | |
| DOAr-ND2c | [Fe(5,5′-Me2bpy)3]3+ | (5.8 ± 0.6) × 104 | 0.22 |
| kH/kD = 2.6 ± 0.4d | |||
| [N(tol)3]•+ | (4.3 ± 0.4) × 104 | 0.02 | |
| kH/kD = 2.5 ± 0.3d | |||
| [N(p-C6H4OMe)3]•+ | (6.9 ± 0.7) × 102 | −0.20 | |
| kH/kD = 1.6±0.2d | |||
| HOAr-im | [N(p-C6H4OMe)3]•+ | (1.1 ± 0.1) × 104 | −0.26 |
| HOAr-py | [Fe(bpy)3]3+ | (5.2 ± 0.8) × 106 | 0.12 |
| [Fe(5,5′-Me2bpy)3]3+ | (5.8 ± 0.9) × 105 | 0.00 | |
| [Fe(4,7-Me2phen)3]3+ | (1.9 ± 0.4) × 106 | −0.05 | |
| [Fe(3,4,7,8-Me4phen)3]3+ | (3.3 ± 0.6) × 105 | −0.12 | |
| DOAr-py c | [Fe(bpy)3]3+ | (1.5±0.2) ×l06 | 0.12 |
| kH/kD = 2.8 ± 0.6 | |||
| [Fe(5,5′-Me2bpy)]3]3+ | (2.3 ± 0.4) × 105 | 0.00 | |
| kH/kD = 2.5 ± 0.6 |
Reactions with [Fe(N–N)3]3+ were performed in 0.1 M Bu4NPF6/MeCN.
Erxn = E1/2(oxidant) − E1/2(phenol).
Reactions with deuterated substrates were performed in 0.5–1% v/v CH3OD in MeCN. Rate constants are corrected for residual proton content using kexpt = kD(1 − fH) + fHKH where fH is the fraction protonated.
kHOAr-NH2/kDOAr-ND2.
Figure 5.
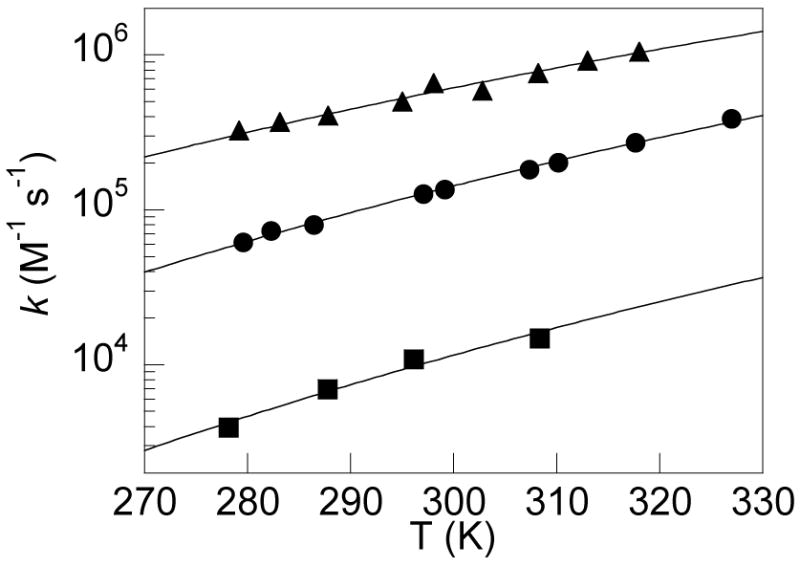
Temperature dependence of the rate constants for HOAr-py + [Fe(5,5′-Me2bpy)3]3+ (▴), HOAr-NH2 + [N(tol)3]•+ (●), and HOAr-im + [N(C6H4OMe)3]•+ (▪). The curve fits are to the nonadiabatic form of the Marcus equation (eq 15; see Discussion).
Table 4.
Activation parameters, adiabatic reorganization energies, and apparent non-adiabatic reorganization energies and Hrp values for phenol-base oxidations.a
| Reaction | λ12(E)b | λ12(T)b | λ11c | [λ12(nonad)]d | [Hrp]d | ΔH‡e | ΔS‡e |
|---|---|---|---|---|---|---|---|
| HOAr-NH2 + [N(Ar)3]•+f | 34 ± 1 | 33 ± 1 | 53 ± 3 | [29.6 ± 1.6] | [10 ± 4] | 6.3 ± 0.4 | −14.1 ± 1.3 |
| HOAr-NH2 + [Fe(N-N)3]3+g | 38 ± 2 | h | 52 ± 4 | h | h | h | h |
| HOAr-NH2 + [MPT]•+ | 35 ± 1i | h | 58 ± 3i | h | h | h | h |
| HOAr-py + [Fe(R2bpy)3]3+gj | 27 ± 1 | 27 ± 1 | 30 ± 3 | [23.2 ± 1.6] | [6 ± 2] | 4.7 ± 0.4 | −16.0 ± 1.2 |
| HOAr-py + [Fe(Mexphen)3]3+g | 22 ± 1 | h | 23 ± 3 | h | h | h | h |
| HOAr-im + [N(anisyl)3]•+k | 25 ± 2i | 25 ± 2 | 36 ± 4i | [17 ± 3] | [4 ± 3] | 7.0 ± 0.7 | −17 ± 3 |
ΔH‡ and λ, in kcal mol−1, ΔS‡ in cal K−1 mol−1 (e.u.), and Hrp in cm−1.
λ12(E) and λ12(T) are the adiabatic reorganization energies calculated from the dependence of k on either E° or T using eq 12 (Figures 5,6).
λ11 is the adiabatic reorganization energy for HOAr-B/•OAr-HB+ self exchange from eq 13 [using the average of λ12(E) and λ12(T)].
λ12(nonadiabatic) and Hrp from eq 15 which may not be appropriate; see text.
Temperature dependent results for HOAr-NH2 + [N(tol)3]•+, 280 ≤ T ≤ 327 K.
Not determined.
From a single phenol/oxidant pair.
Temperature dependent results for HOAr-py + [Fe(Me2bpy)3]3+, 279 ≤ T ≤ 318 K.
anisyl = -C6H4OMe; 279 ≤ T ≤ 309 K.
To determine the kinetic isotope effects, MeCN solutions of HOAr-NH2 and HOAr-py were prepared with 0.5–1% v/v CH3OD and the kinetics performed otherwise as above. The large molar excess of CH3OD provided high isotopic enrichment at the exchangeable OH and NH2 positions (the rate constants were corrected for the residual proton content in the CH3OD). Control experiments showed that addition of 1% v/v protio-methanol (CH3OH) does not affect the rate constant for these reactions. kHOAr-NH2/kDOAr-ND2 ranges from 1.6 ± 0.2 to 2.6 ± 0.4 and kHOAr-py/kDOAr-py = 2.5 ± 0.6 or 2.8 ± 0.6 depending on the oxidant (Table 3).
Discussion
Phenols with an intramolecular hydrogen bond react with one-electron oxidants to generate phenoxyl radicals in which the proton has transferred. The phenols and phenoxyl radicals have been characterized by spectroscopy, cyclic voltammetry, and chemical reactivity. The kinetics of oxidation have been examined for a number of phenol-oxidant pairs, and in one case electrochemically. We first discuss the thermochemistry of outer-sphere oxidation of these phenols, then the mechanistic data that implicate a concerted proton-electron transfer (CPET) pathway for the reactions. Finally, analysis of the CPET rate constants indicates that the classical Marcus theory is an excellent starting point to understand these processes.
1. Phenol Potentials
The potentials for HOAr-B (0.36–0.58 V vs. Cp2Fe+/0 in MeCN, Table 1) are significantly less than reported values for one-electron oxidation of phenols without a pendant base. 2,4,6-Tri-t-butylphenol, for example, has Ep,a[tBu3ArOH•+/0] = 1.09 V.53 Such large shifts have been suggested to be due to hydrogen-bonding effects but the analysis below shows that the shifts must be due to proton transfer.47
Consider the oxidation of a phenol hydrogen-bonded to a base B by electron transfer without proton transfer. The effect of the hydrogen bonding is illustrated by the thermochemical cycle in Scheme 3a, which compares the potentials for the H-bonded and non-H-bonded forms (EArOH–B+/0,EArOH+/0). The difference between these two potentials is equal to the difference in the strengths of the hydrogen bonds in the reduced and oxidized forms (ΔGHB/red − ΔGHB/ox) (eq 7). Note that the absolute hydrogen bond strengths are not important, only the change upon oxidation. Since most hydrogen bonds are 3–8 kcal mol−1,54 shifts of more than ca. 5 kcal mol−1 (0.2 V) would be quite unusual. A very recent experimental study in general supports these thermochemical arguments.55
Scheme 3.

Thermochemical cycle indicating the effect on hydrogen bonding on redox potentials.
The effect of the hydrogen bonding on a CPET redox potential is similar. Progressing around the thermochemical cycle in Scheme 3b, (1) the hydrogen bond in HOAr-B is broken (−ΔGHB/red); (2) the not-hydrogen-bonded phenol is oxidized (EArOH+/0); (3) the proton is transferred (−RTΔpKa); and (4) the hydrogen bond of •OAr-BH+ is formed (ΔGHB/ox). The sum of these four steps is equal to the overall potential (eq 8). For the sterically crowded phenols discussed here, EArOH+/0, is probably well approximated by the tBu3ArOH•+/0 potential.56 With this approximation, the difference between the potential for •OAr-HB+/HOAr-B and that for tBu3ArOH•+/0 is the energetics of the proton transfer step (−RTΔpKa) plus the difference in hydrogen bond strengths. As in the pure electron transfer case of Scheme 3a, it is the change in H-bond strengths rather than their absolute value that is important.
The change in hydrogen bond strength and the attendant shift of the redox potential is likely to be quite small. As noted above, the hydrogen bonded phenoxide “OAr-NH2 has the same potential as the non-H-bonded 2,4,6-(Bu3ArO”. The potentials for tBu3ArOH (+1.09 V), the anisole MeOAr-NH2 (~1.2 V), and the hydroxy-phenol HOAr-OH (~ 1.1 V) are quite similar despite what are likely very different H-bonds (OH••NCMe, O••HN, and OH••OH). Hammarström and co-workers attribute 0.10 V (2 kcal mol−1) to the change in hydrogen bonding for the tyrosine-histidine pair in their model system.57 Phenoxyl radicals are known to make strong hydrogen bonds in some systems,58 so the H-bond in •OAr-BH+ could be stronger than that in HOAr-B, but this effect is usually small. The H-bond strengthening upon oxidation of catechols to oxyl radicals has been variously estimated as ~4 kcal mol−1 to < 1 kcal mol−1.58 The strengthening in catechols and 1,8-napthalene diols is particularly large because oxidation yields hydrogen bonds in which PT is degenerate; one report describes a ~7 kcal mol−1 (0.3 eV) strengthening for 1,8-naphthalene diols.58d For the case of HOAr-NH2, the hydrogen bond could be stronger in the neutral phenol because of the much larger pKa mismatch between donor and acceptor in the radial cation.59 This would shift the potential in the opposite direction.
In sum, the difference of 0.5 – 0.7 V in redox potentials for HOAr-B vs. tBu3ArOH•+/0 are too large to be due to changes in hydrogen bond strength. These differences are primarily due to the proton transfer from the phenol radical cation to the base, step 3 in Scheme 3b. In MeCN, 2,4,6-tri-t-butylphenol radical cation has a pKa of ca. 060 and protonated benzylamine has a pKa of 17,38 yielding a ΔpKa of 17. This provides a crude prediction of a shift of 1 V (ΔE = 0.059 V × ΔpKa), somewhat larger than the observed 0.73 V difference between E(•ArO-NH3+/HOAr-NH2) vs. E(tBu3ArOH•+/0).
2. Mechanistic Analysis
There are three reasonable mechanisms for the one-electron oxidation of the hydrogen-bonded phenols (Scheme 4). Rate-limiting outer-sphere electron transfer could yield the phenolic radical cation (•+HOAr-B), which would be followed by fast proton transfer to give the product (ET1-PT1). Radical cations of simple phenols are well established transients, particularly in photochemical processes.61 Alternatively, pre-equilibrium proton transfer to yield the zwitterion (−OAr-BH+), could be followed by electron transfer (PT2-ET2). Zwitterions such as −OAr-BH+ are well known in phenol-base chemistry, particularly when the phenolic portion is highly acidic as in p-nitrophenols.39,40,62 Rate-limiting proton transfer is ruled out because different oxidants react at different rates and because PT between electronegative elements in general occurs at very fast rates.63 The defining characteristic of the stepwise mechanisms is the formation of an intermediate with a finite lifetime. The third mechanism is the concerted transfer of both particles, CPET, defined by the absence of an intermediate along the reaction coordinate. Concerted implies that both particles move in a single kinetic step but does not imply synchronous movement of the proton and electron.
Scheme 4.
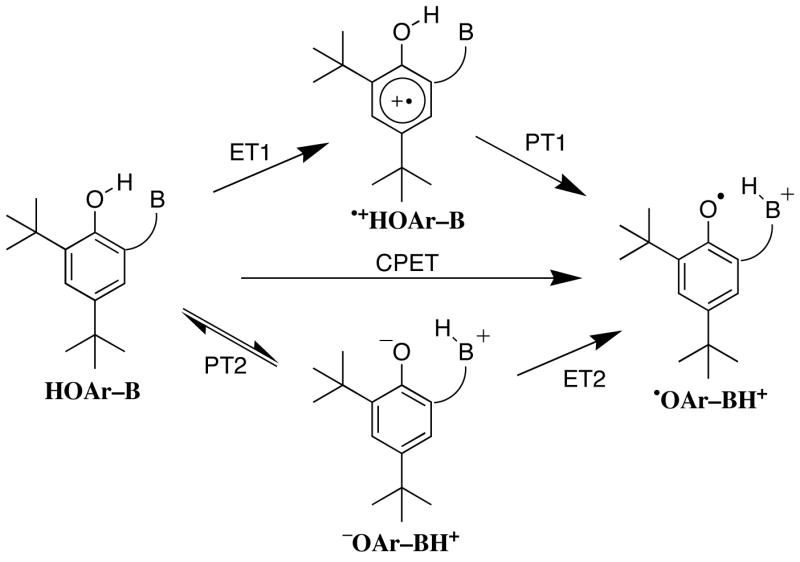
Three possible mechanisms for oxidation of phenol-base compounds.
There are three experimental markers indicating the oxidation mechanism as CPET. First, isotope effects on the oxidation of DOAr-ND2 and DOAr-py (1.6–2.8 depending on oxidant and phenol) can only be explained through CPET. In rate-limiting electron transfer (ET1), no bond is made or broken in the ET step and, like other electron transfers,64a,65 there would be only a small secondary isotope effect. The proton-first pathway PT2-ET2 would have an equilibrium PT isotope effect, which would also be small.
Second, the intermediates in the stepwise mechanisms appear to be too high in energy to be involved in the reactions. In the ET1-PT1 mechanism for HOAr-NH2 + [N(tol)3]•+, the ET1 step (eq 9) is estimated to have EET1 = −0.71 V (ΔGET1 = 16 kcal mol−1, KET1 = 10−12). This estimate
| (9) |
uses E(•+HOAr-NH2/HOAr-NH2) = 1.09 V, taken to be the same as E(tBu3PhOH+/0)53 and E(HOAr-OH+/0) and 0.11 V below E(MeOAr-NH2+/0) (as noted above, hydrogen bonding effects are likely to be small). The estimated value of ΔGET1 is significantly higher than the observed Eyring barrier for this reaction, ΔG‡ = 11 kcal mol−1 (from k = 1.1 × 10⁵ M−1 s−1 and the Eyring equation with κ = 1 ;52 with smaller prefactors or κ < 1 the discrepancy would be larger66,67). For •+HOAr-NH2 to be a viable intermediate (eq 9), our estimate of the potential would have to be in error by more than 0.2 V. (This would also predict a dependence on driving force different than what is observed, as described below). This analysis can equivalently be framed in terms of rate constants instead of barriers. The values KET1 = kET1/k–ET1 = 10−12 (see above) and kET1 = kobs = 105 M−1 s−1 would imply an impossible k–ET1 = 1017 M−l s−1, much faster than the diffusion limit in MeCN.68 Similar arguments hold for the HOAr-py and HOAr-im systems.
A more complete analysis of the ET1-PT1 pathway includes precursor and successor complexes, as illustrated for the HOAr-NH2 + [N(tol)3]•+ reaction in Scheme 5. The formation of the precursor and successor complexes are assumed to have equilibrium constants Kprecursor = Ksuccessor = 1 M−1 as is commonly done67 (no evidence for a precursor or successor complex is evident in optical spectra of reaction mixtures). The ET1 step generates the successor complex in which the proton has not transferred, [•+HOAr-NH2|Ntol3]. In the scenario most favorable to the ET1/PT1 pathway, this intermediate partitions equally between back electron transfer to the precursor complex (k-ET1) and forward proton transfer (kPT1) to [•OAr-NH3+|Ntol3], with both occurring at the fastest possible rate, ~1013 s−1. With these assumptions, kET1 would have to be 2 × 10⁵ M−1 s−1 based on the experimentally observed kobs = 1 × 10⁵ M−1 s−1 and K5 = 2 (eq 5 above). This requires KET1 for ET within the precursor complex (kET1/k-ET1) to be 2 × 10⁻⁸, more than 104 larger than the KET1 based on the estimated redox potentials (see above). And even in this best-case scenario, [•+HOAr-NH2|Ntol3] is barely an intermediate since the 1013 s−1 rate constants imply a half-life of only 35 fs, roughly one vibrational period for a 1000 cm−l mode. The reaction with [N(p-C6H4OCH3)3]•+ provides even tighter constraints because ET1 becomes an additional 0.22 V uphill (kET1 is less favorable by 5 × 10⁻³) but kobs only changes by 10−2. The constraints on KET1 are also more stringent if the back electron or proton transfers have any barrier and are slower than the maximal 1013 s−1.
Scheme 5.

Putative kinetic scheme for ET-PT involving precursor and successor complexes, assuming Kprecursor = ksuccessor= 1 M−1 and k-ET1= kPTl = 1013 s−1 as the best-case scenario.
It should be added that most recent computational and experimental reports conclude that similar intermolecularly hydrogen-bonded [PhOH|base]•+ species are not minima in the gas phase (proton transfer from O to the base proceeds without barrier).69 If this is also the case for the solution ArOH–B•+ species discussed here, they cannot by definition be intermediates.
The PT2-ET2 pathway is also very unlikely, based on thermochemical arguments similar to those above. The rate constant for PT2-ET2 is the product of the equilibrium constant for initial proton transfer (KPT2, eq 1 above) and the ET rate constant from the zwitterion (kET2, eq 10). KPT2 might be expected to be ~10−9 based on the difference in pKa of amines (~18) and phenols (~27)
| (10) |
in MeCN.38 Since this ignores potential electrostatic interactions in the zwitterion, we instead use the more conservative experimental value, KPT2 < 10−4 derived from UV-vis spectra (see above). Then the kobs > 107 M−1 s−1 for HOAr-NH2 + [N(p-C6H6Br)3]•+ implies kET2 > 1011, faster than the diffusion limit in MeCN.68 An analogous argument can be made with barrier heights and with precursor and successor complexes.
The third argument for the CPET mechanism is the dependence of barrier on driving force. For HOAr-NH2 + [NAr3]•+, a plot of ΔΔAG‡ vs. ΔΔG° has a slope 0.53 [ΔΔG° = nF(E1 − En) and ΔΔG‡ = RTln(k1/kn)]. Following the discussion above, the stepwise path with rate-limiting ET1 would require ΔG‡ET1 ≈ ΔG°ET1 and therefore that ΔΔG‡/ ΔΔG° ≅1 (ΔG° ≈ λ, in the Marcus picture; see below).67 The initial PT2 mechanism requires that ΔG‡ET2 ≈ 0 so ΔΔG‡/ ΔΔG° ≅ 0 (−ΔG° ≈ λ). As discussed in the next section, ΔΔG‡/ΔΔG° = 0.53 is close to the value of ½ predicted by Marcus theory for the concerted process in this |AG°CPET| ≪ 2λ, situation. The dependence of barrier on driving force has previously been used by Okamura et al. to discuss stepwise vs. concerted PCET pathways.20
In sum, the isotope effects, the thermochemistry, and the dependence of the rate constants on driving force are consistent only with a concerted mechanism. These conclusions are consistent with the findings of Linschitz, Hammarstrom, and Nocera who have all found CPET mechanisms for their systems, which include both aqueous and non-aqueous media.7–89
3. Analysis using Marcus Theory
From one perspective, the phenol-bases HOAr-B are simply outer-sphere electron transfer reagents, so Marcus Theory may be appropriate to analyze these reactions. However, the inner-sphere reorganizations for HOAr-B/•OAr-BH+ are unusual because they involve not only small shifts in equilibrium bond distances, as in the standard Marcus picture, but also movement of a proton across an OH••N hydrogen bond. The proton can be thought of as transferring ~0.7 Å between two minima on an adiabatic potential energy surface.70 This would not seem to fit easily into the standard Marcus model where a single parabolic surface, defined by the reorganization energy λ, describes all of the solvent and inner-sphere reorganizations. Current, more refined theoretical formulations of CPET treat the proton transfer explicitly but are more complicated and require more parameters than are readily determined experimentally.23 So despite its simplifications, the adiabatic Marcus equation is still the logical starting point because it predicts barriers and rate constants using only the two parameters λ and ΔG° (eqs 11,12).67,71
| (11) |
| (12) |
| (13) |
The kinetic and thermochemical data for HOAr-B + oxidant reactions (Table 3) can be fit by eq 12, as shown in Figure 6.72 The data sets are also well fit by straight lines; as noted above the slope ΔΔG‡/ΔΔG° for the HOAr-NH2 + [NAr3]•+ reactions is 0.53. The limited range of experimentally accessible driving forces (0.51 V) does not provide a test of the predicted parabolic dependence of log(k) on ECPET.
Figure 6.

log(k) vs. Erxn for oxidations (a) of HOAr-NH2 by [NAr3]• + (
 ) and (b) of HOAr-py by [Fe(Mexphen)3]3+ (
 ) and [Fe(R2bpy)3]3+ (
 ) and HOAr-NH2 by [Fe(Mexphen)3]3+ (
 ) and [Fe(R2bpy)3]3+ (
 ). The curves are fits to eq 12.
The reorganization energies for the oxidations of HOAr-NH2 derived from eq 12 are 34 ± 1 kcal mol−1 (1.5 eV) for the reactions with [NAr3]•+, 38 ± 2 kcal mol−1 (1.9 eV) for the reactions with [Fe(N-N)3]3+ (N-N = R2bpy, Mexphen), and 35 ± 1 kcal mol−1 (1.5 eV) from the single rate constant oxidation by 10-methylphenothiazinium (MPT•+) (Table 4). Following the additivity postulate (eq 13), each of these cross reaction values (λ12) is the average of the λ’s for the individual self-exchange reactions A+ + A → A + A+. The λ11 for N(tol)3/[N(tol)3]•+ self exchange in MeCN is 12 kcal mol−1 (0.5 eV),43 which is taken as characteristic of the series of NAr3•+ oxidants used here. λ11 for MPT•+/0 is similar (9 kcal mol−1, 0.4 eV);73 that for [Fe(bpy)3]3+/2+ in MeCN is twice as large (24 kcal mol−1 or 1.0 eV).74 Using eq 13, these values yield reorganization energies for HOAr-NH2/•OAr-NH3+ self exchange of 53 ± 3, 53 ± 4, and 58 ± 3 kcal mol−1 (2.4 ± 0.2 eV). These are the same within experimental error, which is an indication that it is appropriate to use the adiabatic Marcus equation to analyze these reactions. The single rate constant for HOAr-im + [N(p-C6H4OMe)3]•+ gives λ11 = 36 ± 3 kcal mol−1 (1.4 eV) for CPET self-exchange.
The rate constants for oxidation of HOAr-py fall on different lines for oxidants [Fe(R2bpy)3]3+ (R = H, Me) vs. [Fe(Mexphen)3]3+ (Mex = 4,7-Me2, 3,4,7,8-Me4). The λ12 values are 27 ± 1 kcal mol−1 (R2bpy oxidants) and 22 ± 1 kcal mol−1 (Mexphen oxidants). The distinction is surprising because of the similarity of these oxidants. The self-exchange rate constants for these species are similar, with the phenanthroline derivatives reacting ca. 3 times faster, although this comparison is complicated by scatter amongst the different derivatives, counter-ion and ionic strength effects, etc.50c Taking λ11 ≅ 24 and 21 kcal mol−1 for [Fe(R2bpy)3]3+/2+ and [Fe(Mexphen)3]3+/2+, respectively, yields apparent λ11 (HOAr-py) values of 30 ± 3 and 23 ± 3 kcal mol−1 for the different oxidants. These values are different, as indicated by the distinct lines in Figure 6. This discrepancy suggests a deviation from the adiabatic Marcus treatment, perhaps due to non-adiabaticity or to ion pairing issues, as will be probed in future work.75 The oxidations of HOAr-NH2 do not show such a distinction between reactions with [Fe(R2bpy)3]3+ vs. [Fe(Mexphen)3+, although there is some scatter in the rate constants (red curve of Figure 6b). Fitting these rate constants separately yields cross reaction λ12 and HOAr-NH2 self-exchange λ11 values that agree within error: [Fe(R2bpy)3]3+: λ12 = 39 ± 2, λ11 = 53 ± 4; [Fe(Mexphen)3]3+: λ12 = 37 ± 2, λ11 = 53 ± 4 kcal mol−1.
Reorganization energies can also be derived from the temperature dependence of the rate constants using equation 12.76 These are given as λ12(T) in Table 4, to distinguish them from the reorganization energies derived from the dependence on ECPET, λ12(E). The λ12(E) and λ12(T) values are the same within experimental error for the three cases where comparisons are made. This agreement, between two different kinds of analysis and involving mostly independent data sets, supports the use of the Marcus equation for these CPET reactions. Another correct prediction of the Marcus treatment is that ΔΔG‡/ΔΔG° = 0.5 + ΔG°/2λ. Using the values in Tables 3 and 4 for the five HOAr-NH2 + NAr3•+ reactions, 0.5 + λG°/2λ, ranges from 0.39 to 0.57 with an average value of 0.49. This is in good agreement with the experimental linear fit ΔΔG‡/ΔΔG° = 0.53.
The electrochemical rate constant ke1 provides an additional test of the applicability of the adiabatic Marcus treatment. While rigorous comparison of heterogeneous and homogenous electron transfer kinetics is complex, there is often a good correspondence between ke1 and the homogenous self-exchange rate constant k11 via eq 14.44a,77 Equation 14 follows from the assumption that a given reagent has similar intrinsic barriers for homogeneous and heterogeneous electron transfer. The rate constants are divided by the different collision frequencies and the self-exchange k11 appears as a square root because it involves two molecules and therefore two intrinsic barriers. K11 for HOAr-NH2 has not been directly determined, but is
| (14) |
calculated to be 8 M−1 s−1 using the adiabatic Marcus equation (eq 12) with λ11 = 55 kcal mol−1 (the average of the three experimentally derived values in Table 4). Then (k11/1011)1/2 = 9 × 10⁻⁶, a factor of 20 larger than (ke1/104) = 3 × 10⁻⁷. This is good agreement given the approximate nature of eq 14 and that the ke1 of 3 × 10⁻³ cm s−1 lies on the cusp of the conditions where eq 14 holds - according to Swaddle, only for ke1 ≤ 10−2 cm s−1.77b
The results reported here are among the first confirmations that the adiabatic Marcus equation is applicable to this class of CPET reactions, in which the proton and electron are clearly separated in the reactants or products. We and others have used Marcus Theory for CPET reactions, assuming its applicability.8,24 The tests described here are: the equivalence of the intrinsic barriers derived from the dependence on driving force, the dependence on temperature, and from different reagents, and the agreement between electrochemical and solution rate constants. It should be noted that these tests are not especially stringent, and that there is the possibility of a deviation in the difference λ’s derived for HOAr-py with the different iron oxidants, which will be explored in more detail in future work.75 Hammarstrom and co-workers have previously shown that similar λ’s are derived from driving force and temperature dependent measurements.8
The 56 kcal mol−1 (2.4 eV) reorganization energy for HOAr-NH/•OAr-NH3+ self-exchange in MeCN is a quite large value.64b,67d HOAr-NH2 is fairly close in size to N(tol)3 and has the same charge, yet the phenol-amine CPET λ11 is 4.7 times that of the triarylamine: 56 vs. 12 kcal mol−1. The 12 kcal mol−1 value for N(tol)3/[N(tol)3]•+ is typical of λ’s for outer-sphere electron transfer by aromatic organic molecules, usually ≤ 20 kcal mol−1.64b HOAr-NH2 has a much higher intrinsic barrier because ET is coupled to transfer of the proton. Hammarstrom and co-workers have reached the same conclusion in their studies, that CPET oxidations of tethered phenol and indole groups in water have much higher intrinsic barriers than the pure electron transfers from the same reagents.8 The similarities of our conclusions are striking in light of the differences in our systems, Hammarstrom measuring rate constants in water for intramolecular ET coupled to proton transfer to the bulk aqueous solution. The λ11’s for HOAr-im and HOAr-py are smaller than that of HOAr-NH2 but still larger than those for aromatic organic molecules. The significant differences in intrinsic barriers for the amino vs. the pyridyl and imidazolyl derivatives will be discussed in a future report.75
The large intrinsic barriers to CPET - indicating that it is inherently difficult - would suggest that this concerted reaction would be disfavored relative to the stepwise ET-PT mechanism. If the driving forces for the competing rate limiting steps were identical, this would indeed be the case. However, in this system E°(CPET) is substantially more favorable than E°(initial ET), which leads to the lower barrier for the CPET (Figure 7). In other words, initial pure ET or PT is disfavored because of the high energy of the intermediate that would be formed. A similar argument has been advanced by Hammarstrom et al. for aqueous CPET reactions.8
Figure 7.

Marcus potential energy surfaces for (a) CPET, with a favorable ΔG°CPET but a large λCPET; vs. (b) initial ET (to be followed by PT), with an unfavorable ΔG°ET but a smaller λET.
Extrapolation of these conclusions to a specific biological system requires caution because typically the driving forces for CPET, pure ET and pure PT are not known. The local dielectric constant and nearby protein residues can substantially affect these values (and the intrinsic barriers). When initial ET or PT are energetically competitive with CPET, as found for instance for quinone reductions in PS I, stepwise pathways are favored.20 However, the concerted mechanism likely occurs in many situations, when pure ET and pure PT are high in energy.
4. Adiabatic vs. Nonadiabatic Electron Transfer
The discussion above has utilized the adiabatic Marcus equation, but many electron transfer reactions are nonadiabatic. Current theoretical descriptions of CPET use a nonadiabatic formalism.23 In a nonadiabatic reaction, there is a low probability of crossing from the reactant to product diabatic surfaces when the system reaches the transition structure (transmission coefficient κ « 1). In adiabatic reactions, the system is well described by a ground state potential energy surface with κ ~ 1. The matrix element Hrp is a measure of this coupling and appears in the pre-exponential of the nonadiabatic Marcus equation (eq 15). Values of Hrp less than ~200 cm−1 (~kBT) normally indicate a nonadiabatic reaction.78
| (15) |
Hrp is best determined through measurements in the region where −ΔG° ≅ λ, but such measurements are not possible with this system. An alternative though problematic approach fits k as a function of T to eq 15 to obtain Hrp and the nonadiabatic reorganization energy λ12(nonad).72 This analysis requires the assumption that the equilibrium constants for forming the precursor complexes KP are 1 at all temperatures, in the absence of electrostatic work (note ΔG° has been found to be roughly constant with temperature). The apparent values for Hrp, 10 ± 4,6 ± 2, and 4 ± 3 cm−1 and λ12(nonad) are given in Table 4. These Hrp values would normally indicate a nonadiabatic reaction. However, KP is likely to be smaller than 1 (two standard estimating approaches give KP ≅ 0.8664e and 0.0279) and is likely to have a temperature dependence, becoming smaller at higher temperatures due to an unfavorable entropy. Including either KP < 1 or such a temperature dependence would increase the value of Hrp. Thus the apparent Hrp values calculated from eq 15 with KP = 1 are lower limits.80 For instance, if the entropy of forming the precursor complex ΔS°P were −10 cal K−1 mol−1 and KP = 0.02 at 298 K, the derived Hrp would be 130 cm−1.81
In sum, the CPET reactions described here appear to be at most mildly nonadiabatic. The slowness of the electron transfer reactions of HOAr-NH2 are not due to substantial nonadiabatic character but rather to large reorganization energies. For example, HOAr-NH2 + [N(tol)3]•+ is ~105 slower than [N(tol)3]•+/0 self-exchange, both of which have ΔG° ≅ 0. This is because λ12 for HOAr-NH2 + [N(tol)3]•+ is substantially larger than the λ11 of 12 kcal mol−1 for N(tol)3•+/0 self exchange,43 whether one uses the adiabatic λ12 = 34 kcal mol−1 (from eq 12), or the nonadiabatic λ12[nonad] = 30 kcal mol−1 (from eq 15 with KP = 1). HOAr-py and HOAr-im have intrinsic barriers that are also large but are smaller than that for HOAr-NH2. The origin of these barriers and the differences among these structurally similar phenol-bases will be discussed in a future publication.75
Conclusions
One-electron oxidation of phenols hydrogen-bonded to a pendant base, HOAr-B, yield radical cations in which the phenolic proton has transferred to the base, •OAr-BH+. Three cases are reported here, with amino, pyridyl, and imidazolyl bases. These systems serve as models for hydrogen-bonded tyrosine residues in proteins, and more generally as an archetype for a class of coupled proton-electron transfer (CPET) reactions where the electron and proton travel to different sites. The redox potentials of these phenols are lower than those of simple phenols reflecting the favorable transfer of the proton to the hydrogen-bonded base.
Reactions of HOAr-B with [NAr3]•+ or [Fe(N-N)3]3+ oxidants in MeCN follow simple bimolecular kinetics. The mechanism of oxidation involves concerted transfer of the proton and electron (CPET). Three arguments rule out the alternative step wise mechanisms of initial proton and subsequent electron transfer, or initial electron and subsequent proton transfer. First, the primary kinetic isotope effects (1.6 – 2.8) are inconsistent with the stepwise pathways. Second, the rates of oxidation are too fast to involve the high energy intermediates of the stepwise pathways (the observed barriers are lower than the estimated free energies of [−OAr-BH+] and [•+HOAr-B]). Third, the dependence of the rate on driving force for reaction of HOAr-NH2 + [NAr3]•+, ΔΔG‡/ΔΔG°= 0.53, is consistent only with the |ΔG°| « 2λ, situation found for CPET. Based on this work and related model systems,7–9 CPET is likely a common (albeit underappreciated) mechanism for phenol oxidations. It is favored when the phenol is hydrogen-bonded to a base and when the intermediates in the stepwise paths are high in energy. These conditions probably occur often in biological systems, although the local protein environment can have a substantial influence on the relevant energetics.
The CPET reactions are in general well described by the adiabatic Marcus equation (eq 12). Fitting the variation in k with ECPET for a series of oxidants yields self-exchange reorganization energies λ11 = 56 ± 3,27 ± 4, and 36 ± 3 kcal mol−1 for HOAr-NH/•OAr-NH3+, HOAr-py/•OAr-pyH+, and HOAr-im/•OAr-imH+. For HOAr-NH2, the same λ11 is found for three different oxidants, as required by the Marcus treatment. For each of the phenols, the temperature dependence of the rate constants gives the same λ11 as found from k vs. ECPET. The ΔΔG‡CPET/ΔΔG°CPET = 0.53 for HOAr-NH2 + [NAr3]•+ reactions is very close to the value of ½ predicted by the Marcus equation for this |ΔG°CPET| « 2λ case. The electrochemical rate constant for HOAr-NH2 correlates well with the calculated HOAr-NH2 self-exchange rate constant. These results support the use of simple Marcus Theory for such CPET systems, although these are not particularly stringent tests. A deviation from the adiabatic Marcus equation may have been observed in the different λ11 values obtained for oxidations of HOAr-py with [Fe(R2bpy)3]3+ (27 ± 3) vs. [Fe(Mexphen)3]3+ (23 ± 3 kcal mol−1).
The CPET rate constants are slower than pure ET reactions of comparable organic reagents, especially for HOAr-NH2. This is a result of the large intrinsic barriers for CPET. A small part of this rate difference could be that the CPET reactions are more nonadiabatic but the data do not support highly nonadiabatic CPET. The 27 – 56 kcal mol−1 adiabatic reorganization energies for these reactions are significantly larger than typical λ’s for ET reactions of aromatic organic compounds. For instance, [N(tol)3]•+/0 self exchange has λ11 = 12 kcal mol−1.43 The pyridyl and imidazolyl compounds have significantly lower intrinsic barriers than the amino derivative. Future work will probe the origins of these barriers and the differences among the different phenols.75
Experimental
General
Unless otherwise noted, reagents were purchased from the Aldrich, solvents from Fischer, and deuterated solvents from Cambridge Isotope. MeCN was used as obtained from Burdick and Jackson (low-water brand) and stored in an argon-pressurized stainless steel drum plumbed directly into a glove box. nBu4NPF6 was recrystallized three times from EtOH and dried in vacuo for two days at 110° C prior to use. 1H NMR and 13C NMR spectra were recorded on Bruker AF300, AV300, AV301, DRX499 or AV500 spectrometers at ambient temperatures; chemical shifts are reported relative to TMS in ppm by referencing to the residual solvent signals. The UV-vis spectra were obtained on a Hewlett Packard 8453 diode array spectrophotometer and are reported as λmax in nm (ε, M−1 cm−1), except for the long pathlength spectrum that was obtained on a CARY-500 instrument. The EPR spectrum was recorded on a Bruker EPX CW-EPR spectrometer operating at X-band frequency at room temperature.
The synthesis of HOAr-NH2, equilibration experiments, crystallographic data and the EPR spectrum of •OAr-NH3+ are given in the Supporting Information of this paper and of reference 24. Preparation of MeOAr-NH2 followed the procedure in Scheme 2 starting from the methyl-bromoaryl ether C6H2(OMe)(2-Br)(4,6-tBu2) (see Supporting Information). HOAr-im was prepared as described by Benisvy30 by the condensation reaction: aldehyde + ammonium acetate + 4,4′-dimethoxybenzil. The preparation of HOAr-py used the Ni(dppe)2 coupling of the phenol-derived Grignard and 2-bromopyridine described by Fujita31 except with a BBr3 deprotection of the methyl ether.82
Electrochemistry
Cyclic voltammograms were taken on an E2 Epsilon electrochemical analyzer (Bioanalytical Systems) at ca. 5 mM substrate in anaerobic 0.1 M nBu4NPF6 acetonitrile solution, unless otherwise specified. The electrodes were as follows: working, platinum disc (unless noted otherwise); auxiliary, platinum wire; and reference, Ag/AgNO3 (0.01 M) in electrolyte solution. All potentials are reported vs. a Cp2Fe+/0 internal standard. Errors are estimated to be ±0.02V. Representative CVs are included as Figure S17 of the Supporting Information.
For cyclic voltammetry at elevated and depressed temperatures a single solution was used for each analyte. Typically the electrochemical cell was prepared and degassed and CVs were collected yielding E½ vs Ag/AgNO3. The entire cell was then placed in a warm water bath and allowed to come to thermal equilibrium before CVs were collected. This process was repeated using an ice bath. The cell was allowed to return to ambient temperature and a final series of CVs were collected, in all cases, the E½ was found to be within 5 mV of the initial room temperature measurements. Lastly, ferrocene was added as an internal standard and another CV was obtained. The potential of ferrocene vs Ag/AgNO3 was found to vary by less than 5 mV over the temperatures studied so room temperature Cp2Fe+/0 was used as a reference for all of the CVs. A glassy carbon working electrode (φ = 3 mm) was used for HOAr-NH2 and HOAr-py in these experiments. The driving force for the HOAr-NH2 + [N(tol)3]+• and HOAr-py + [Fe(Me2-bpy)3]3+ reactions were taken as the difference of E1/2(oxidant) – E1/2(HOAr-B), see Table S21 in Supporting Information.
In the determination of the heterogeneous ke1 for HOAr-NH2, the platinum disk working electrode (φ = 1.6 mm) was polished before each scan with commercial alumina solution and rinsed with water, dilute HNO3 (aq), ethanol, and acetonitrile before use. The uncompensated resistance Ru of the electrochemical cell was measured at each experiment, and was found to be on the order of 500 Ω which is expected to have a negligible effect on the measured potential E (< 5 mV). Simulated CVs were produced with DigiSim® version 3.0346 using the experimentally measured values for E0,Eint,Erev,Eend, ν, electrode area (planar), DO, DR, and ke1. The mechanism model used was: B + e− → A. The parameter a was taken to be 0.5.45
Kinetics
Kinetics experiments were performed on an OLIS RSM-1000 stopped-flow in anaerobic MeCN. The data were analyzed with SpecFit™ global analysis software.51 Kinetics were fit to pseudo-first order, second order, or opposing second order kinetics as appropriate. To determine the isotope effects, solutions were prepared with a large excess of benchtop CH3OD (1% v/v for HOAr-NH2 or 0.5% v/v for HOAr-py). Control experiments showed that aerobic addition of an equivalent amount of CH3OH to MeCN solutions did not affect the rate. The isotope effects were corrected for the OH content in the CH3OD (determined via 1H NMR), 7% for the experiments with DOAr-ND2 and 4% for those with DOAr-py. Rate constants and data analyses are in the Supporting Information of this paper and of reference 24.
X-ray crystallographic data and experimental descriptions are in the Supporting Information.
Supplementary Material
Supporting Information Available: Syntheses and cyclic voltammograms, and kinetic, chronoamperometry, and X-ray crystallographic data. This material is available free of charge at http://pubs.acs.org.
Acknowledgments
We gratefully acknowledge support from the U.S. National Institutes of Health (grant 2 R01 GM50422). Special thanks to Prof. Arnold Rheingold for crystallographic assistance with the HOAr-py crystal structure.
References
- 1.Cukier RI, Nocera DG. Annu Rev Phys Chem. 1998;49:337–369. doi: 10.1146/annurev.physchem.49.1.337. [DOI] [PubMed] [Google Scholar]
- 2.Mayer JM. Annu Rev Phys Chem. 2004;55:363–390. doi: 10.1146/annurev.physchem.55.091602.094446. [DOI] [PubMed] [Google Scholar]
- 3.For an example, see Chen K, Hirst J, Camba R, Bonagura CA, Stout CD, Burgess BK, Armstrong FA. Nature. 2000;405:814–817. doi: 10.1038/35015610.
- 4.Costentin C, Evans DH, Robert M, Savéant J-M, Singh PS. J Am Chem Soc. 2005;127:12490–12491. doi: 10.1021/ja053911n. [DOI] [PubMed] [Google Scholar]
- 5.The term PCET has been variously used to refer to all processes involving transfers of H+ and e−, specificially only to concerted processes, or to proton-coupled electron transfers that are not HAT. We support the recent suggestion4 that CPET be used to specifically refer to concerted processes.
- 6.(a) Kochi JK. Free Radicals. Wiley; New York: 1973. [Google Scholar]; (b) Mayer JM. Acc Chem Res. 1998;31:441–450. [Google Scholar]
- 7.(a) Biczók L, Gupta N, Linschitz H. J Am Chem Soc. 1997;119:12601. [Google Scholar]; (b) Gupta N, Linschitz H. J Am Chem Soc. 1997;119:6384. [Google Scholar]
- 8.(a) Magnuson A, Berglund H, Korall P, Hammarström L, Åkermark B, Styring S, Sun L. J Am Chem Soc. 1997;119:10720–5. [Google Scholar]; (b) Sjodin M, Styring S, Åkermark B, Sun L, Hammarstrom L. J Am Chem Soc. 2000;122:3932–3936. [Google Scholar]; (c) Sjödin M, Styring S, Wolpher H, Xu Y, Sun L, Hammarström L. J Am Chem Soc. 2005;127:3855–3863. doi: 10.1021/ja044395o. [DOI] [PubMed] [Google Scholar]; (d) Sjödin M, Ghanem R, Polivka T, Pan J, Styring S, Sun L, Sundström V, Hammarström L. Phys Chem Chem Phys. 2004;6:4851–4858. [Google Scholar]
- 9.Reece SY, Nocera DG. J Am Chem Soc. 2005;127:9448–9458. doi: 10.1021/ja0510360. [DOI] [PubMed] [Google Scholar]
- 10.(a) Shukla D, Young RH, Farid S. J Phys Chem A. 2004;108:10386–10394. [Google Scholar]; (b) Turro C, Chang CK, Leroi GE, Cukier RL, Nocera DG. J Am Chem Soc. 1992;114:4013. [Google Scholar]; (c) Chang MCY, Yee CS, Nocera DG, Stubbe J. J Am Chem Soc. 2004;126:16702–16703. doi: 10.1021/ja044124d. [DOI] [PubMed] [Google Scholar]; (d) Lehmann MW, Evans DH. J Phys Chem B. 2001;105:8877–8884. [Google Scholar]; (e) Mayer JM, Hrovat D, Thomas JL, Borden WT. J Am Chem Soc. 2002;124:11142–11147. doi: 10.1021/ja012732c. [DOI] [PubMed] [Google Scholar]; (f) Anglada JM. J Am Chem Soc. 2004;126:9809–9820. doi: 10.1021/ja0481169. [DOI] [PubMed] [Google Scholar]; (g) Weatherly SC, Yang IV, Armistead PA, Thorp HH. J Am Chem Soc J Phys Chem B. 2003;107:372–378. [Google Scholar]; (h) Stubbe J, Nocera DG, Yee CS, Chang MCY. Chem Rev. 2003;103:2167–2201. doi: 10.1021/cr020421u. [DOI] [PubMed] [Google Scholar]; (i) DiLabio GA, Ingold KU. J Am Chem Soc. 2005;727:6693–6699. doi: 10.1021/ja0500409. [DOI] [PubMed] [Google Scholar]; G) Huynh MHV, Meyer TJ. Proc Natl Acad Sci USA. 2004;101:13138–13141. doi: 10.1073/pnas.0405086101. [DOI] [PMC free article] [PubMed] [Google Scholar]; (k) Meyer TJ, Huynh MHV. Inorg Chem. 2003;42:8140–8160. doi: 10.1021/ic020731v. [DOI] [PubMed] [Google Scholar]
- 11.(a) Kojima T, Sakamoto T, Matsuda Y, Ohkubo K, Fukuzumi S. Angew Chem, Int Ed. 2003;42:4951. doi: 10.1002/anie.200352111. [DOI] [PubMed] [Google Scholar]; (d) Haddox RM, Finklea HO. J Electroanal Chem. 2003;351:550–557. [Google Scholar]
- 12.(a) Stubbe J, van der Donk WA. Chem Rev. 1998;98:705–762. doi: 10.1021/cr9400875. [DOI] [PubMed] [Google Scholar]; (b) Pesavento RP, van der Donk WA. Adv Protein Chem. 2001;58:317–385. doi: 10.1016/s0065-3233(01)58008-0. [DOI] [PubMed] [Google Scholar]
- 13.(a) Ehrenberg A, Reichard P. J Biol Chem. 1972;247:3485–8. [PubMed] [Google Scholar]; (b) Sjöberg BM, Reichard P, Gräslund A, Ehrenberg A. J Biol Chem. 1978;253:6863–5. [PubMed] [Google Scholar]; (c) Sahlin M, Gräslund A, Ehrenberg A, Sjöberg BM. J Biol Chem. 1982;257:366–9. [PubMed] [Google Scholar]; (d) Griepenburg U, Lassmann G, Auling G. Free Rod Res. 1996;26:473–81. doi: 10.3109/10715769609088046. [DOI] [PubMed] [Google Scholar]
- 14.(a) Barry BA, El-Deeb MK, Sandusky PO, Babcock G. J Biol Chem. 1990;265:20139–43. [PubMed] [Google Scholar]; (b) Barry BA, Babcock GT. Proc Natl Acad Sci USA. 1987;84:7099–103. doi: 10.1073/pnas.84.20.7099. [DOI] [PMC free article] [PubMed] [Google Scholar]
- 15.(a) Tsai AL, Kulmacz RJ, Palmer G. J Biol Chem. 1995;270:10503–8. doi: 10.1074/jbc.270.18.10503. [DOI] [PubMed] [Google Scholar]; (b) Tsai AL, Palmer G, Kulmacz RJ. J Biol Chem. 1992;276:17753–9. [PubMed] [Google Scholar]; (c) Tsai AL, Palmer G, Xiao G, Swinney DC, Kulmacz RJ. J Biol Chem. 1998;273:3888. doi: 10.1074/jbc.273.7.3888. [DOI] [PubMed] [Google Scholar]; (d) Hsi LC, Hoganson CW, Babcock GT, Smith WL. Biochem Biophys Res Commun. 1994;202:1592–8. doi: 10.1006/bbrc.1994.2114. [DOI] [PubMed] [Google Scholar]
- 16.(a) Ferguson-Miller S, Babcock GT. Chem Rev. 1996;96:2889–907. doi: 10.1021/cr950051s. [DOI] [PubMed] [Google Scholar]; (b) Gamelin DR, Randall DW, Hay MT, Houser RP, Mulder TC, Canters GW, de Vries S, Tolman WB, Lu Y, Solomon EI. J Am Chem Soc. 1998;720:5246–63. and references therein. [Google Scholar]; (c) Proshlyakakov DA, Pressler MA, DeMaso C, Leykam JF, DeWitt DL, Babcock GT. Science. 2000;290:1588–1591. doi: 10.1126/science.290.5496.1588. [DOI] [PubMed] [Google Scholar]
- 17.Whittaker MM, Whittaker JW. J Biol Chem. 1990;265:9610–3. [PubMed] [Google Scholar]
- 18.(a) Janes SM, Mu D, Wemmer D, Smith AJ, Kaur S, Maltby D, Burlingame AL, Klinman JP. Science. 1990;248:981–7. doi: 10.1126/science.2111581. [DOI] [PubMed] [Google Scholar]; (b) Janes SM, Palcic MM, Seaman CH, Smith AJ, Brown DE, Dooley DM, Mure M, Klinman JP. Biochemistry. 1992;31:12147–54. doi: 10.1021/bi00163a025. [DOI] [PubMed] [Google Scholar]; (c) Cooper RA, Knowles PR, Brown DE, McGuirl MA, Dooley DM. Biochem J. 1992;288:337–340. doi: 10.1042/bj2880337. [DOI] [PMC free article] [PubMed] [Google Scholar]; (d) Brown DE, McGuirl MA, Dooley DM, Janes SM, Mu D, Klinman JP. J Biol Chem. 1991;266:49–4051. [PubMed] [Google Scholar]; (e) Mu D, Janes SM, Smith AJ, Brown DE, Dooley DM, Klinman JP. J Biol Chem. 1992;267:7979–82. [PubMed] [Google Scholar]
- 19.(a) Tommos C, Babcock GT. Biochim Biophys Acta. 2000;1458:199–219. doi: 10.1016/s0005-2728(00)00069-4. [DOI] [PubMed] [Google Scholar]; (b) Vrettos JS, Limburg J, Brudvig GW. Biochim Biophys Acta. 2001;1503:229–45. doi: 10.1016/s0005-2728(00)00214-0. [DOI] [PubMed] [Google Scholar]; (c) Renger G. Biochim Biophys Acta. 2004;1655:195–204. doi: 10.1016/j.bbabio.2003.07.007. [DOI] [PubMed] [Google Scholar]; (d) Rappaport F, Lavergne J. Biochim Biophys Acta. 2001;1503:246–259. doi: 10.1016/s0005-2728(00)00228-0. [DOI] [PubMed] [Google Scholar]; (e) Nugent JHA, Rich AM, Evans MCW. ibid. :138–146. [Google Scholar]; (f) Kuhne H, Brudvig GW. J Phys Chem B. 2002;106:8189–8196. [Google Scholar]; (g) Faller P, Goussias C, Rutherford AW, Un S. Proc Natl Acad Sci USA. 2003;100:8732–8735. doi: 10.1073/pnas.1530926100. [DOI] [PMC free article] [PubMed] [Google Scholar]; (h) Ferreira KN, Iverson TM, Maghlaoui K, Barber J, Iwata S. Science. 2004;303:1831–1838. doi: 10.1126/science.1093087. [DOI] [PubMed] [Google Scholar]; (i) Zouni A, Witt HT, Kern J, Fromme P, Krauß N, Saenger W, Orth P. Nature. 2001;409:739–43. doi: 10.1038/35055589. [DOI] [PubMed] [Google Scholar]; (j) Rhee K-H, Morris EP, Barber J, Kuhlbrandt W. Nature. 1998;396:283–6. doi: 10.1038/24421. [DOI] [PubMed] [Google Scholar]; (k) Haumann M, Mulkidjanian A, Junge W. Biochemistry. 1999;38:1258–1267. doi: 10.1021/bi981557i. [DOI] [PubMed] [Google Scholar]; (l) Kálmán L, LoBrutto R, Allen JP, Williams JC. Nature. 1999;402:696–9. [Google Scholar]; (m) Petrouleas V, Koulougliotis D, lonnidis N. Biochemistry. 2005;44:6723–6728. doi: 10.1021/bi0503201. [DOI] [PubMed] [Google Scholar]
- 20.Graige MS, Paddock ML, Bruce JM, Feher G, Okamura MY. J Am Chem Soc. 1996;118:9005–9016. [Google Scholar]
- 21.(a) Page CC, Moser CC, Chen C, Dutton L. Nature. 1999;402:47–5217. doi: 10.1038/46972. [DOI] [PubMed] [Google Scholar]; (b) Barbara PF, Meyer JT, Ratner MA. J Phys Chem. 1996;100:13148–68. [Google Scholar]
- 22.Roth JP, Yoder JC, Won TJ, Mayer JM. Science. 2001;294:2524–2526. doi: 10.1126/science.1066130. [DOI] [PubMed] [Google Scholar]
- 23.Swalina C, Pak MV, Hammes-Schiffer S. Chem Phys Lett. 2005;404:394–399. doi: 10.1063/1.1940634.Hammes-Schiffer S, Iordanova N. Biochim Biophys Acta. 2004;1655:29–36. doi: 10.1016/j.bbabio.2003.07.009.Hammes-Schiffer S. Acc Chem Res. 2001;34:273–281. doi: 10.1021/ar9901117.Hammes-Schiffer S. ChemPhysChem. 2002:33–42. doi: 10.1002/1439-7641(20020118)3:1<33::AID-CPHC33>3.0.CO;2-6.Cukier RI. J Phys Chem B. 2002;106:1746–1757.Georgievskii Y, Stuchebrukhov AA. J Chem Phys. 2000;113:10438–10450.Kuznetsov AM, Ulstrup J. Can J Chem. 1999;77:1085–1096.Krishtalik LI. Biochim Biophys Acta. 2000;1458:6–27. doi: 10.1016/s0005-2728(00)00057-8.(i) References 4 and 5
- 24.Rhile IJ, Mayer JM. J Am Chem Soc. 2004;126:12718–12719. doi: 10.1021/ja031583q. [DOI] [PubMed] [Google Scholar]
- 25.(a) Talley JJ, Evans IA. J Org Chem. 1984;49:5267–5269. [Google Scholar]; (b) Gomberg N, Nishida D. J Chem Soc. 1922:190–207. [Google Scholar]; (c) Mandell L, Piper JV, Pesterfield CE. J Org Chem. 1963;28:574–575. [Google Scholar]
- 26.Altwicker ER. Chem Rev. 1967;67:475–531. [Google Scholar]
- 27.Maki T, Araki Y, Ishida Y, Onomura O, Matsumura Y. J Am Chem Soc. 2001;723:3371–3372. doi: 10.1021/ja002453+. [DOI] [PubMed] [Google Scholar]
- 28.Tramontini M, Angiolini L. Tetrahedron. 1990;46:1791–1837.Gevorgyan GA, Agababyan AG, Mndzhoyan OL. Usp Khim. 1984;53:971–1013.Tramontini M. Synthesis. 1973:703–775.House HO. Modern Synthetic Reactions. 2. W. A. Benjamin; New York: 1972. p. 654. (e) See also references 33a and 39.
- 29.Sparfel D, Baranne-Lafont J, Cuong NK, Capdevielle P, Maumy M. Tetrahedron. 1990;46:803–814. [Google Scholar]
- 30.(a) Benisvy L, Bill E, Blake AJ, Collison D, Davies ES, Garner CD, Guindy CI, McInnes EJL, McArdle G, McMaster J, Wilson C, Wolowska J. Dalton Trans. 2004:3647–3653. doi: 10.1039/b410934a. [DOI] [PubMed] [Google Scholar]; (b) Benisvy L, Bittl R, Bothe E, Garner CD, McMaster J, Ross S, Teutloff C, Neese F. Angew Chem, Int Ed. 2005;44:5314–5317. doi: 10.1002/anie.200501132. [DOI] [PubMed] [Google Scholar]
- 31.Inoue Y, Nakano T, Tanaka H, Kashiwa N, Fujita T. Chem Lett. 2001:1060–1061. [Google Scholar]
- 32.(a) Stolow A. Annu Rev Phys Chem. 2003;54:89–119. doi: 10.1146/annurev.physchem.54.011002.103809. [DOI] [PubMed] [Google Scholar]; (b) LeGourrierec D, Kharlanov V, Brown RG, Rettig WJ. Photochem Photobiol A. 1998;117:209–216. [Google Scholar]; (c) Braeuer M, Mosquera M, Perez-Lustres JL, Rodriguez-Prieto F. J Phys Chem A. 1998;102:10736–10745. [Google Scholar]
- 33.Mannich bases, the range of O--N distances across the hydrogen bond is 2.56–2.71 Å: Koll A, Wolschann P. Monatsh Chem. 1996;127:475–486. Imidazoles, 2.55–2.60 Å: Foces-Foces C, Llames-Saiz AL, Claramunt RM, Cabildo P, Elguero J. J Mol Str. 1998;440:193–202.Benisvy L, Blake AJ, Collison D, Davies ES, Garner CD, Mclnnes EJL, McMaster J, Whittaker G, Wilson C. J Chem Soc, Dalton Trans. 2003:1975–1985.Pyridines, 2.54 – 2.56 Å: Shu Wenmaio, Valiyaveettil S. Chem Commun. 2002:1350–1351.Kaczmarek L, Balicki R, Lipowski J, Borowicz P, Grabowska A. J Chem Soc Perkins Trans 2. 1994:1603–1610.(d) Most Mannich bases HOAr-CH2NR2 are non-planar due to steric pressure from the R groups.33a–d,75
- 34.(a) Pimental GC, McClellan AL. The Hydrogen Bond. Freeman; New York: 1960. [Google Scholar]; (b) Frey PA. Magnetic Resonance in Chemistry. 2001;39:S190–S198. [Google Scholar]; (c) Gilli P, Bertolasi V, Gilli G. J Am Chem Soc. 2000;122:10405–10417. [Google Scholar]
- 35.Silverstein RM, Bassler GC, Morrill TC. Spectrometric Identification of Organic Compounds. 5. Wiley; New York: 1991. (a) p 184; (b) pp 306–311. [Google Scholar]
- 36.Rozwadowski Z, Majeewski E, Dziembowska T, Hansen P. J Chem Soc, Perkin Trans 2. 1999:2809–2817. [Google Scholar]
- 37.Gilli G, Belluci F, Ferretti V, Bertolasi V. J Am Chem Soc. 1989;111:1023–1028. [Google Scholar]
- 38.Izutsu K. Acid-Base Dissociation Constants in Dipolar Aprotic Solvents, IUPAC Chemical Data Series No. 35. Blackwell Scientific Publications; Boston, MA: 1990. pp. 17–35.The pKa2 of succinic acid in MeCN is 29.0.
- 39.(a) Koll A, Wolschann P. Monatsh Chem. 1999;130:983–1001. [Google Scholar]; (b) Przeslawska M, Koll A, Witanowski M. J Phys Org Chem. 1999;12:486–492. [Google Scholar]; (c) Teitelbaum AB, Derstuganova KA, Shishkina NA, Kudryavtseva LA, Bel’skii VE, Ivanov BE. Bull Acad Sci USSR, Div Chem Sci (Engl Transl) 1980:558–562. [Google Scholar]; Izv Akad Nauk SSSR, Ser Khim. 1980:803–808. [Google Scholar]
- 40.Król-Starzomska I, Filarowski A, Rospenk M, Koll A. J Phys Chem A. 2004;108:2131–2138. doi: 10.1021/jp0445977. states that zwitterionic o-hydroxy Schiff bases have 385 nm < λmax < 430 nm. Popp G. J Org Chem. 1972;37:3058–3062.Lapachev V, Stekhova S, Mamaev V. Monatsh Chem. 1987;118:669–670.
- 41.Woon TC, Dicken CM, Bruice TC. J Am Chem Soc. 1986;108:7990–7995.Pokhedenko VD, Khizhny VA, Koshechko VG, Samarskii VA. Theor Exp Chem (Engl Trans) 1975;11:489–493.Teor Eksper Khim. 1975;11:579–584. report tBu3ArO• λmax (nm, MeCN) = 316, 628 nm (but no ε’s)
- 42.(a) Xie C, Lahti PM. Tetrahedron Lett. 1999;40:4305–4308. [Google Scholar]; (b) Xie C, Lahti PM, George C. Org, Lett. 2000;2:3417–3420. doi: 10.1021/ol0063407. [DOI] [PubMed] [Google Scholar]
- 43.Sorensen SP, Bruning WH. J Am Chem Soc. 1973;95:2445–2451. [Google Scholar]
- 44.(a) Swaddle TW. Chem Rev. 2005;105:2573–2608. doi: 10.1021/cr030727g. [DOI] [PubMed] [Google Scholar]; (b) Bard AJ, Faulkner LR. Electrochemical Methods: Fundamentals and Applications. 2. John Wiley and Sons Inc; New York: 2001. [Google Scholar]
- 45.The value of ψ is nearly independent of α (0.3 < α < 0.7) (Nicholson RS. Anal Chem. 1965;37:1351. When ipc/ipa = 1, as is the case here, the value of α is typically close to 0.5. Simulated CV’s using α = 0.4, 0.5 and 0.6 showed no significant difference.
- 46.DigiSim™ software is a product of Bioanalytical Systems, Inc.: http://www.bioanalytical.com/products/ec/digisim/index.html
- 47.(a) Thomas F, Jarjayes O, Jamet H, Hamman S, Saint-Aman E, Duboc C, Pierre J-L. Angew Chem. 2004;116:604–7. doi: 10.1002/anie.200352368. [DOI] [PubMed] [Google Scholar]; Angew Chem Int Ed. 2004;43:594–7. [Google Scholar]; (b) Rhile IJ, Mayer JM. Angew Chem. 2005;105:1624–1625. doi: 10.1002/anie.200461977. [DOI] [PubMed] [Google Scholar]; Angew Chem Int Ed. 2005;44:1598–1599. doi: 10.1002/anie.200461977. [DOI] [PubMed] [Google Scholar]
- 48.Bordwell FG, Cheng JP. J Am Chem Soc. 1991;113:1736–1743.cf., Williams LL, Webster RD. J Am Chem Soc. 2004;126:12441–12450. doi: 10.1021/ja046648j. For aqueous electrochemistry, see: Li C, Hoffman MZ. J Phys Chem B. 1999;103:6653–6656.
- 49.See the Supporting Information of reference 24.
- 50.(a) Noel M, Vasu KI. Cyclic Voltammetry and the Frontiers of Electrochemistry. Aspect; London: 1990. pp. 141–143. [Google Scholar]; (b) Braga TG, Wahl AC. J Phys Chem. 1985;89:5822–5828. [Google Scholar]; (c) Chan MS, Wahl AC. J Phys Chem. 1978;82:2542–2549. [Google Scholar]
- 51.Binstead RA, Zuberbuhler AD, Jung B. Specfit ™, version 3.0.36 (32-bit Windows) Spectrum Software Associates; Chapel Hill, NC: 2004. [Google Scholar]
- 52.Eyring equation: k = κ(kBT/h)exp[(TΔS‡ -ΔH‡)/RT]; κ is assumed to be 1.
- 53.(a) From ref. 48a: E(2,4,6-tBu3ArOH) = 1.85 V in MeCN vs. Ag/AgI in MeCN and EAg/Ag+ = ESCE + 0.365 V. Using EFc/Fc+ = ESCE – 0.40 V (ref 53b), the potential for tBu3ArOH in MeCN is 1.09 V vs. Cp2Fe+/0. Connelly NG, Geiger WE. Chem Rev. 1996;96:877–910. doi: 10.1021/cr940053x.
- 54.March J. Advanced Organic Chemistry. 4. Wiley; New York: 1992. p. 76. [Google Scholar]
- 55.Kanamori D, Furukawa A, Okamura T, Yamamoto H, Ueyama N. Org Biomol Chem. 2005;3:1453–1459. doi: 10.1039/b419361j. [DOI] [PubMed] [Google Scholar]
- 56.For sterically encumbered phenols such as tBu3ArOH, hydrogen bonding to solvent is a small effect. For instance, 2,6-di-t-butyl-4-methylphenol (BHT) is only 14% hydrogen bonded in MeCN: Wren JJ, Lenthen PM. J Chem Soc. 1961:2557–2560.
- 57.Sjödin M, Styring S, Åkermark B, Sun L, Hammarström L. Phil Trans R Soc London B. 2002;357:1471–1479. doi: 10.1098/rstb.2002.1142. [DOI] [PMC free article] [PubMed] [Google Scholar]
- 58.Lucarini M, Pedulli GF, Guerra M. Chem Eur J. 2004;10:933–939. doi: 10.1002/chem.200305311.Lucarini M, Mugnaini V, Pedulli GF, Guerra M. J Am Chem Soc. 2003;125:8318–8329. doi: 10.1021/ja034963k.Amorati R, Lucarini M, Mugnaini V, Pedulli GF. J Org Chem. 2003;68:5198–5204. doi: 10.1021/jo0342931. DFT calculations suggest an H-bond strengthening of 8.6 kcal mol−1 for 4-methoxy-l,8-naphthalenediol but experimental results indicate that this is overestimated by as much as 2 kcal mol−1. Foti MC, Barclay LRC, Ingold KU. J Am Chem Soc. 2002;124:12881–12888. doi: 10.1021/ja020757l.
- 59.Hydrogen bond strengths have been shown to increase with decreasing difference in pKa of the hydrogen bond donor and acceptor (ΔpKa: Shan SO, Herschlag D. Proc Natl Sci USA. 1996;93:14474–14479. doi: 10.1073/pnas.93.25.14474. This value is smaller in the phenol-amine (pKa(phenol) - PKa(amine) ≈ 27 - 17 = 10, vs. the radical cation pKa(phOH+) ~ pKa(amine) ≈ 17 - 0 = 17. The case is opposite for HOAr-py, where the relevant pKa’s are 27 (PhOH), 12 (pyridine), and 0 (PhOH+) (MeCN pKa data from refs. 38 and 60).
- 60.(a) Reference 48a. The difference between the phenol pKa values in DMSO and MeCN is taken as 9.5 units following Chantooni MK, Jr, Kolthoff IM. J Phys Chem. 1976;80:1306–1310.
- 61.(a) Brede O, Hermann R, Karakostas N, Naumov S. Phys Chem Chem Phys. 2004;6:5184–5188. [Google Scholar]; (b) Ganapathi MR, Hermann R, Naumov S, Brede O. Phys Chem Chem Phys. 2000;2:4947–4955. [Google Scholar]
- 62.(a) Rospenk M, Fritsch J, Zundel G. J Phys Chem. 1984;88:321–323. [Google Scholar]; (b) Koll A, Rospenk M, Sobczyk L. J Chem Soc Faraday Trans. 11981;77:2309–2314. [Google Scholar]; (c) Rospenk M. J Mol Struct. 1990;221:109–114. [Google Scholar]
- 63.Bell RP. The Proton in Chemistry. Cornell; Ithica, NY: 1973. [Google Scholar]
- 64.Eberson L. Electron Transfer Reactions in Organic Chemistry. Springer-Verlag; New York: 1987. (a) pp 77–79; (b) pp 51–52; (c) p 27; (e) pp 30–34 (using the radii in reference 71).
- 65.Buhks E, Bixon M, Jortner J. J Phys Chem. 1981;85:3763.Smaller secondary isotope effects have been observed for related electron transfers, e.g. Gould IR, Farid S. J Am Chem Soc. 1988;110:7883–5.
- 66.Pre-exponential factors from 1011 to 1013 M−1 s−1 have been used for bimolecular adiabatic electron transfer reactions, values described as a collision frequency or a rate of crossing at the transition state64,67,663 (at 298 K, the Eyring prefactor kBT/h is 6 × 10¹² s−1). One recent paper66a describes the choice of prefactor as related to whether solvent or inner-sphere motions are dominant in the reorganization energy, a level of detail that is not yet available for CPET processes. In this mechanistic section, the analysis uses the Eyring equation as is typical in mechanistic chemistry; in the Marcus Theory section that follows the most typical67 Z = 1011 M−1 s−1 is used. Using Z = 1011 M−1 s−1 in this mechanistic context would give ΔG‡Z=1011 = 8 kcal mol−1 and would strengthen the argument against the PT1-ET1 mechanism; the estimate of ΔGET1 would have to be off by more than 0.3 V. Thus the use of the Eyring equation here is a conservative (worst-case) choice for this argument, Hamann TW, Gstrein F, Brunschwig BS, Lewis NS. J Am Chem Soc. 2005;127:13949–13954. doi: 10.1021/ja0515452.
- 67.The Marcus equation is often applied to bimolecular reactions using 1011 M−1 s−1 as the prefactor (rather than the Eyring kBT/h): k = (1011 M−1 s−1)exp(−ΔG‡/RT)67a–d; KP is typically assumed to be ~1 M−1 with work terms added where appropriate. 67a–d,71 Marcus RA, Sutin N. Biochim Biophys Acta. 1985;811:265–322.Sutin N. Prog Inorg Chem. 1983;30:441–499.Sutin N. Acc Chem Res. 1982;15:275–282.Nelsen SR, Pladziewicz JR. Ace Chem Res. 2002;35:247–254. doi: 10.1021/ar0101077.
- 68.cf., McClelland RA, Kanagasabapathy JVM, Banait NS, Steenken S. J Am Chem Soc. 1992;114:1816–1823.de Carvalho IMM, Gehlen MH. J Photochem Photobiol A: Chem. 1999;122:109–113.Kikuchi K, Sato C, Watabe M, Ikeda H, Takahashi Y, Miyashi T. J Am Chem Soc. 1993;115:5180–5184.
- 69.Fang Y, Liu L, Feng Y, Li X, Guo Q. J Phys Chem A. 2002;106:4669–4678.Feng Y, Liu L, Fang Y, Guo Q. J Phys Chem A. 2002;106:11518–11525.Wang Y, Eriksson LA. Int J Quant Chem. 2001;83:220–229.O’Malley PJ. J Am Chem Soc. 1998;120:11732–11737.Kim H, Green RJ, Qian J, Anderson SL. J Chem Phys. 2000;112:5717–5721.(f) A minimum for a [HOAr-im]•+ species in solution has been calculated in reference 30b.
- 70.(a) O•••N distances in these and related structures are in the range 2.53–2.65 Å.33 With typical O-H and N-H distances of 0.96 and 1.01 Å,70a the distance between proton positions in OH••N vs. O••HN tautomers should be 0.56 – 0.68 Å in a linear hydrogen bond. In the bent structures likely for HOAr-B, the distances should be ~0.7–0.8Å. Weast RC, editor. CRC Handbook of Chemistry and Physics. 54. Cleveland, OH: 1973. pp. F198–9.
- 71.(a) An electrostatic correction to ΔG° for the Marcus analysis64c has been included for the HOAr-B + [Fe(N-N)3]3+ reactions: ΔG°′ – ΔG° = (Z1–Z2–1)(331.2 ×f)/(D × r12) = 0.76 kcal mol−1, or 0.03 eV; Z1 = 0;Z2 = +3;f = 0.60 (for 0.1 M ionic strength);64c D = 37.5; r12 = 13.9 Å. The radius of HOAr-B was calculated from the lowest crystallographic volume ~1400 Å3 and V = (4/3)πr3, yielding r = 6.9 Å. The radius of [Fe(bpy)3]3+is assumed to be 7.0 Å.71b For the HOAr-B + [NAr3]•+ reactions one of the species on each side of the equation is uncharged, therefore the correction is zero, Schlesener CJ, Amatore C, Kochi JK. J Am Chem Soc. 1984;106:3567–3577.
- 72.Fitting of k vs. T data to eqs 12 and 15 implicitly assumes that λ is constant with temperature. For λ to change significantly over such a small temperature range (30 – 50 K) would require λ to have a very large entropic component (Δ λ = Δ[ΔHλ°] – Δ[TΔSλ°] ≈ ΔT[ΔSλ°], which would be ≤1 kcal mol−1 even if ΔSλ° were 20 cal K−1 mol−1.
- 73.Kowert BA, Marcoux L, Bard AJ. J Am Chem Soc. 1972;94:5538–5550. [Google Scholar]
- 74.(a) Δ22([Fe(bpy)3]3+) was calculated from the self exchange rate50c using the adiabatic Marcus equation with Z = 1011, taking λ = 0.25 ΔG‡11 and a [Fe(bpy)3]3+ self exchange rate. The self exchange rate for [Fe(4,4′-Me2bpy)3]3+ is 2 times faster than that for the bipy derivative,50c so it is likely that [Fe(5,5′-Me2bpy)3]3+ would also be slightly faster.
- 75.Markle, T. F.; Rhile, I. J.; Nagao, H.; DiPasquale, A. G.; Mayer J. M., manuscript in preparation and work in progress.
- 76.The calculation of an adiabatic λ from the temperature dependent rate data assumes that the equilibrium constants for formation of the precursor and successor complexes are 1 M−1 at all temperatures; see, however, the discussion of nonadiabatic character below.
- 77.(a) Marcus RA. J Phys Chem. 1963;67:853–857. [Google Scholar]; (b) Fu Y, Swaddle TW. J Am Chem Soc. 1997;119:7137–7144. [Google Scholar]
- 78.Newton MD, Sutin N. Annu Rev Phys Chem. 1984;35:437–480., esp. p. 451.
- 79.Sutin N. Prog Inorg Chem. 1983;30:441–498. [Google Scholar]
- 80.The Eyring parameters for these reactions (Table 4) also suggest adiabatic processes. Nonadiabatic reactions should be marked by large negative ΔS‡ to reflect the low probability of reaction, but the values observed, −14 to −17 e.u., are modest for a bimolecular process.
- 81.Kp = 0.1 (at 298 K) and ΔSP = −10 eu imply ΔHP = −1.6 kcal mol−1. Using these assumptions, estimated values of Hrp and λ can be derived by fitting kET (where kET = kobs/KP) vs T data to eq 15.
- 82.Zhang H, Kwong FY, Tian Y, Chan KS. J Org Chem. 1998;63:6886–6890. doi: 10.1021/jo980646y. [DOI] [PubMed] [Google Scholar]
Associated Data
This section collects any data citations, data availability statements, or supplementary materials included in this article.
Supplementary Materials
Supporting Information Available: Syntheses and cyclic voltammograms, and kinetic, chronoamperometry, and X-ray crystallographic data. This material is available free of charge at http://pubs.acs.org.