Abstract
The aggregation of two negatively-charged polypeptides, poly-L-glutamic acid (PE) and a copolymer of poly-glutamic acid and poly-alanine (PEA), has been studied at different peptide and salt concentrations and solution pH conditions. The kinetics of aggregation were based on Thioflavin T (ThT) fluorescence measurements. The observed lag phase shortened and the aggregation was faster as the pH approached the polypeptides’ isoelectric points. While the initial polypeptide structures of PE and PEA appeared identical as determined from circular dichroism spectroscopy, the final aggregate morphology differed; PE assumed large twisted lamellar structures and the PEA formed typical amyloid-like fibrils, although both contained extensive β-sheet structure. Differences in aggregation behavior were observed for the two polypeptides as a function of salt concentration; aggregation progressed more slowly for PE and more quickly for PEA with increasing salt concentration. Several models of aggregation kinetics were fit to the data. No model yielded consistent rate constants or a critical nucleus size. A modified nucleated polymerization model was developed based on that of Powers & Powers (1), which incorporated the ability of oligomeric species to interact. This provided a best fit to the experimental data.
Keywords: protein aggregation, poly-glutamic acid, amyloidogenesis, nucleated polymerization
1.0 Introduction
Protein folding is important for cellular function and has been the subject of extensive research (2–4). Protein misfolding into inactive forms and aggregates can also occur. Proteins can assemble to form two different types of aggregates:disordered and ordered. While disordered aggregates have important consequences in pharmaceutical production, stabilization, and delivery, the ability of proteins and polypeptides to form ordered aggregates has been linked to disease in vivo and also to potential technological applications (5–9). Ordered aggregates can form high aspect ratio amyloid fibrils that often exhibit enhanced stability to pH and temperature fluctuations compared to native protein structures (9–11). While the amino acid sequence, overall morphology, and sizes of fibrils varies, all amyloids have a common cross β-sheet structure, as confirmed by X-ray diffraction (XRD) (12).
Studies on the aggregation process have included characterizing natural amyloids, determining non-native peptide sequences that aggregate (13, 14), characterizing the effect of co-solvents andpH(15, 16), and salt (17) on aggregate formation, and computer simulations to understand the thermodynamics (18, 19) and kinetics of aggregation (1, 20, 21). While only a limited number of protein sequences leading to amyloid fibril formation have been found in nature, it has been shown that synthetic proteins and peptides can form amyloid fibrils under certain conditions, indicating that amyloid fibril formation is a general property of the peptide backbone and not linked only to specific side chain sequences (22, 23). In particular, Fandrich and Dobson showed that even large chain, hydrophilic polypeptides of poly-glutamate, where electrostatic repulsions prevent ordered aggregation at near physiological pH, can form ordered aggregates by lowering the pH to the isoelectric point and raising the temperature. Characterization of the morphology of poly-glutamic acid aggregates by X-ray diffraction has determined that they form lamellae that contain extensive β-sheet structure (24, 25). The spacing between β-sheets differs depending on whether the aggregation occurred in the presence of Ca2+ ions at pH~5.5 or Na+ in 0.1N HCl (24, 25). However, the effect of salt and pH and on the kinetics and morphology of poly-glutamic acid aggregation has not been examined, either experimentally or computationally.
In this work, we describe the importance of pH, salt type and concentration, peptide concentration and sequence on the kinetics and morphology of aggregates of poly-glutamic acid and a co-polymer of poly-glutamic acid and poly-alanine. The kinetics of aggregation were measured using Thioflavin T (ThT) binding and fluorescence, and the morphology was determined by microscopy. Models of the aggregation process are proposed to evaluate critical nucleus sizes and activation energies.
2.0 Materials and Methods
2.1 Characterization of Polypeptide Monomers – CD Spectroscopy
Circular Dichroism (CD) spectroscopy was used to characterize the secondary structure of polypeptide monomers and performed on an Aviv Biomedicals Circular Dichroism Spectrometer Model 62DS. Polypeptide solutions were diluted to 0.5mg/mL, and 300μL samples were pipetted into a quartz cuvette with a 0.1cm path length. Measurements were made at both 25°C and 65°C (elevating the temperature and holding for 5 minutes before measuring) of scans from 200 to 260nm. The CD signal was converted to a mean residue ellipticity, with units of deg cm2/dmole, using the mean residual weight, the peptide concentration, and the cuvette path length.
2.2 Aggregation Procedure
Poly-L-glutamic acid sodium salt (MW ~ 4,100, about 27aa) and poly (Glu:Ala) 6:4 sodium salt (MW ~ 19,400, about 163aa) were purchased from Sigma-Aldrich and used without further purification. Salt solutions of 100mM, 50mM, 10mM or no salt were adjusted to pH 3.1, 3.6, 4.1, or 4.6 with small quantities of 1M or concentrated HCl. The polypeptides were weighed to make 5 to 10mL of 1mg/mL solutions. The solutions were sonicated for 5 minutes with a Branson Sonifier 450 at 50% output until the solution was clear and the polypeptides were fully dissolved. The polypeptide solutions were filtered and then placed in a 65°C oven, and the aggregation was allowed to proceed for up to one month. For experiments to determine the importance of seeding, aliquots of solutions were saved and frozen at −20°C for later experiments. Only aliquots taken when solutions were exhibiting ThT fluorescence above baseline but below the maximal value for the aggregated solution were used for preformed seeding experiments.
2.3 Thioflavin T Fluorescence Measurements
The fluorescence of bound Thioflavin T and Congo Red are common methods to track the growth of amyloid-like aggregates over time. ThT molecules fluoresce more strongly when they are bound in a planar configuration than when they are free in solution and can bind in the fold of an exposed β-sheet along the main fibril axis (26). Thus, strong ThT fluorescence indicates the presence of β-sheet structure. Fluorescence methods have been most commonly used to qualitatively determine the presence or absence of amyloids, and recent work has verified that ThT fluorescence varies linearly with fibril concentration (27). Although one single ThT binding curve as a function of time does not provide sufficient information to determine the species size distribution (as could be obtained from dynamic light scattering), it is likely that only species larger than a critical size contribute to the overall ThT fluorescence. This feature of ThT fluorescence is significant when comparing kinetic data to the mathematical models presented later, as a critical nucleus size does not have to be estimated and all aggregates larger than the nucleus can be determined by ThT binding.
ThT was purchased from Sigma. Stock solutions of 250μM were prepared daily by dissolving ThT in 20mL of deionized (DI) water. These stock solutions were wrapped in foil in stored at 4°C. Working solutions were prepared as needed by mixing 2.5mL of filtered stock solution with 2.5mL of 25μM sodium phosphate (pH~6.5) and 20mL of DI water. The pH of the working solution was adjusted by adding 6 drops of 1M HCl to lower the pH between 3.7 and 4.0. This working solution was covered in foil when not in use.
ThT fluorescence measurements were made on a Molecular Devices SpectraMax M2 plate reader with excitation at 440nm and emission measurements made at 490nm. Solutions were thoroughly mixed in individual wells of an opaque 96-well plate immediately prior to measurements. Triplicate measurements of 20μL of peptide solution mixed with 200μL of working ThT solution were made for each time point. Additionally, control measurements of either 200μL of peptide solution, made after sonication and before placing the solution in the 65°C oven, or 200μL of working ThT solution, made periodically during the aggregation, were performed. Relative ThT fluorescence values consisted of subtracting the combined baseline of peptide alone (usually around 20-25AU) and ThT alone (usually around 70-90AU) fluorescence values from the measurement and scaling by a baseline average maximum value once the ThT fluorescence achieved a constant value.
2.4 Characterization of Aggregate Morphology
Three microscopies were used to characterize the size and morphology of the polypeptide aggregates:scanning electron (SEM), transmission electron (TEM), and atomic force (AFM). In all cases, adsorption of the fibrils onto a surface proved difficult; therefore a 0.1 wt % solution of poly-L-lysine (purchased from Ted Pella and stored under nitrogen at 4°C) was added to the surface for two minutes and dried with nitrogen gas prior to adding the polypeptide solution. For SEM imaging, glass microscope coverslides were rinsed with acetone and water before being dried with nitrogen. For TEM, 400 mesh copper grids were coated with formvar (0.5% in ethylene dichloride floating on water) and carbon and glow discharged prior to use. For AFM, freshlycleaved mica or highly-oriented pyrolytic graphite (HOPG) was used. The precursor surfaces were then coated with poly-L-lysine for 2 minutes, dried with nitrogen or wicked dry, coated with the polypeptide solution for 5 minutes, and dried with nitrogen or wicked dry. For SEM, the prepared surfaces were mounted on stubs and sputter coated in a Bal-tec MED 020 Sputter Coater with either a 12–25thick IR coating or 30–40Pt coating. For TEM, after depositing the peptides on the surface, the grids were rinsed with water, wicked dry, stained with a 0.1–0.2% uranyl acetate for 2 minutes, wicked dry, and stored overnight before imaging. AFM samples were loaded on a specimen disc and imaged immediately after peptide deposition. SEM imaging was preformed on a Hitachi S-5000 SEM operating at 10kV. TEM imaging was performed on a FEI Tecnai 12 TEM at 100kV accelerating voltage. AFM imaging was performed in tapping mode in air on a DI Multimode Scanning Probe Microscope. AFM tips were SiN Point Probe Non Contact AFM tips with a 20nm typical radius of curvature. Typical scan sizes were 5–10μm and scan rates were 1–1.5Hz for attaining both height and phase contrast images.
3.0 Models of Peptide Aggregation
Four models of protein aggregation were considered and their predicted time courses of aggregation were compared with the ThT fluorescence data. The first model was a “random polymerization” model developed by Kodaka (20). In this model, any size species (monomer, oligomer, and polymer) can react irreversibly with any other species, with each reaction having the same rate constant. An analytical solution to the extent of polymerization is available:
| (1) |
where [F] is the concentration of monomers in the fibrils, [M]0 is the initial monomer concentration, a is the rate constant for addition, t is the time, and m is a parameter representing the minimum size of the polymer that is measurable.
The second model is the classical nucleated polymerization model, originally presented by Oosawa and Kasai (28). This model is based on the following assumptions:aggregates can only grow through monomer addition; the monomer attains a rapid pre-equilibrium with the oligomers; the concentrations of oligomers are low; and the monomer concentration remains high enough throughout the aggregation that dissociation from fibrils can be neglected. In contrast to the random polymerization model, the key feature of this model is the formation of a high-energy nucleus, with a size between the smaller oligomers and larger, detectable fibrils. An analytical solution to the classical nucleated polymerization is:
| (2) |
where [M] is the fibril mass concentration, [X]tot is the total protein concentration, a is the rate constant for addition, t is the time, n is the critical nucleus size, and Ks is the dissociation constant for the oligomers (Ks=b/a, where b is the reverse rate constant for oligomer dissociation and a is as defined previously).
The third model was developed by Powers and Powers (1) and is a modified version of the classical nucleated polymerization model. In this model, a rapid monomer-oligomer pre-equilibrium is not assumed, nor is the requirement for the monomer concentration to remain high during the aggregation. Instead, three different regimes for polymerization are considered:monomer oligomerization with a dissociation constant Ks (previously defined), an irreversible monomer addition to the nucleus, and a reversible fibrillization with a dissociation constant of Kc (the ratio of the rate constant for monomer dissociation from fibrils (c) to that for addition (a)). With the assumption of irreversible addition to the nucleus, the fibrils can be lumped into one species, and the aggregates can be divided into pre-nuclear oligomers and post-nuclear fibrils. While one forward rate constant for monomer addition, a, to any species, is assumed, two different reverse rate constants – a backwards rate constant, b, for dissociation from pre-nuclear oligomers and a smaller backwards rate constant, c, for dissociation from the more stable post-nuclear fibrils are included. Examining the dissociation constants, three different regimes exist. When the monomer concentration is less than Kc ([X]tot< Kc), both oligomers and fibrils are more stable than the monomer, and aggregation will not proceed. When (Kc)<[X]tot< Ks), the nucleus represents the highest energy species on the reaction pathway as well as being a size at which a dramatic change in growth rates occurs. This regime is indicative of a nucleated polymerization mechanism. The final regime occurs when the monomer concentration is very high ([X]tot> Ks). In this regime, the thermodynamic and structural nucleus is the monomer, no lag phase will occur during the aggregation, and the aggregation will follow classical downhill polymerization kinetics.
3.1 A Modified Model for Polypeptide Aggregation
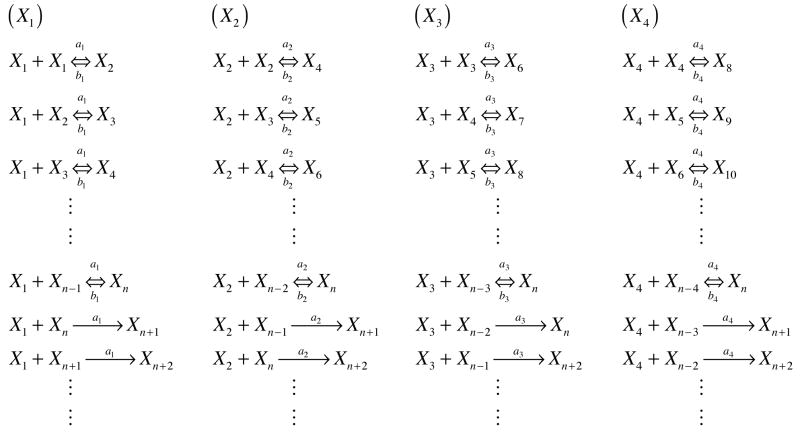
A modified reaction scheme, based on nucleated polymerization, is presented in Figure 1. In this model, aggregation can occur both through monomer addition and through the association of oligomers to other oligomers. This model is thus similar to a “random polymerization” model. For computational ease, only species smaller than the nucleus are considered to react with other species, and fibrils are not assumed to interact. Different forward reaction rate constants can be considered for monomer, dimer, trimer, etc. addition to both pre-nuclear and post-nuclear species. Initially, we assume that these rate constants are the same (amonomer = adimer = atrimer, etc.). However, we also consider different aggregation rates for oligomers using a rate constant approximated from a diffusion-controlled bimolecular association (29), where the collision rate is proportional to (DA + DB)(rA + rB) where Di and ri are the diffusion coefficient and hydrodynamic radius of species i, respectively. The diffusion coefficient and radius for the secondary species in the reaction may vary and this is not taken into account. However, the primary species is either a monomer, dimer, trimer, etc. For these species, the diffusion coefficient is assumed to scale as 1/MW1/2 from the Wilke-Chang correlation (30) where MW is the molecular weight, and the hydrodynamic radius scales as N0.588 (31) where N is the number of amino acid residues in the polypeptide and is proportional to MW for a given polypeptide. Combining these two effects, the collision frequency will vary as MW0.088, and, for the variable rate constant model, adimer = amonomer * 20.088, atrimer = amonomer * 30.088, etc. For either the constant or variable forward rate models, dissociation of species from oligomers can occur with a constantrate constant, b. For the constant rate model, Ks = a/b, the same relationship as in the Powers & Powers model, while in the variable rate model, Ks is defined as Ks = a1/b. In order to be able to treat the post-nuclear aggregates together, the dissociation of species from fibrils is neglected.
Figure 1.
Generalized reaction scheme for a modified nucleated polymerization where oligomers are allowed to interact with each other and fibrils. Presented here are reactions for monomers, dimers, trimers, and tetramers with respect to a general nucleus size, n. For brevity, larger oligomers have not been presented here. Note, if the species on the right is larger than the nucleus size, the reaction will be treated as irreversible.
Using these assumptions, the rate equations for different sized species take the following form: Monomers:
| (3) |
Dimers:
| (4) |
Oligomers (2<i<n):
| (5) |
Nucleus:
| (6) |
Fibrils (i>n):
| (7) |
Fibril number concentration (F):
| (8) |
Fibril mass concentration (M):
| (9) |
Total Mass:
| (10) |
Note that, in generalizing these equations for oligomeric species, the equations will involve summations with species larger than the nucleus size, i> n. As these species are not present, these terms were not considered in the mass balance equations.
For each model, kinetic constants were estimated based on the time course of ThT data using a least mean squared error (LMS) optimization. For the random polymerization model, values of the minimum size of the polymer that could be detected (m values) were varied from 1 to 5000 and corresponding optimal values of the rate constant, a, were determined. In fitting the analytic solution to the classical nucleated polymerization, the Powers & Powers model, and the modified reaction scheme presented above, the parameter space sampled was initially based on that considered by Powers & Powers. Nucleus sizes ranged from 3 to 9, though this range was expanded for nucleus sizes up to 40 for the classical and Powers & Powers models, and the rate constants, a and b (and c for the Powers & Powers model) were optimized for each nucleus size. For the Powers & Powers model and the model presented here, initial values for a (or a1) and b were chosen randomly such that a was between 101 and 106, which yielded good fits, and b was initially chosen between 102 and 108 smaller than a (with c selected randomly at values between 102 and 105 times smaller than b for the Powers & Powers model), but values outside these ranges were considered if they provided better fits. We employed 20 different initial rate constants to determine the global best fit to the data. Initial conditions were chosen based on the molecular weight of the peptide, the peptide concentration, and the maximum fluorescence achieved, such that, at time t = 0, the monomer condition, X1, equaled Xtot0 = (maximum fluorescence x peptide concentration)/molecular weight [=] AU*mol/L, and all other species concentrations were set to zero. For the model considered here, two different rate conditions were chosen: a “constant rate” model where a1 = a2 = … = an, and a “variable rate” model where a1 = a2*20.088 = … = an*n0.088.
4.0 Results
4.1 CD Measurements
CD measurements of diluted polypeptide solutions before aggregation are presented in Figure 2. Measurements were taken for PE at pH~3.6 and 4.1 and PEA at pH~3.6 in sodium acetate (NaAc) and sodium propionate (NaPr) at 25°C and after heating at 65°C for 5 minutes. Ellipticity curves in NaAc and NaPr are similar. At 25°C, both PE and PEA exhibit strong double minima at 208 and 222nm, characteristic of α-helical structure. For this temperature, PE curves have a similar shape at both pH~3.6 and 4.1, with a deeper minima at 208nm than 222nm, though solutions at pH~4.1 have a more negative ellipticity. PEA at this temperature has more symmetric minima at these two minima. Upon heating to 65°C, PE and PEA solutions at these pH values have a weaker ellipticity, have a flatter slope at 200nm, and lose their minimum at 222nm. In addition, spectra for PE at pH~3.6 and 4.1 and PEA at pH~3.6 appeared nearly identical.
Figure 2.
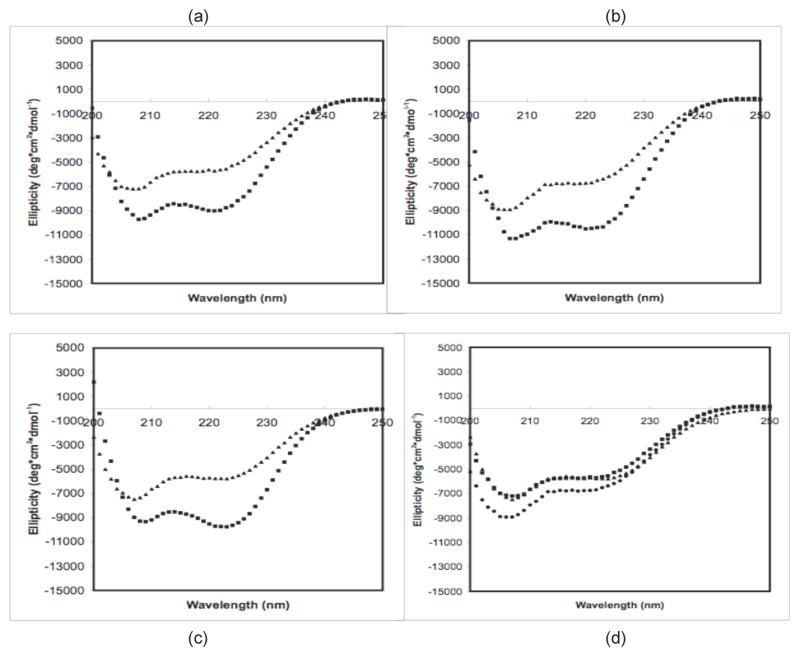
CD Spectra of 0.5mg/mL polypeptides in 25mM sodium propionate for (a) PE at pH~3.6, (b) PE at pH~4.1, (c) PEA at pH~3.6, and (d) PE and PEA at 65°C. For (a)–(c), squares are at 25°C, and triangles are at 65°C. For d, squares are for PE at pH~3.6, circles are for PE at pH~4.1, and triangles are for PEA at pH~3.6.
4.2 Kinetics of Polypeptide Aggregation
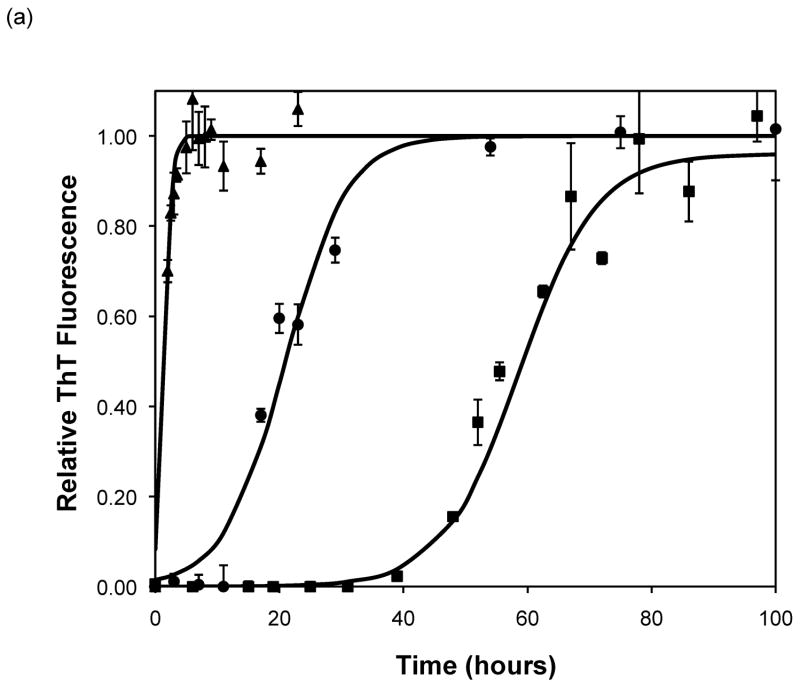
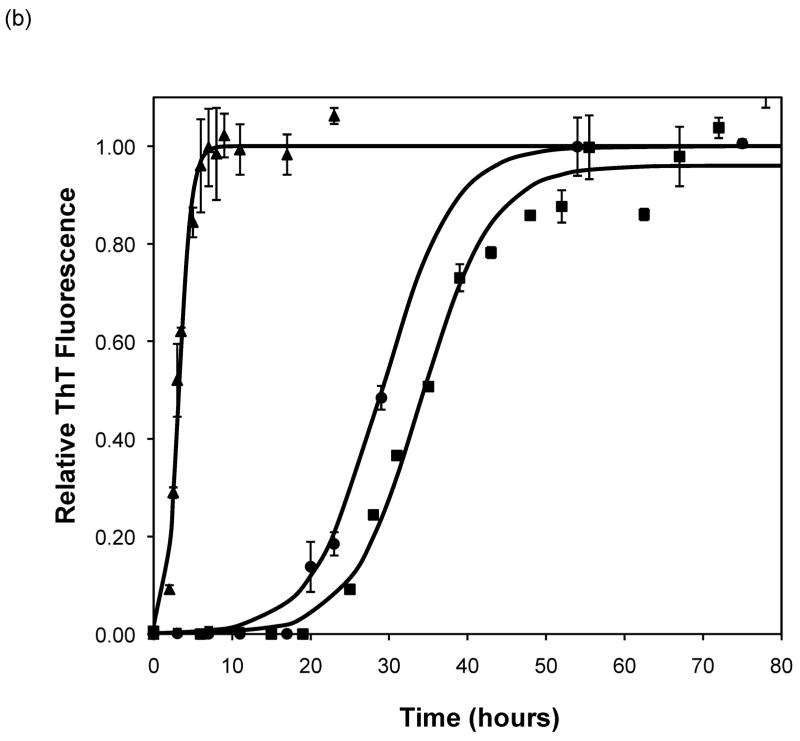
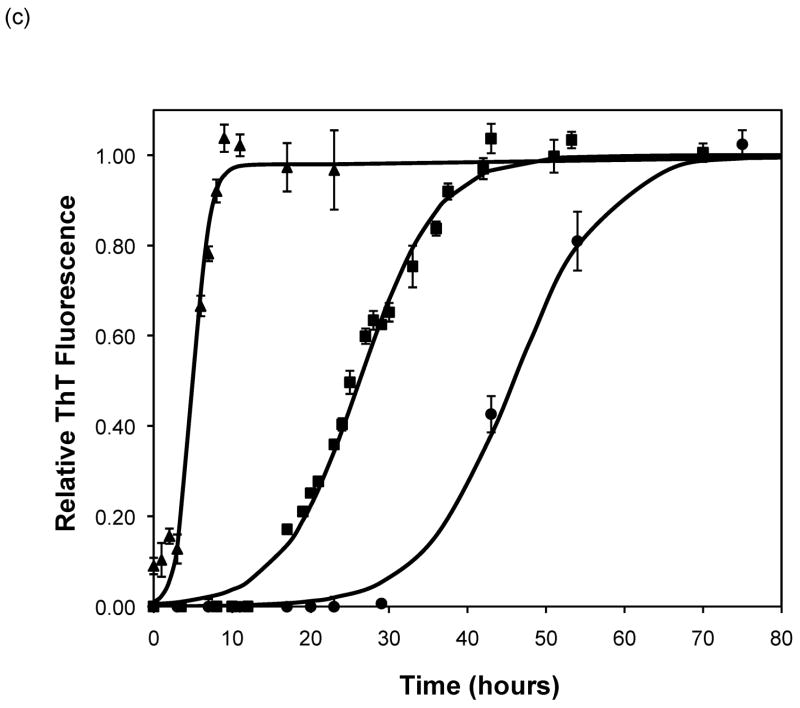
After heating the solution to 65°C, ThT fluorescence measurements were taken at different times to track the polypeptide aggregation. Elevated ThT fluorescence usually corresponded with an increased turbidity of the solution, except for the case of PEA aggregates grown at pH~3.6 without salt; these solutions remained clear throughout the aggregation process yet exhibited strong ThT fluorescence. In terms of magnitude of fluorescence, 1mg/mL polypeptide in 50mM salt at pH~3.6 or 4.1 generated a maximum fluorescence of 800–1200. When the pH dropped to 3.1 or the peptide concentration increased to 2mg/mL, the maximum fluorescence increased to over 2000. Relative fluorescence values for various conditions are presented in Figures 3–5. No lag phase was observed for either PE or PEA at pH~3.1 as the solutions immediately clouded, and ThT measurements indicated significant binding. For PE between pH~3.1 and 4.6, as pH decreased, peptide concentration increased, or salt concentration decreased, elevated ThT fluorescence occurred at shorter times and reached a plateau more quickly. For PEA at pH~3.6, as peptide or salt concentration increased, the lag phase for aggregation was shorter, and the growth occurred more quickly. No elevated ThT fluorescence was measured for PE at pH~4.6 or for PEA at either pH~4.1 or 4.6. Standard lag times, t1/2 (the time at which the aggregation is 50% complete), and elongation rates for a variety of conditions are presented in Table 1.
Figure 3.
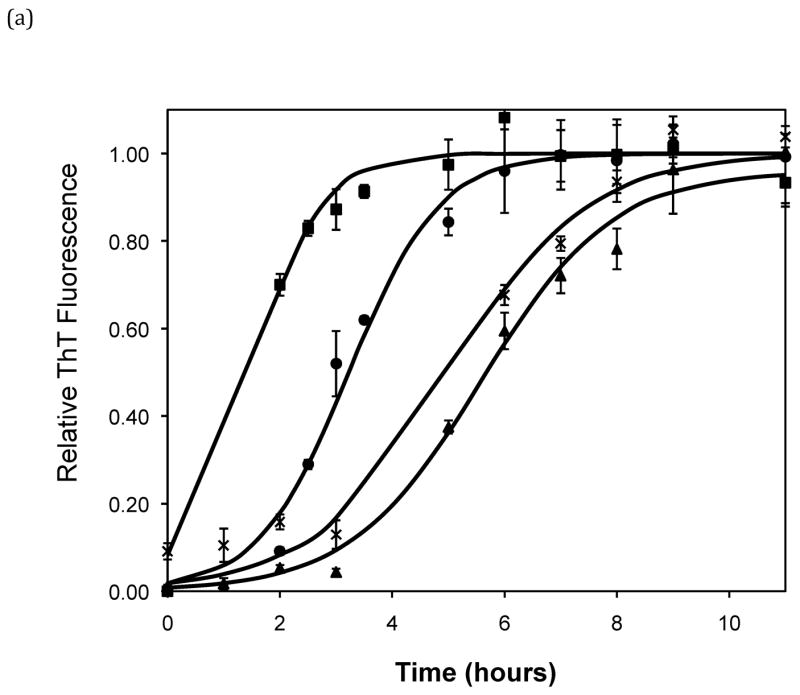
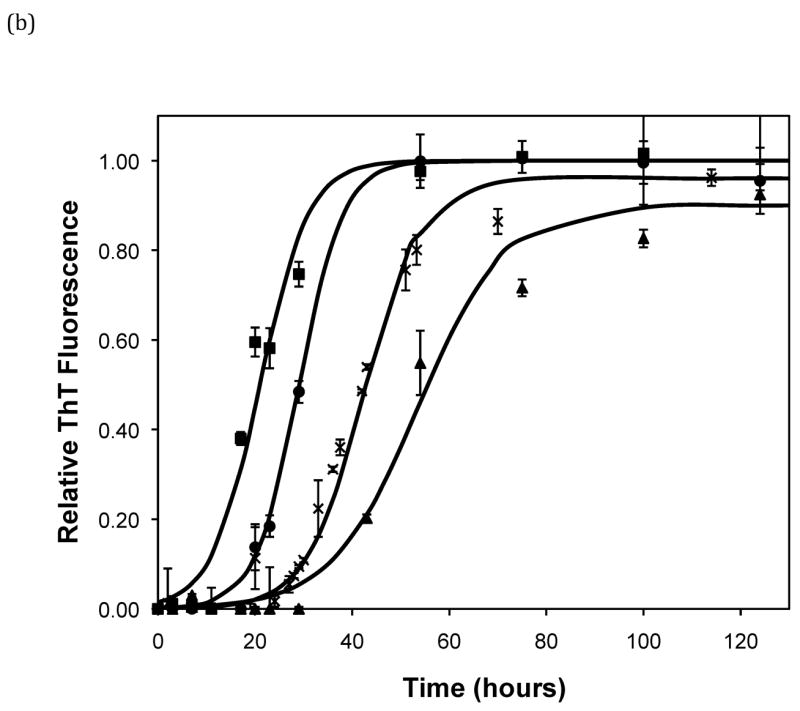
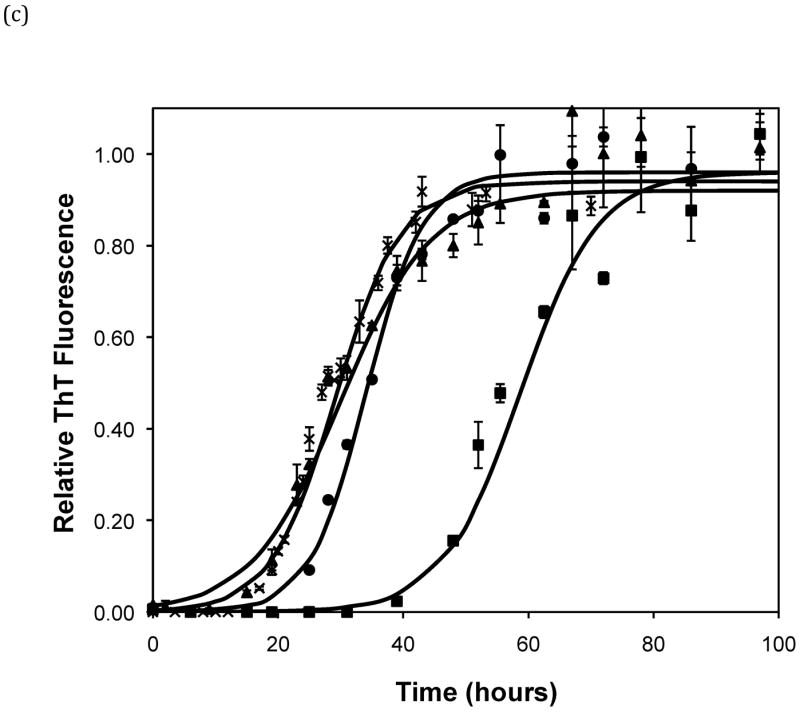
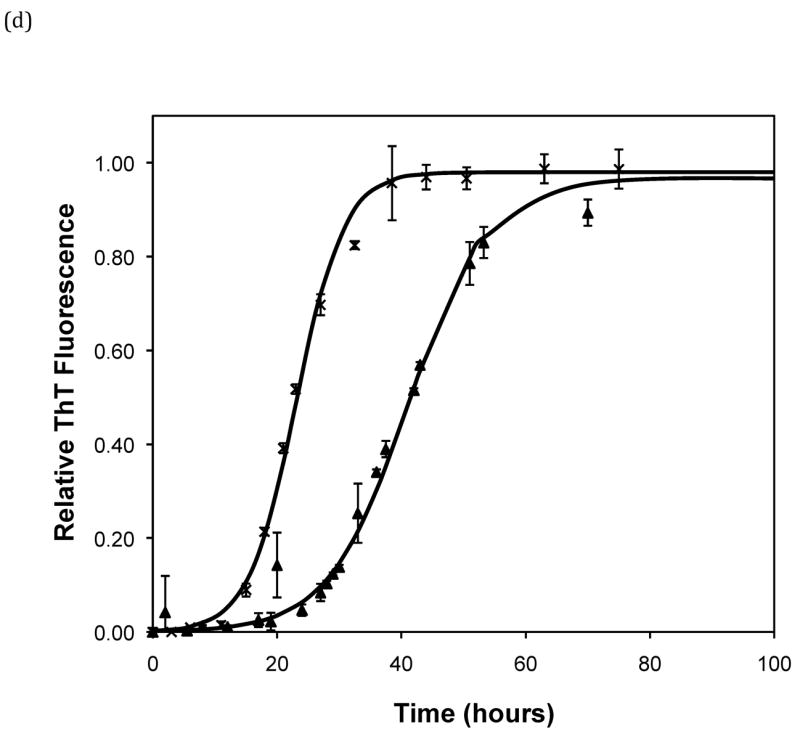
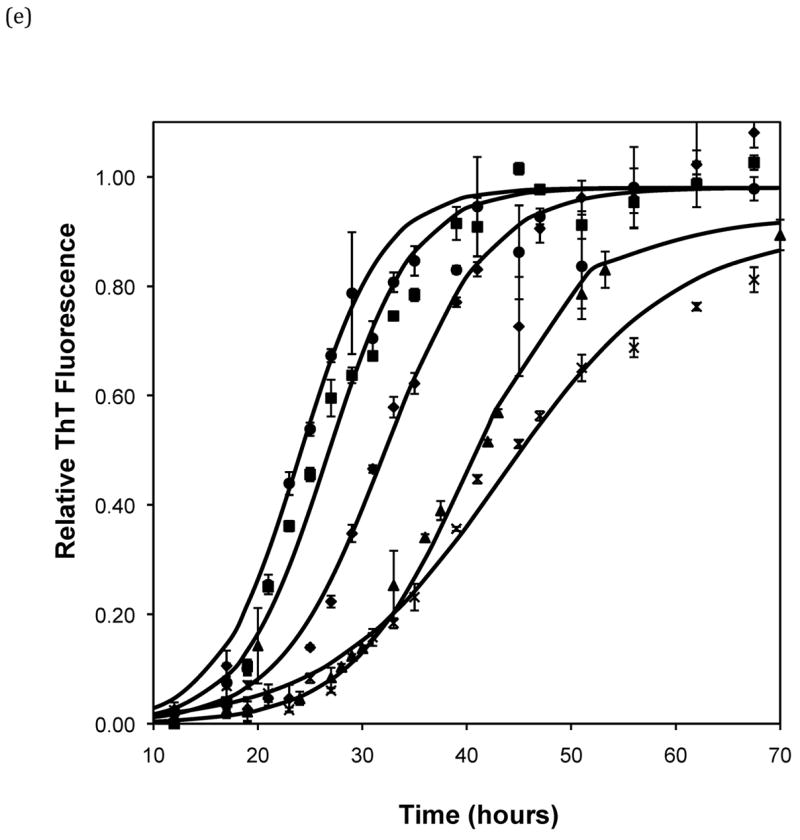
Effect of salt type, concentration, and seeding on polypeptide aggregation. Polypeptide aggregation as a function of salt concentration in sodium acetate for (a) PE at pH~3.6, (b) PE at pH~4.1, and (c) PEA at pH~3.6. Squares are no salt, circles are 10mM, crosses are 50mM, triangles are 100mM.(d) PE pH~4.1 as a function of seeding in 50mM sodium acetate. Crosses are seeded, triangles are unseeded.(e) PE in 50mM salt at pH~4.1. Circles are KNO3, squares are K2HPO4, diamonds are NaNO3, triangles are NaAc, and crosses are MgSO4. Solid fit lines for (a)–(d) are based on a hyperbolic tangent with the center shifted from the origin.
Figure 5.
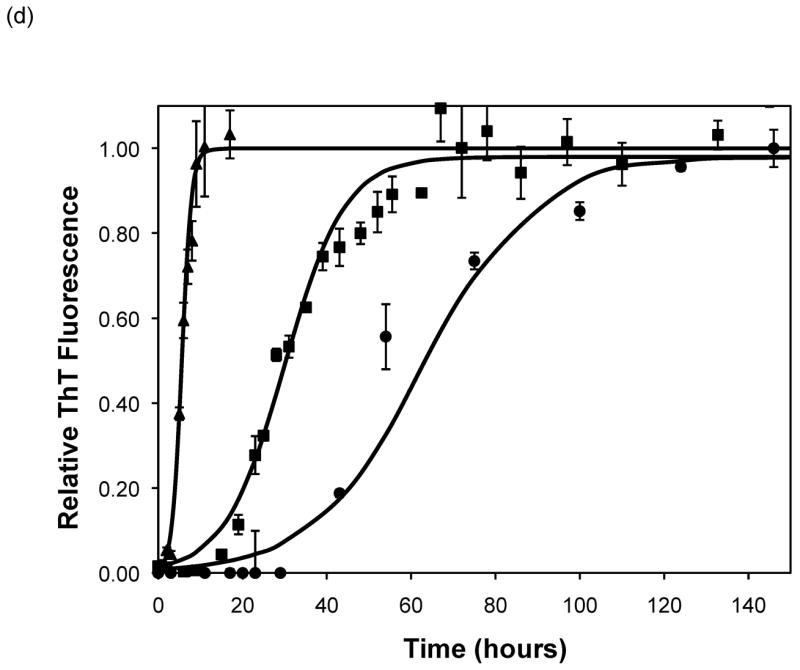
Polypeptide aggregation in different concentrations of sodium acetate.(a) no salt, (b) 10mM, (c) 50mM, and (d) 100mM. Squares are PEA at pH~3.6, circles are PE at pH~4.1, triangles are PE at pH~3.6. Solid fit lines for a–d are based on a hyperbolic tangent with the center shifted from the origin.
Table 1.
Lag time, T50 values, and elongation rates as a function of peptide sequence and concentration, salt composition and concentration, and pH from ThT fluorescence experiments.
| Peptide | Concn (mg/mL) | pH | Salt | Concn (mM) | Lag Time (hr) | t1/2 (hr) | Elongation Rate (hr−1) |
|---|---|---|---|---|---|---|---|
| PE | 1 | 3.1 | NaCOOCH3 | 50 | 0 | 0.55 | 0.81 |
|
| |||||||
| PE | 1 | 3.6 | NaCOOCH3 | 50 | 1.5 | 5 | 0.16 |
| PE | 0.5 | 3.6 | NaCOOCH3 | 50 | 4 | 7.55 | 0.14 |
| PE | 1 | 3.6 | (NH4)2COOCH3 | 50 | 2.4 | 5.3 | 0.17 |
| PE | 1 | 3.6 | NaCOOCH2CH3 | 50 | 2.9 | 5.65 | 0.12 |
| PE | 1 | 3.6 | MgSO4 | 50 | 2.7 | 5.62 | 0.14 |
| PE | 1 | 3.6 | NaCOOCH3 | 100 | 2 | 5.67 | 0.05 |
| PE | 1 | 3.6 | NaCOOCH3 | 10 | 1.4 | 3.9 | 0.22 |
| PE | 1 | 3.6 | NaCOOCH3 | 0 | 0 | 1.5 | 0.26 |
|
| |||||||
| PE | 1 | 4.1 | NaCOOCH3 | 50 | 25.1 | 43 | 0.02 |
| PE | 2 | 4.1 | NaCOOCH3 | 50 | 10.3 | 18.85 | 0.05 |
| PE | 1 | 4.1 | (NH4)2COOCH3 | 50 | 19.8 | 34.33 | 0.03 |
| PE | 1 | 4.1 | NaCOOCH2CH3 | 50 | 24 | 44 | 0.03 |
| PE | 1 | 4.1 | MgSO4 | 50 | 25 | 44.2 | 0.02 |
| PE | 1 | 4.1 | NaNO3 | 50 | 22 | 35.3 | 0.03 |
| PE | 1 | 4.1 | K2HPO4 | 50 | 16 | 27 | 0.03 |
| PE | 1 | 4.1 | KNO3 | 50 | 11.5 | 26.15 | 0.04 |
| PE | 1 | 4.1 | NaCOOCH3 | 100 | 37 | 53.5 | 0.03 |
| PE | 1 | 4.1 | NaCOOCH3 | 10 | 17 | 29.75 | 0.02 |
| PE | 1 | 4.1 | NaCOOCH3 | 0 | 11 | 19.75 | 0.04 |
|
| |||||||
| PEA | 1 | 3.1 | NaCOOCH3 | 50 | 0 | 1.14 | 0.20 |
|
| |||||||
| PEA | 1 | 3.6 | NaCOOCH3 | 50 | 15 | 27.5 | 0.03 |
| PEA | 2 | 3.6 | NaCOOCH3 | 50 | 10 | 16.33 | 0.07 |
| PEA | 1 | 3.6 | (NH4)2COOCH3 | 50 | 12 | 26.5 | 0.02 |
| PEA | 1 | 3.6 | NaCOOCH2CH3 | 50 | 29.5 | 35.45 | 0.08 |
| PEA | 1 | 3.6 | NaCOOCH3 | 100 | 12.5 | 27.8 | 0.02 |
| PEA | 1 | 3.6 | NaCOOCH3 | 10 | 22 | 35.8 | 0.03 |
| PEA | 1 | 3.6 | NaCOOCH3 | 0 | 38 | 56.5 | 0.02 |
4.3 Morphology of Polypeptide Aggregation
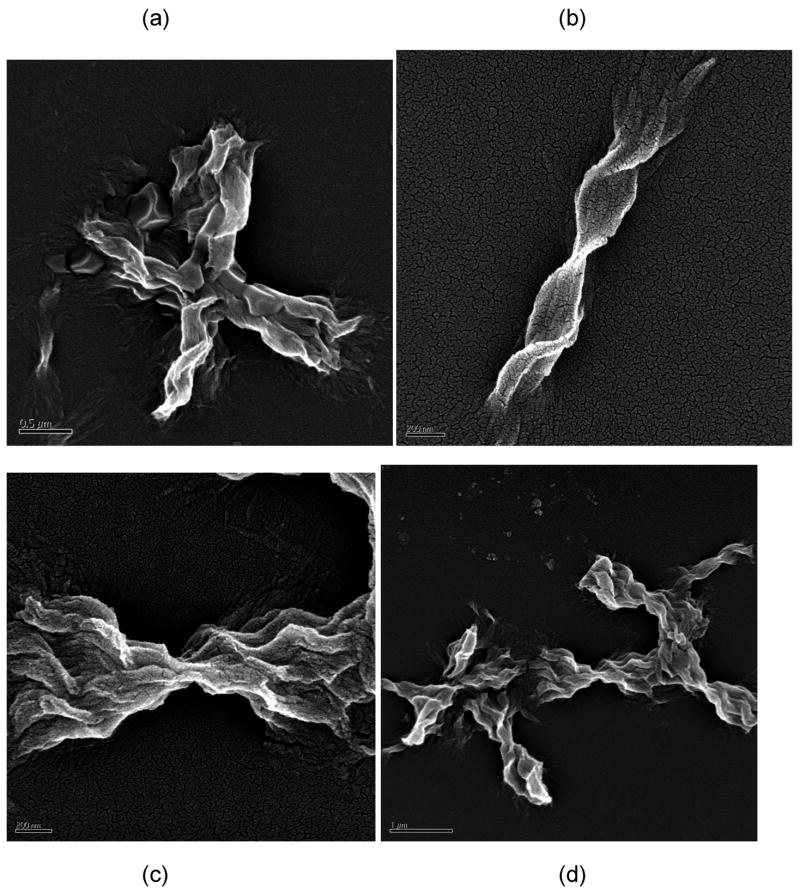
The morphology of aggregated PE and PEA species was markedly different. For all conditions, aggregated PE existed in a lamellar morphology, as previously reported (25). TEM and SEM images of PE aggregates are presented in Figures 6 and 7, respectively. The widths of these lamellae are difficult to ascertain, as the lamellae twist either individually (as in Figure 7b) or as groups (as in Figure 7c). However, the twisted lamellae formed either straight or crossed aggregates 1.5μm to 3.5μm long and 250nm wide. For the straight lamellae, twists occurred every 350nm to 500nm down the length of aggregate. For the crossed ones, twists occurred every 150nm to 200nm down the length of aggregate. For lamellae twisted in groups, the aggregates had one tight twist in middle, 150nm to 200nm thick, and fanned out toward the extremities (as in Figure 7c).
Figure 6.
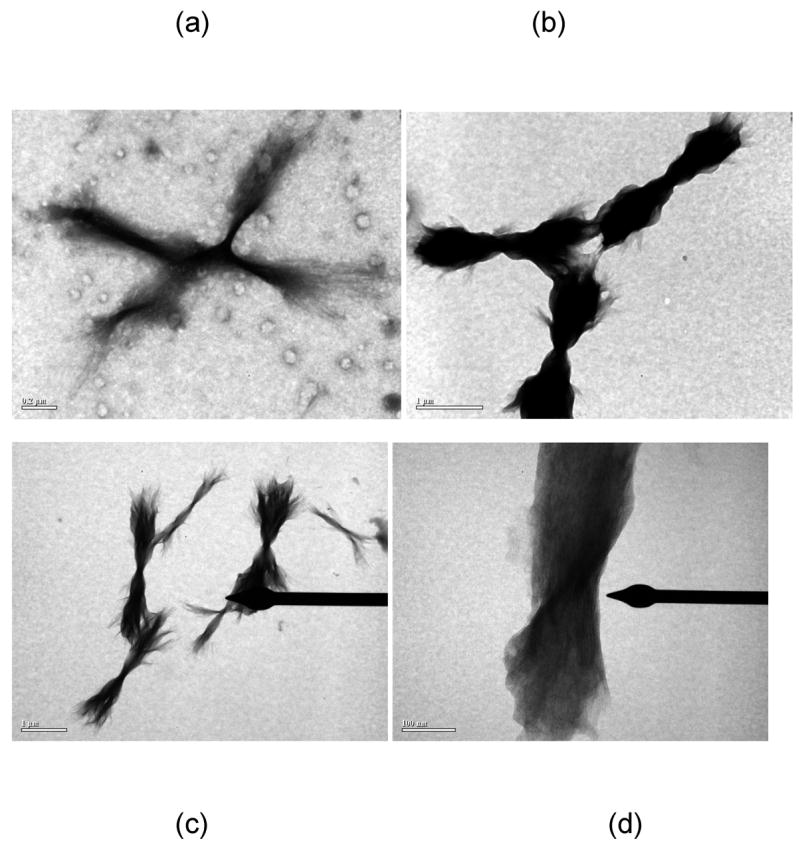
TEM images of UA-stained PE fibrils in (a) 50mM sodium nitrate at pH~3.6, (b) 50mM sodium acetate at pH~3.6, and (c) and (d) 50mM sodium acetate at pH~4.1. Scale bars are 200nm, 1μm, 1μm, and 100nm for (a)–(d), respectively.
Figure 7.
SEM images of Pt-stained PE fibrils in (a) 50mM potassium nitrate at pH~4.1, (b) 10mM sodium acetate at pH~4.1, (c) and (d) no salt at pH~3.6. Scale bars are 500nm, 200nm, 200nm, and 1μm for (a)–(d), respectively.
The morphology of the PEA aggregates depended on the salt concentration. When grown in 10mM NaAc or no salt at pH~3.6, PEA aggregates were fibrillar (Figures 8 and 9). From AFM and TEM images, these fibrils were 4–6nm wide and 150nm long for individual aggregates with some bundles of multiple fibrils that are 15–30nm wide and 3–5μm long. At 50mM and 100mM NaAc, PEA aggregates appeared bundled in mostly larger aggregates. While these aggregates appear in TEM images to have both the linear and crossed structures similar to the PE ones, AFM confirms that these are still fibrillar in nature and not lamellar.
Figure 8.
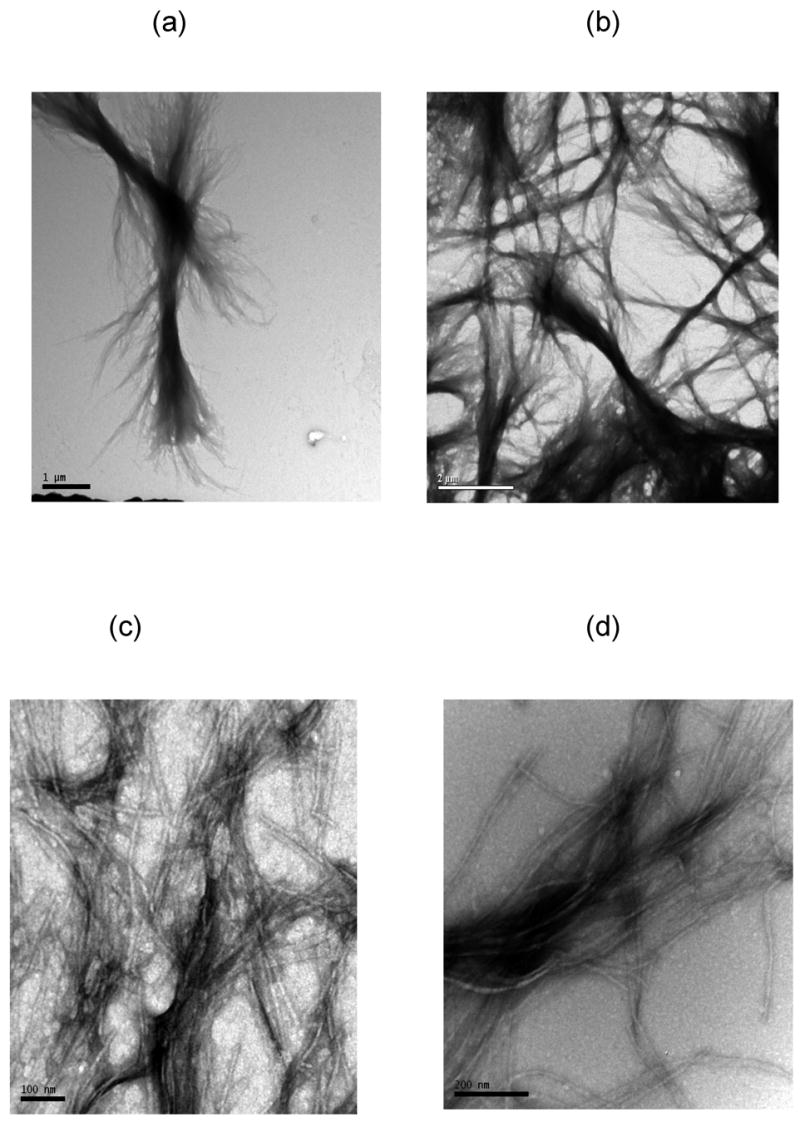
TEM images of UA-stained PEA fibrils at pH~3.6 in (a) 100mM, (b) 50mM, (c) 10mM, (d) 0mM sodium acetate. Scale bars are 1μm, 2μm, 100nm, 200nm for (a)–(d), respectively.
Figure 9.
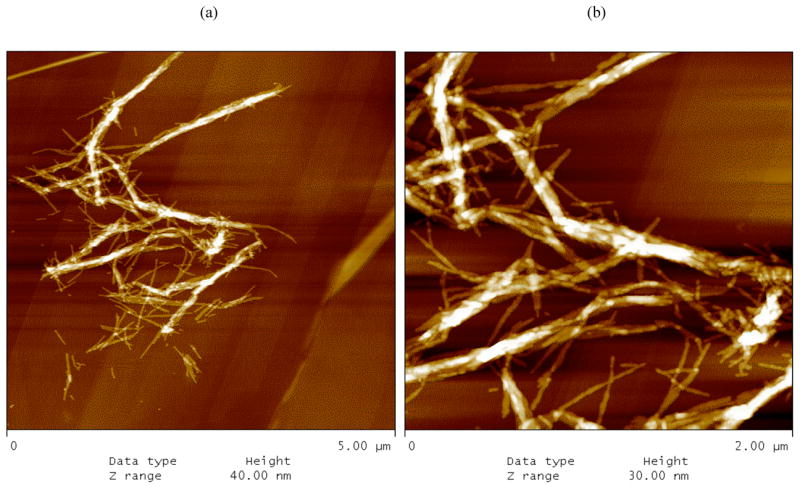
AFM height images of PEA fibrils grown in 50mM sodium acetate at pH~3.6 on HOPG after rinsing with water at pH = 7. Scan sizes and height ranges are (a) 5μm and 40nm and (b) 2μm and 30nm.
4.4 Simulation of Aggregation Rates
Comparing experimental rates of fibril formation with the random polymerization model yielded poor agreement. In most cases, the best fits were obtained when m = 5000 or higher (data not presented). Simulation of a lag time, which typically appeared present, was only possible with an unrealistically large minimum detectable aggregate size, m. Consequently, this model was not able to capture the key features of the polypeptide aggregation.
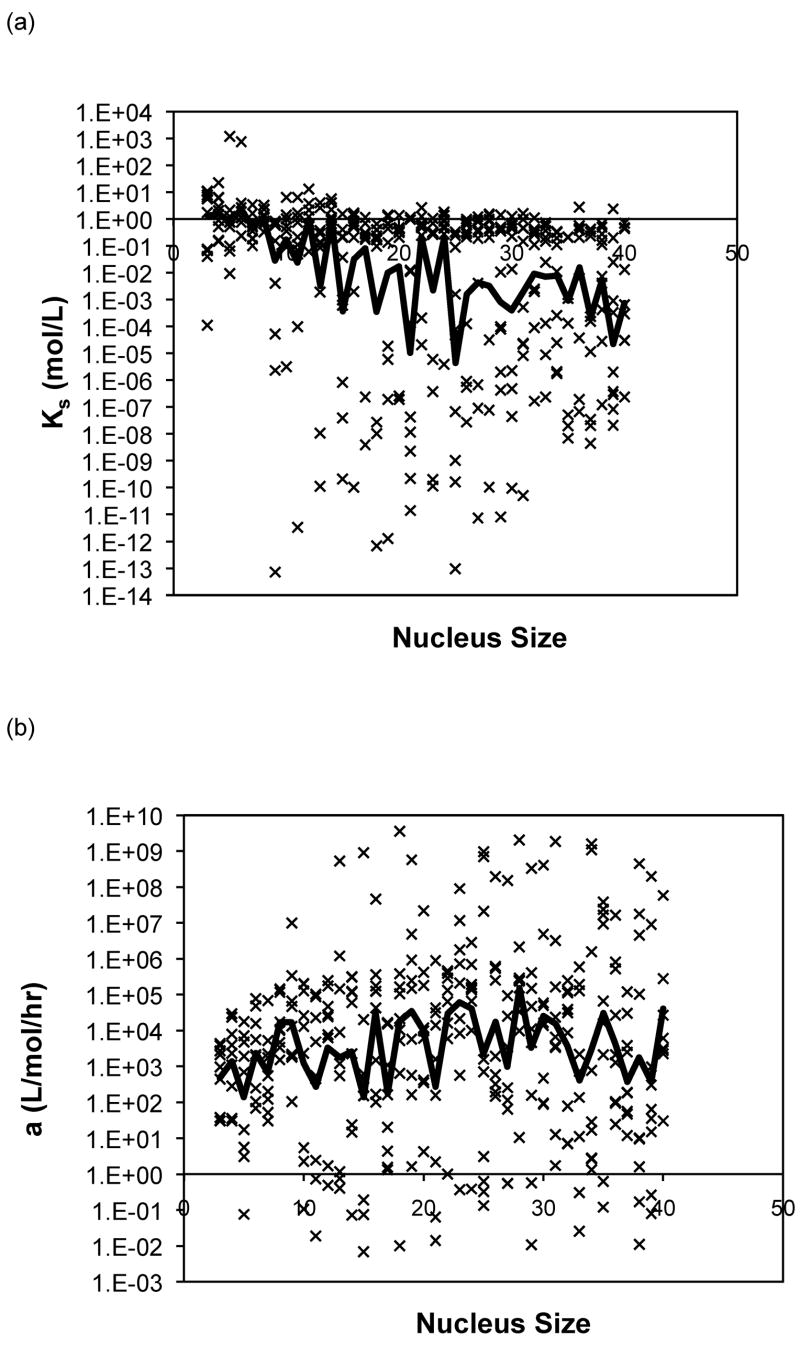
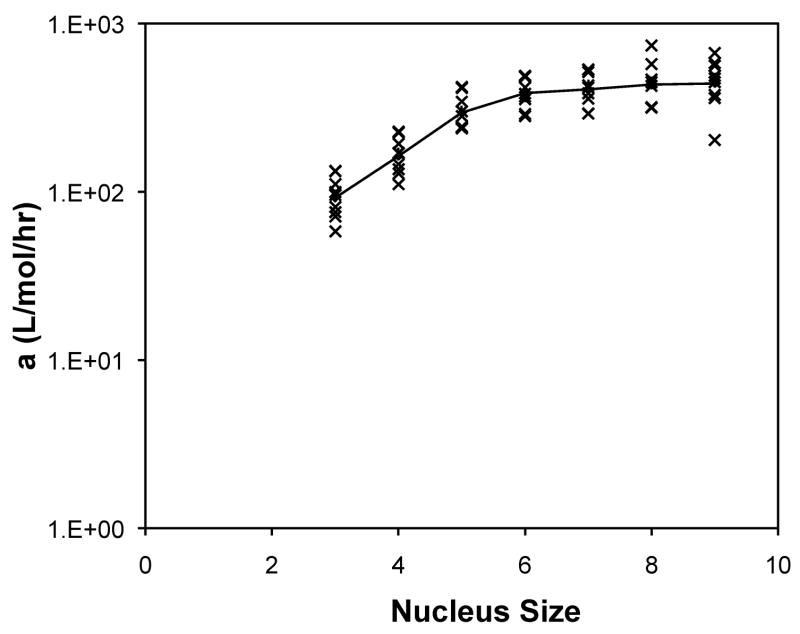
The forward rate constants, a, and dissociation constants, Ks, are presented in Figure 10 as a function of nucleus size for the analytical solution to the classical nucleated polymerization for PE at pH~4.1 in 50mM salts. The most striking feature of the classical model is that, for almost all data sets, the best fit occurred with a nucleus size of 3. In considering the nucleus size to be either a monomer or dimer, better fits were obtained with the monomer.
Figure 10.
Optimized kinetic parameters, (a) Kc and (b) forward rate constant, a, as a function of nucleus size using the analytical solution to the classic nucleated polymerization model for PE at pH~4.1 in 50mM salts. Symbols are for different data sets. The black lines are the average values.
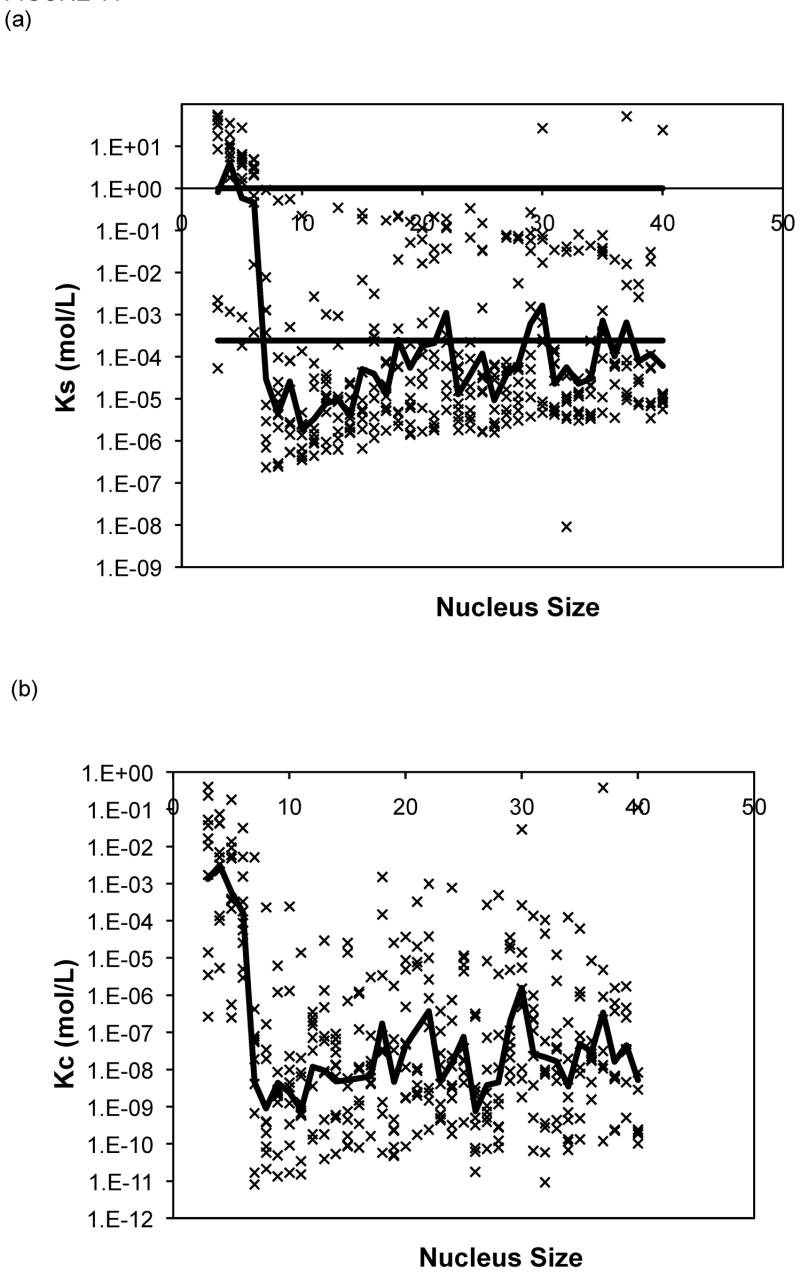
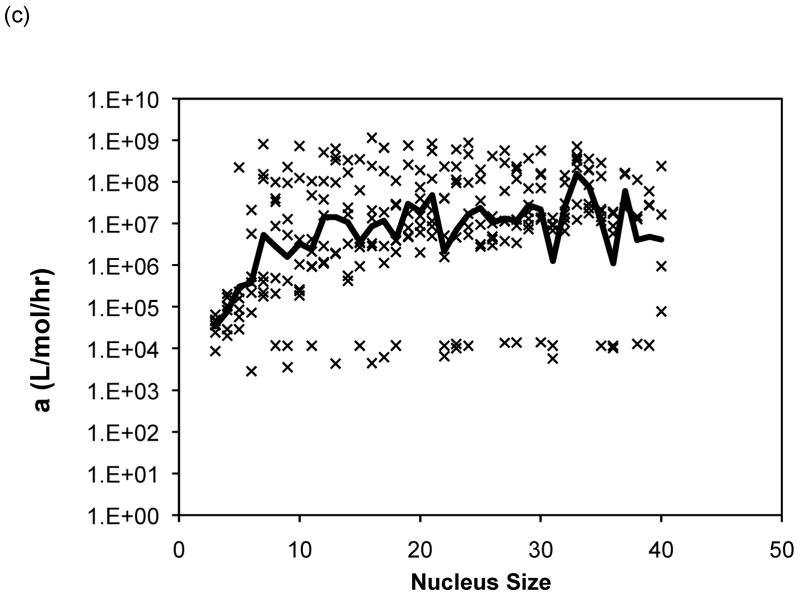
The Powers and Powers model simulations employed a nucleus size ranging from three to nine. For 80% of the data sets, the nucleus size that yielded the best fit over this range was a nine-mer, and thus larger nucleus sizes were considered. The optimal values of the forward rate constant, a, dissociation constants, Ks and Kc, from models with nucleus sizes from n = 3 to 40 are presented in Figure 11 for PE at pH~4.1 in 50mM salts. Optimized constants for PE and PEA at pH~3.6 exhibited similar trends and, thus, are omitted here. In Figure 11, lines have been added for Ks = 1 (representing the point where there is no thermodynamic driving force for aggregation) and Ks = Xtot0, the initial monomer concentration (representing the point where a shift from a nucleated to an irreversible polymerization, or vice versa, is expected to occur). As most of the aggregation experiments were conducted at a polypeptide concentration of 1.0mg/mL and the molecular weights for our PE and PEA are 4,130g/mol and 19,400g/mol, respectively, Xtot0= 2.42 × 10⁻⁴mol/L for PE, and Xtot0 = 5.15 × 10⁻⁵mol/L for PEA. As can be seen from these figures, while average s (where s = Ks/Kc) values remain relatively constant (within an order of magnitude), over all nucleus sizes, average values for both Ks and Kc drop several orders once the nucleus size increases beyond 6 or 7 monomers. Typical mean square error values for the Powers & Powers model are comparable to those obtained with the classical nucleated polymerization.
Figure 11.
Optimized kinetic parameters as a function of nucleus size using the Powers model for PE at pH~4.1 in 50mM salts of (a) Ks, (b) Kc, and (c) forward rate constant, a. Symbols are for different data sets. The black lines are the average values. For Ks, the semi-transparent lines are for Ks=1 and Ks=Xtot0.
For each solution condition (peptide sequence, pH, and salt concentration), no particular nucleus size consistently was optimal. In order to ascertain whether any particular nucleus size resulted in realistic parameter values, we examined the best fit data for each nucleus size and determined the optimal Ks value. For a nucleated polymerization mechanism, Kc< Xtot0< Ks (1). Thus, Ks values for polypeptide aggregation at pH~3.6 and pH~4.1 should be larger than Xtot0 but less than 1. For PE at both pH~3.6 and pH~4.1, a number of different nucleus sizes (n ranging from 15 to 30) yielded similar results, with many nucleus size having reasonable values in 45–65% of the data sets. However, for PEA at pH~3.6, n = 6 produced optimal parameters in 89% of the data sets, with no other nucleus size giving appropriate Ks values in more than 45% of the data sets.
Nucleus sizes from three to nine were initially selected in the modified nucleated polymerization model described in equations (3) to (10). For both the constant and molecular weight dependent rate models, the best fits for each data set usually occurred for a similar nucleus size and yielded comparable optimal rate constants. For PE at pH~3.6, larger nucleus sizes (n = 8 or 9) yielded the best fits for the constant rate model and n = 9 for the variable rate model, although for n = 3 or 4 the variable model appeared to provide a better fit. For PE at pH~4.1, a nucleus size of n = 6 yielded the best fits for both models, and depended on the nature of the salt. For PEA at pH~3.6, larger nucleus sizes (n = 7, 8 or 9) yielded the best fits for the constant rate model and n = 9 for the variable rate one. No particular nucleus size yielded the best fits for over 50% of the data for either model. Best fit forward rate constants, a, and dissociation constant, Ks, from modeling over nucleus sizes from n = 3 to 9 with the both models are presented in Figure 12 for PE at pH~4.1 in 50mM salts. Best fit constants for PE and PEA at pH~3.6 exhibited similar trends and are omitted here. The forward rate constant, a, increased by a factor of three to five as the nucleus size was increased from three to nine. The best fit reverse rate constants and the dissociation constants fell into two ranges, with Ks values either on the order of 10−15 or 10−16 mol/L or 10−1 to 10−3 mol/L. The smaller values often occurred at the smaller nucleus sizes of n = 3, 4, or 5, though the larger values were more common over all nucleus sizes.
Figure 12.
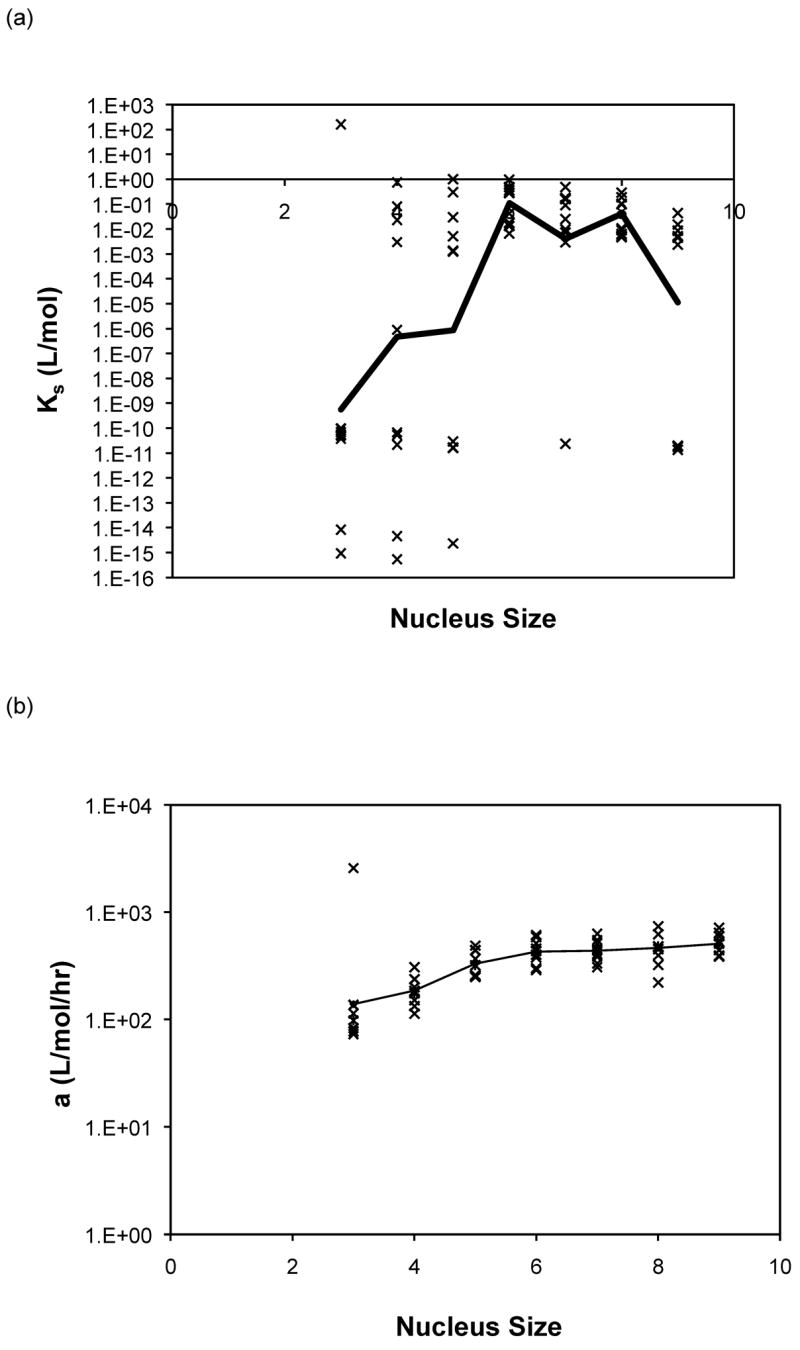
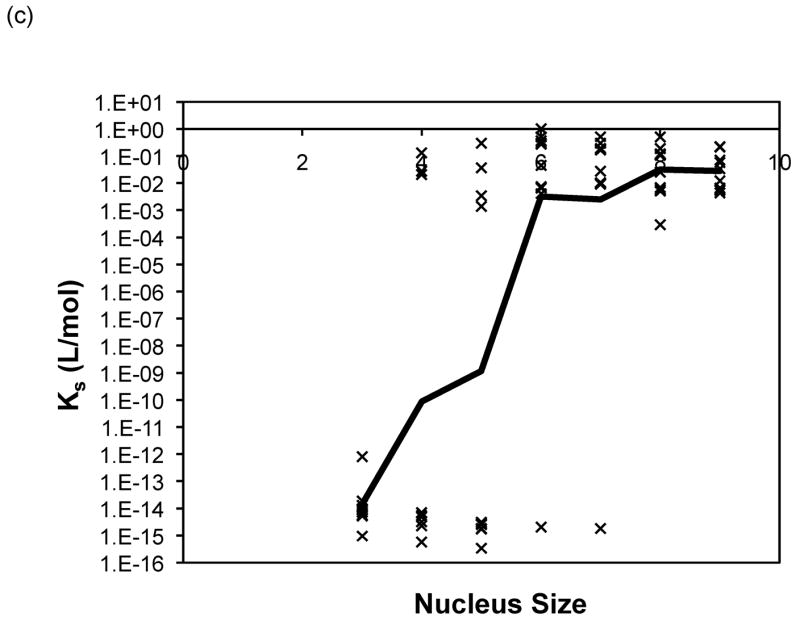
Optimized kinetic parameters as a function of nucleus size using the modified nucleated polymerization model for PE at pH~4.1 in 50mM salts. The top row presents (a) Kc and (b) forward rate constant, a, for the constant rate model, and the bottom row presents (c) Kc and (d) forward rate constant, a, for the variable rate model. Symbols are for different data sets. The black lines are the average values.
A comparison of the best fit rate constants for the classical nucleated polymerization, the Powers Model, and our model is presented in Table 2 for PE at pH~3.6 and 4.1 and PEA at pH~3.6 in 50mM salts. In addition, in comparing the average best fits of the models to the data, both the constant rate model and variable rate models yielded about 56% and 77% better fits, respectively, than the Powers Model for nucleus sizes n=3 to 9. When expanding the Powers model to larger nucleus sizes (from n=3 to 40), the modified models still yielded 29% and 43% better fits, respectively.
Table 2.
Average optimized model parameters using the classical nucleated polymerization, Powers & Powers, and modified nucleated polymerization models over the specified nucleus size for polypeptides in 50 mM salts for PE at pH~3.6 and 4.1 and PEA at pH~3.6.
| Model | PE in 50mM salts at pH~3.6 | PE in 50mM salts at pH~4.1 | PEA in 50mM salts at pH~3.6 | ||||||
|---|---|---|---|---|---|---|---|---|---|
| a (L/mol/hr) | Ks (mol/L) | Kc (mol/L) | a (L/mol/hr) | Ks (mol/L) | Kc (mol/L) | a (L/mol/hr) | Ks (mol/L) | Kc (mol/L) | |
| Classic Nucleated Polymerization (n = 3 to 40) | 2.26E+04 | 5.17E-03 | - | 3.02E+03 | 1.48E-02 | - | 1.09E+05 | 1.78E-04 | - |
| Powers & Powers Model (n = 3 to 9) | 4.90E+05 | 6.08E−02 | 3.91E−05 | 2.98E+05 | 1.38E−02 | 6.63E−06 | 4.24E+06 | 4.46E−03 | 1.76E−06 |
| Powers & Powers Model (n = 3 to 40) | 6.81E+06 | 2.84E−03 | 1.23E−06 | 1.40E+07 | 1.35E−04 | 5.20E−08 | 6.56E+07 | 9.26E−05 | 2.37E−08 |
| Modified NP Model (n = 3 to 9, constant a) | 2.03E+03 | 1.91E−05 | - | 3.43E+02 | 5.93E−02 | - | 3.47E+03 | 1.49E−04 | - |
| Modified NP Model (n = 3 to 9, variable a) | 1.94E+03 | 1.38E−05 | - | 2.00E+02 | 5.44E−04 | - | 3.67E+03 | 1.86E−05 | - |
5.0 Discussion
5.1 Experimental Results
Except for data obtained at pH~3.1 and 4.6, the shape of fibril concentration as a function of time was sigmoidal, with a lag phase, a steep growth phase, and a plateau. At pH~3.1, no lag phase was evident for PE or PEA in 50mM NaAc. At pH~4.6, no aggregation occurred for either polypeptide in 50mM NaAc. When the pH was raised to 4.6 or above, the aggregates dissociated, as evidenced by both ThT fluorescence signals and TEM images (data not shown). Sigmoidal kinetics are typically characteristic of a nucleated polymerization mechanism, which was confirmed by seeding a PE solution at pH~4.1 with preformed aggregates, which significantly reduced the lag phase. The growth kinetics depended on polypeptide composition, pH, and salt concentration and, to a lesser degree, salt composition. For both PE and PEA in 50mM salt, as the pH decreased from 4.6 to 3.1, the polypeptide solutions initially showed no detectable aggregation, either through ThT measurements or through visible precipitate. As the pH was lowered, aggregation occurred after a lag phase, and around pH 3.1 aggregation occurred immediately. The point at which the transitions occurred depended on the primary polypeptide composition. At pH~4.1, PEA does not noticeably aggregate, yet PE does. At pH~3.6, PEA aggregates after a considerable lag phase, but PE’s lag phase is shortened in comparison to that at pH~4.1. Since the larger polypeptide would be expected to aggregate faster than the smaller one, a difference in collision rates cannot explain the different aggregation rates for PE and PEA at pH~3.6 nor for PE at pH~3.6 versus 4.1. The polypeptide monomer conformation does not provide an explanation of the difference in aggregation rates either. While there is a significant change in the CD spectra of the polypeptides when the temperature is increased from 25°C to 65°C, with a decrease in α-helical character, the ellipticities of PE at pH~3.6 and 4.1 and PEA at pH~3.6 at 65°C are almost identical. Thus, there appears to be little difference in the monomer conformation between these two polypeptides at this elevated temperature or as a function of pH. With little change in conformation and collision rates, the different aggregation rates may depend on electrostatic interactions.
Based on the size of the polypeptides studied here, the calculated isoelectric points of PE and PEA are 2.61 and 2.27, respectively (32). Thus, at a given pH, PEA will have a larger negative charge per peptide bond than PE. Previous work by Fandrich and Dobson has shown that in order to form amyloid fibrils of polypeptides with hydrophilic residues, the pH must be adjusted toward the isoelectric point of the peptide (22). As amyloid fibrils are characterized by extensive β-sheet structure, decreasing the net charge on the polymer minimizes repulsive side chain interactions and permits stable stacking of these sheets. Thus, a more negatively charged peptide or protein would be expected to form an ordered aggregate with β-sheet structure more slowly. Table 3 shows the total amount of charge on a monomer of PE and PEA as a function of pH for our polypeptides in the absence of salt. For polypeptide aggregationin the absence of salt, PE at pH~3.6 exhibited no lag phase. A lag phase and growth phase region were present for PE at pH~4.1 and PEA at pH~3.6, and no aggregation occurred for PE at pH~4.6 or PEA at either pH~4.1 or 4.6. Figure 5a shows ThT fluorescence measurements in the absence of salt, and indicate that when the total charge on the monomer is less than 3 to 6, an irreversible polymerization can occur. Above a charge of 9 to 13, no aggregation occurs. In between these values, the lag phase is shorter and the aggregation proceeds more quickly with fewer charges on an individual species.
TABLE 3.
Negative charges on a polypeptide monomer as a function of pH.
| Peptide | pH | |||
|---|---|---|---|---|
| 3.1 | 3.6 | 4.1 | 4.6 | |
| PE | 0.77 | 2.44 | 6.52 | 13.60 |
| PEA | 2.88 | 8.84 | 23.44 | 48.81 |
The situation is more complex when examining the effect of salt on aggregation. As salt concentration increases, the charge on a polypeptide will be screened. PEA at pH~3.6 exhibited a shorter lag phase and slightly faster growth with increasing salt concentration. This has been previously observed with α-synuclein fibrillization at salt concentrations above 10mM (17). However, while the rate of α-synuclein aggregation increased up to salt concentrations of 1M, the rates of PEA aggregation in 50mM and 100mM NaAc were identical. Addition of salt caused the opposite effect for PE at pH ~3.6 and 4.1; increasing salt concentration led to slower rates of aggregation. The reason for this salt effect for PE has not been determined.
Using PE at pH~4.1, the importance of kosmotropic and chaotropic cations and anions on both the kinetics of polypeptide aggregation and on the morphology of the aggregates was examined. While no morphological difference was apparent for either PE or PEA aggregates grown in different salts, the kinetics did change with the nature of the salt. In particular, the cation seemed to control aggregation rates. Chaotropic potassium salts led to significantly decreased lag phases over slightly kosmotropic sodium salts, though the growth rates were similar. Whether the anion was a kosmotrope or a chaotrope had little effect on the kinetics with potassium. However, for kosmotropic cations, chaotropic anions led to a shorter lag phase than kosmotropic anions. Thus, we see that the main specific salting effect is with salts that weakly order the water around the polypeptide leading to shorter lag phases.
5.2 Comparison of Kinetic Models
While we have experimentally determined the importance of electrostatics in polypeptide aggregation, we used simulations to further examine the energetics and kinetics of aggregation. Models based on classical nucleated polymerization, the model of Powers & Powers, and the model developed here provide a basis for comparison. Fitting the ThT data with the classical model, a nucleus size of 1 often yielded the best fit. A nucleus size of 1 indicates that the monomer would be the highest energy species, indicating the absence of a lag phase and irreversible polymerization. Examining best-fit rate constants for the classical model, in many cases, Ks>1. With Ks>1, a small nucleus size yielded the best fit, and the addition of a monomer to any species during the polymerization is energetically unfavorable. However, since only the monomeric species exists at time t = 0, there is a kinetic driving force from the monomer to larger species. Since monomer addition to fibrils is irreversible, once the monomers are incorporated into the post-nuclear aggregates, they are kinetically trapped. This situation does not seem physically reasonable, and, thus, we chose to analyze our data with other models that incorporate more realistic assumptions.
Optimal parameters for the Powers & Powers model are reported in Figure 10. Values of Ks and Kc decrease by several orders of magnitude as the nucleus size increased from 3 to 6 or 7. For n = 3 or 4, best fit Ks values greater than unity were observed in several data sets. The origin of these larger Ks values for smaller nucleus sizes is apparent when examining the magnitude of the rate constants. Forward rate constants for PE and PEA are on the order or 106 or 107 L/mol/hr. With polypeptide concentrations of 10−4 or 10−5 mol/L, in the absence of oligomer and fibril dissociation, aggregation would be predicted to take place in minutes, instead of the hours or days observed for most of the experimental solutions. To counterbalance this rapid aggregation, one of two conditions must occur. Either the nucleus size must be large enough to allow for a lag phase before nucleation occurs, or there must be an almost equally large dissociation from oligomers to slow the aggregation process. With small nucleus sizes, dissociation constants must be large to slow this aggregation process, leading to unreasonably large Ks values. As the modeled nucleus size becomes large, the dissociation constants decrease to more realistic values. For n larger than 6 or 7, different nucleus sizes yield indistinguishable kinetic parameters with the Powers & Powers model. For this reason, their model cannot distinguish between larger nucleus sizes for the data presented here.
While no single nucleus size yielded the best fit to the experimental data with the Powers & Powers model, we examined the effect of salt on aggregation with this model. As the concentration increased, our experiments showed that aggregation occurred more rapidly. If the structural nucleus size does not change, either the forward rate constant, a, or Ks should increase, tending toward the total polypeptide concentration, Xtot0, where a transition to an irreversible polymerization would occur with increasing concentration. Neither the forward rate constant nor Ks increase with the addition of more salt. Can this rate change then be attributed to a structural shift in the nucleus size with salt? If we examine the best fit constants obtained with PEA, we see that larger nucleus sizes fit the data better, ranging from n = 9 for 100mM salt to n = 39 for no salt. However, for these salt concentrations, the best fit yield Ks values are of order 10−6, which is smaller than the total polypeptide concentration and would indicate the presence of irreversible polymerization.
Due to the inability to fit the PE data and determine whether there is a change in the nucleus size or in the energetics of species interactions, we developed a model similar to the Powers model but allowing for oligomer interactions. With both the constant and the variable models, this model is able to fit the data significantly better than the Powers and Powers model and with only two fitting parameters (a and b) versus three for the Powers model (a, b, and c). This model also yielded forward rate constants two to three orders of magnitude smaller than the Powers model and one order of magnitude smaller than the classical nucleated polymerization model, as seen for PE and PEA in 50mM salts in Table 2. With oligomeric interactions creating more pathways to form fibrils, rapid aggregation will occur with smaller forward rate constants. Figure 13 shows a comparison of our model and the Powers and Powers model at the same values of a and b and illustrates quite clearly that this model yields faster fibril growth than the Powers and Powers model. Even for small nucleus sizes, the reverse reaction rate is not large, and Ks values are rarely greater than one for either the constant or variable rate models. However, best fit reverse rate constants assumed either large or small values. For smaller nucleus sizes, this model allows for high rates of aggregate growth without large forward reaction rates, i.e., the reverse rate constant can be small and still provide a good fit to the data.
Figure 13.
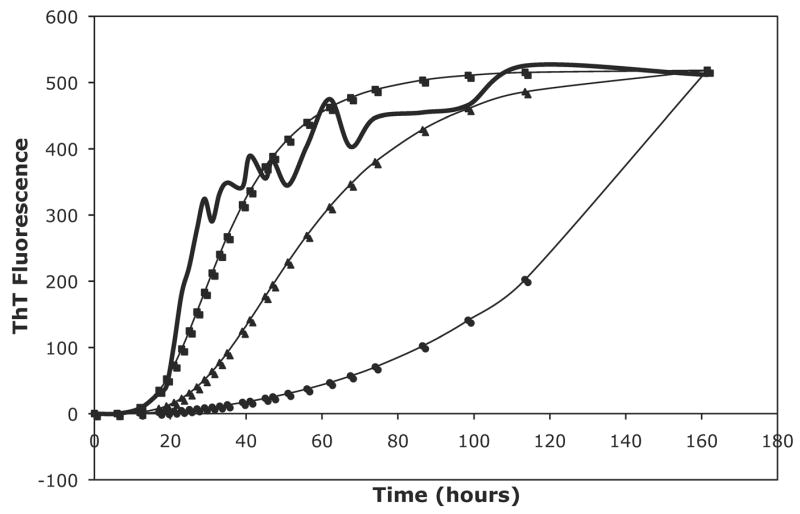
A comparison of the Powers & Powers model to both the constant and variable modified nucleated polymerization (NP) models with the same kinetic parameters. For this comparison, a nucleus size of 8 was assumed, a = 3.49e2, b = 3.05, and c = 0. The raw data is for PE grown in 50mM potassium nitrate at pH~4.1. The thick black line is the ThT fluorescence data, the squares are for the variable rate modified NP model, the triangles are for the constant rate NP model, and the circles are for the Powers & Powers model.
Another promising feature of the model presented here is that for either the constant or variable rate model, the expected trend of Ks values for aggregation in 50 mM salts holds, in contrast to the Powers and Powers model. In 50 mM salts, the aggregation rate and lag phase are quickest for PE at pH~3.6 and slowest for PE at pH~4.1, with PEA at pH~3.6 falling in the middle. Average Ks values for a variety of nucleus sizes would be expected to be smallest for PE at pH~3.6 and largest for PE at pH~4.1. As we can see in Table 2, this trend holds for our models, not for the classical nucleated polymerization or the Powers and Powers model.
Figure 4.
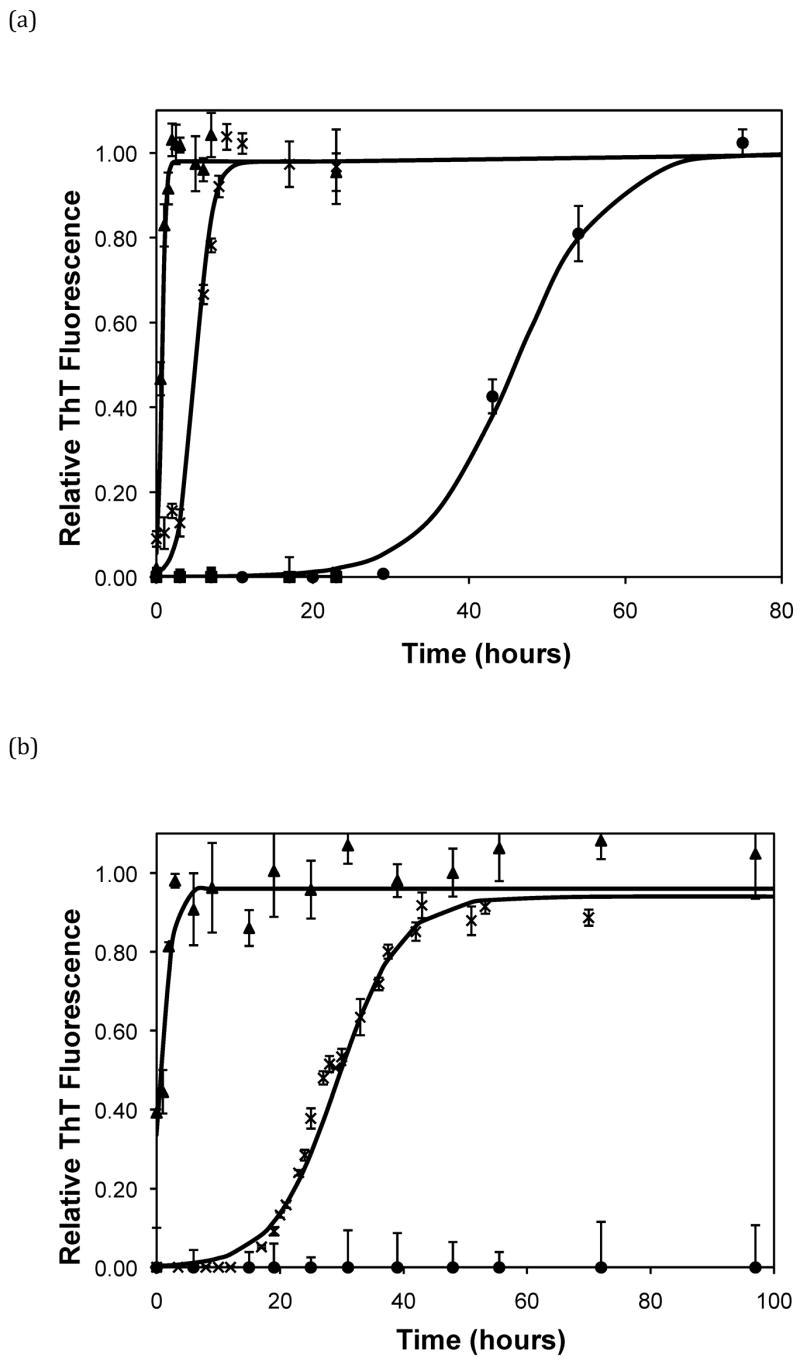
Polypeptide aggregation in 50mM sodium acetate of (a) PE and (b) PEA as a function of pH. Squares are pH 4.6, circles are pH 4.1, crosses are pH 3.6, triangles are pH 3.1. Solid fit lines for (a) and (b) are based on a hyperbolic tangent with the center shifted from the origin.
Acknowledgments
This research was supported by the National Science Foundation (Grant, BES-0432625). The authors would also like to thank Dr. Troy Cellmer and Dr. Adam Meadows for helpful discussions about protein aggregation, ThT fluorescence, and computer simulations. MC would like to thank the National Institute of Health Training Grant for financial support.
Footnotes
Publisher's Disclaimer: This is a PDF file of an unedited manuscript that has been accepted for publication. As a service to our customers we are providing this early version of the manuscript. The manuscript will undergo copyediting, typesetting, and review of the resulting proof before it is published in its final citable form. Please note that during the production process errors may be discovered which could affect the content, and all legal disclaimers that apply to the journal pertain.
References
- 1.Powers ET, Powers DL. The kinetics of nucleated polymerizations at high concentrations: Amyloid fibril formation near and above the “supercritical concentration”. Biophys J. 2006;91:122–132. doi: 10.1529/biophysj.105.073767. [DOI] [PMC free article] [PubMed] [Google Scholar]
- 2.Coluzza I, van der Vies SM, Frenkel D. Translocation boost protein-folding efficiency of double-barreled chaperonins. Biophys J. 2006;90:3375–3381. doi: 10.1529/biophysj.105.074898. [DOI] [PMC free article] [PubMed] [Google Scholar]
- 3.Huang JT, Tian J. Amino acid sequence predicts folding rate for middle-size two-state Proteins. Proteins: Structure, Function, and Bioinformatics. 2006;63:551–554. doi: 10.1002/prot.20911. [DOI] [PubMed] [Google Scholar]
- 4.Jayachandran G, Vishal V, Pande VS. Using massively parallel simulation and Markovian models to study protein folding: Examining the dynamics of the villin headpiece. Journal of Chemical Physics. 2006;124:164902/164901–164902/164912. doi: 10.1063/1.2186317. [DOI] [PubMed] [Google Scholar]
- 5.Waterhouse SH, Gerrard JA. Amyloid Fibrils in Bionanotechnology. Australian Journal of Chemistry. 2004;57:519–523. [Google Scholar]
- 6.Baldwin AJ, Bader R, Christodoulou J, MacPhee CE, Dobson CM, Barker PD. Cytochrome Display on Amyloid Fibrils. J Am Chem Soc. 2006;128:2162–2163. doi: 10.1021/ja0565673. [DOI] [PubMed] [Google Scholar]
- 7.Petkova AT, Leapman RD, Guo Z, Yau WM, Mattson MP, Tycko R. Self-Propagating, Molecular-Level Polymorphism in Alzheimer’s b-Amyloid Fibrils. Science. 2005;307:262–265. doi: 10.1126/science.1105850. [DOI] [PubMed] [Google Scholar]
- 8.Scheibel T. Protein fibers as performance proteins: new technologies and applications. Curr Opin Biotechnol. 2005;16:427–433. doi: 10.1016/j.copbio.2005.05.005. [DOI] [PubMed] [Google Scholar]
- 9.Scheibel T, Parthasarathy R, Sawicki G, Lin XM, Jaeger H, Lindquist SL. Conducting nanowires built by controlled self-assembly of amyloid fibers and selective metal deposition. Proc Natl Acad Sci U S A. 2003;100:4527–4532. doi: 10.1073/pnas.0431081100. [DOI] [PMC free article] [PubMed] [Google Scholar]
- 10.Lamm MS, Rajagopal K, Schneider JP, Pochan DJ. Laminated Morphology of Nontwisting b-Sheet Fibrils Constructed via Peptide Self-Assembly. J Am Chem Soc. 2005;127:16692–16700. doi: 10.1021/ja054721f. [DOI] [PubMed] [Google Scholar]
- 11.Schmittschmitt JP, Scholtz JM. The role of protein stability, solubility, and net charge in amyloid fibril formation. Protein Sci. 2003;12:2374–2378. doi: 10.1110/ps.03152903. [DOI] [PMC free article] [PubMed] [Google Scholar]
- 12.Nelson R, Sawaya MR, Balbirnie M, Madsen AO, Riekel C, Grothe R, Eisenberg D. Structure of the cross-b spine of amyloid-like fibrils. Nature. 2005;435:773–778. doi: 10.1038/nature03680. [DOI] [PMC free article] [PubMed] [Google Scholar]
- 13.Brown CL, Aksay IA, Saville DA, Hecht MH. Template-directed assembly of a de novo designed protein. J Am Chem Soc. 2002;124:6846–6848. doi: 10.1021/ja0261271. [DOI] [PubMed] [Google Scholar]
- 14.West MW, Wang W, Patterson J, Mancias JD, Beasley JR, Hecht MH. De novo amyloid proteins from designed combinatorial libraries. Proc Natl Acad Sci U S A. 1999;96:11211–11216. doi: 10.1073/pnas.96.20.11211. [DOI] [PMC free article] [PubMed] [Google Scholar]
- 15.Manno M, Craparo EF, Martorana V, Bulone D, San Biagio PL. Kinetics of insulin aggregation: Disentanglement of amyloid fibrillation from large-size cluster formation. Biophys J. 2006;90:4585–4591. doi: 10.1529/biophysj.105.077636. [DOI] [PMC free article] [PubMed] [Google Scholar]
- 16.Cellmer T, Douma R, Huebner A, Prausnitz J, Blanch H. Kinetic studies of protein L aggregation and disaggregation. Biophys Chem. 2007;125:350–359. doi: 10.1016/j.bpc.2006.09.010. [DOI] [PubMed] [Google Scholar]
- 17.Munishkina LA, Henriques J, Uversky VN, Fink AL. Role of protein-water interactions and electrostatics in alpha-synuclein fibril formation. Biochemistry. 2004;43:3289–3300. doi: 10.1021/bi034938r. [DOI] [PubMed] [Google Scholar]
- 18.Fawzi NL, Okabe Y, Yap EH, Head-Gordon T. Determining the critical nucleus and mechanism of fibril elongation of the Alzheimer’s A beta(1–40) peptide. J Mol Biol. 2007;365:535–550. doi: 10.1016/j.jmb.2006.10.011. [DOI] [PMC free article] [PubMed] [Google Scholar]
- 19.Nguyen HD, Hall CK. Molecular dynamics simulations of spontaneous fibril formation by random-coil peptides. Proc Natl Acad Sci U S A. 2004;101:16180–16185. doi: 10.1073/pnas.0407273101. [DOI] [PMC free article] [PubMed] [Google Scholar]
- 20.Kodaka M. Interpretation of concentration-dependence in aggregation kinetics. Biophys Chem. 2004;109:325–332. doi: 10.1016/j.bpc.2003.12.003. [DOI] [PubMed] [Google Scholar]
- 21.Naiki H, Gejyo F. Kinetic analysis of amyloid fibril formation. Amyloid, Prions, and Other Protein Aggregates. 1999:305–318. doi: 10.1016/s0076-6879(99)09022-9. [DOI] [PubMed] [Google Scholar]
- 22.Fandrich M, Dobson CM. The behaviour of polyamino acids reveals an inverse side chain effect in amyloid structure formation. The EMBO journal. 2002;21:5682–5690. doi: 10.1093/emboj/cdf573. [DOI] [PMC free article] [PubMed] [Google Scholar]
- 23.MacPhee CE, Dobson CM. Formation of Mixed Fibrils Demonstrates the Generic Nature and Potential Utility of Amyloid Nanostructures. J Am Chem Soc. 2000;122:12707–12713. [Google Scholar]
- 24.Keith HD, Giannoni G, Padden FJ. Single Crystals of Poly(L-Glutamic Acid) Biopolymers. 1969;7:775. [Google Scholar]
- 25.Keith HD, Padden FJ, Jr, Giannoni G. Crystal structures of beta-poly-L-glutamic acid and its alkaline earth salts. Journal of molecular biology. 1969;43:423–438. doi: 10.1016/0022-2836(69)90350-7. [DOI] [PubMed] [Google Scholar]
- 26.Krebs MRH, Bromley EHC, Donald AM. The binding of thioflavin-T to amyloid fibrils: localisation and implications. J Struct Biol. 2005;149:30–37. doi: 10.1016/j.jsb.2004.08.002. [DOI] [PubMed] [Google Scholar]
- 27.Bolder SG, Sagis LMC, Venema P, van der Linden E. Thioflavin T and birefringence assays to determine the conversion of proteins into fibrils. Langmuir. 2007;23:4144–4147. doi: 10.1021/la063048k. [DOI] [PubMed] [Google Scholar]
- 28.Oosawa F, Kasai M. Theory of Linear and Helical Aggregations of Macromolecules. J Mol Biol. 1962;4:10. doi: 10.1016/s0022-2836(62)80112-0. [DOI] [PubMed] [Google Scholar]
- 29.Hill TL. Length Dependence of Rate Constants for End-to-End Association and Dissociation of Equilibrium Linear Aggregates. Biophys J. 1983;44:285–288. doi: 10.1016/S0006-3495(83)84301-X. [DOI] [PMC free article] [PubMed] [Google Scholar]
- 30.Sherwood TK, Pigford RL, CR W. Mass Transfer. McGraw Hill; 1975. [Google Scholar]
- 31.Petrescu AJ, Receveur Excluded Volume of in the Configurational Distribution of a Strongly Denatured protein. Protein Sci. 1998;7:1396–1403. doi: 10.1002/pro.5560070616. [DOI] [PMC free article] [PubMed] [Google Scholar]
- 32.Levene PA, HS S. Calculation of Isoelectric Points. J Biol Chem. 1923;55:801–813. [Google Scholar]


