

Abstract
Neuroimaging studies of cholinesterase inhibitor (ChEI) treatment in Alzheimer’s disease (AD) indicate that the short and long term actions of ChEIs are dissimilar. fMRI studies of the ChEI rivastigmine have focused on its short term action. In this exploratory study the effect of prolonged (20 weeks) rivastigmine treatment on regional brain activity was measured with fMRI in patients with mild AD. Eleven patients with probable AD and nine age-matched controls were assessed with a Pyramids and Palm Trees semantic association and an n-back working memory fMRI paradigm. In the patient group only, the assessment was repeated after 20 weeks of treatment. There was an increase in task-related brain activity after treatment with activations more like those of normal healthy elderly. Behaviorally, however, there were no significant differences between baseline and retest scores, with a range of performance probably reflecting variation in drug efficacy across patients. Variable patient response and drug dynamic/kinetic factors in small patient groups will inevitably bias (either way) the effect size of any relevant drug related changes in activation. Future studies should take drug response into account to provide more insight into the benefits of ChEI drugs at the individual level.
Keywords: fMRI, rivastigmine, treatment, dementia, Alzheimer’s disease
Introduction
Brain imaging has gained some credibility in the last decade, at least in research settings, in the evaluation of the effects of cholinesterase inhibitor (ChEI) treatment in Alzheimer’s disease (AD) (see Venneri 2007 for a recent review). The modest beneficial effects of ChEIs on certain cognitive and behavioural symptoms typical of AD have been established in several clinical trials (Birks et al 2000a, 2000b; Wilcock et al 2000). These studies generally overlooked the marked variation in the degree of clinical response and failed to clarify the reasons for more substantial clinical benefit in some patients. Positron emission tomography (PET) and single photon emission computed tomography (SPECT) studies have established that increases in brain blood flow, metabolism, and preservation of receptor function in regions of the cerebral cortex seem to follow a favorable response to treatment (Potkin et al 2001; Nobili et al 2002a, 2002b; Venneri et al 2002; Lojkowska et al 2003; Stefanova et al 2006; Kadir et al 2007). In some instances, a correlation between clinical improvements and regional increases in brain blood flow or metabolism in task meaningful areas has been found (Venneri and Shanks 2002; Kadir et al 2006). In most cases, however, any link between cognitive improvements and changes in parameters of cerebral function has been only indirectly established.
In an attempt to overcome this limitation a few small studies have used functional magnetic resonance imaging (fMRI) with cognitive activation paradigms to potentially establish a direct link between cholinergic enrichment and improved task related brain activation. For example, two small groups of patients with AD were scanned with fMRI before and after a single cholinergic challenge with a dose of rivastigmine. One group was tested with a face encoding paradigm, while the other was tested with a working memory paradigm (Rombouts et al 2002). Both groups showed increased regional activation in task relevant areas after receiving the drug. These observations were taken as evidence that the increased performance on the cognitive tests recorded in clinical studies was most likely an indication of a specific effect of rivastigmine on neuronal activity. Similar findings have been reported in an fMRI study with patients with mild cognitive impairment (MCI) and in patients with AD following a few weeks of treatment with the ChEI donepezil (Saykin et al 2004; Kircher et al 2005).
Most of this research, however, involved assessment after either an acute challenge or only a few weeks of treatment with a ChEI. Short treatment periods are inconsistent with clinical studies and might not sufficiently clarify the mechanisms underlying clinical change. For example, when the effects of acute, repeated and prolonged treatment have been examined with fMRI, the results appear to indicate that the short term and long term actions of this class of drugs are dissimilar. Evidence of this kind is available for galantamine but not for the other two ChEIs. Single dose challenge and five day treatment with galantamine in MCI and AD have given disparate results which may not only reflect experimental variables, but may also disclose important pharmacokinetic information. In one study of MCI, increases in brain activation were found after the five day treatment, but not after an acute challenge with galantamine (Goekoop et al 2004). A subsequent study on MCI and AD, by the same authors, showed that significant increases in brain activation were only present after an acute single dose challenge, but not after more prolonged exposure to galantamine, which in this case caused decreases in brain activation (Goekoop et al 2006). In contrast, increased brain activation was reported in patients with MCI when they were reassessed with a navigation fMRI paradigm after seven day treatment with galantamine (Gron et al 2006). Only one study has reported effects on brain activation following treatment with galantamine for a period comparable with the brain blood flow and metabolism studies. There was a modest restoration of regional task relevant brain activation for both the fMRI paradigms (testing semantic and attention skills) used, which was paralleled by a minor, statistically not significant, improvement in behavioral scores (Shanks et al 2007). This research evidence flags up the importance of taking into account a pharmacokinetic trajectory, which may be uniquely characteristic of a given ChEI, in order to establish the time course of measurable effects on the chosen brain parameters and to better ensure that imaging variables represent a valid surrogate outcome measure of drug efficacy in AD.
The aim of this small exploratory study, therefore, was to investigate the action of prolonged (over 20 weeks) treatment with rivastigmine on the blood oxygenation level dependent (BOLD) signal measured by fMRI in patients with mild AD.
Methods
Participants
The participants were eleven patients with probable AD and nine elderly age-matched controls. The patients with AD were selected from approximately one hundred patients with memory problems referred to an old age psychiatry memory clinic. The patients had psychiatric assessment, neurological examination, extensive neuropsychological screening and structural MRI scanning. All patients entering the fMRI study fulfilled the NINCDS-ADRDA criteria for probable AD (McKhann et al 1984) of minimal to mild severity and none had radiological evidence of ischemic brain disease. Those patients in the minimal stage did not meet the criteria for mild cognitive impairment (MCI) (Petersen et al 1997) as all showed typical progressive cognitive decline during clinical follow ups and had significant deficits in activities of daily living. Exclusion criteria included claustrophobia, Hachinski Ischemia scale score greater than four (Hachinski et al 1975), Mini Mental State Examination (MMSE) scores of less than 18/30 (Folstein et al 1975), other types of degenerative or secondary dementia as assessed with current clinical diagnostic criteria (Roman et al 1993; Brun et al 1994; McKeith et al 1996). The AD group consisted of seven males and four females between the ages of 69 and 95, with a mean age of 79.00 (SD 7.44). Their education ranged from 9 to 17 years (mean 11.55, SD 3.27). The elderly control group included three males and six females between the ages of 72 and 77 with a mean age of 75.11 (SD 1.62) and with education between 10 and 17 years (mean 11.67, SD 2.29). Elderly controls were recruited from a panel of healthy participants with no history of neurological or psychiatric illness, who had been volunteering to take part in research for a number of years and for whom extensive longitudinal cognitive assessment was available. All individuals in this group scored 27/30 or greater on the MMSE. The participants were all right handed. Consent was obtained from each participant prior to the experiment and ethical approval was granted by the regional Ethics Committee. Two patients withdrew consent to reassessment with fMRI. The patients were both female aged 69 and 76, with similar educational background and their MMSE scores were 21 and 26.
Assessments
Clinical and neuropsychological
Each of the patients completed a comprehensive neuropsychological test battery, as well as MMSE, the Alzheimer’s Disease Assessment Scale cognitive subscale (ADAS-Cog), the Neuropsychiatric Inventory (NPI) with caregiver distress scale, the Geriatric Depression Scale (GDS), Activities of Daily Living (ADL) scale completed by patient and caregiver independently, as well as the Clinician’s Interview-Based Impression of Change – Plus (CIBIC-Plus) at baseline and at retest after twenty weeks treatment. Following baseline diagnostic and research assessment the patients began treatment with rivastigmine, and the dosage titrated according to recommended guidelines. Stable dosing was achieved at 6 mg twice daily for all patients.
fMRI
All patients and the elderly controls were assessed with two cognitive activation fMRI paradigms (see below) at baseline, and the assessment was repeated after 20 weeks treatment in the patient group. During the selection process the elderly controls and patients with AD were acquainted with the MRI environment and the task requirements in a full size MRI simulator. Patients and healthy participants were also presented with examples of the stimuli (both activation and baseline conditions) on sheets of card and reminded of the instructions immediately before active scanning. Once the patients and controls were relaxed in the scanner and familiar with the procedure, the experiment began.
fMRI acquisition and analysis
Echo planar imaging was carried out on a GE 1.5T Signa Cvi system (TR = 2500 ms, TE = 35 ms, flip angle α = 90°, voxel size = 1.88 × 1.88 mm in plane resolution). One hundred and twenty sets of 23 contiguous 5 mm thick axial images were acquired twice for both the semantic association task and the working memory task. Stimulus presentation was driven by a PC with a purpose devised program written using Presentation for Windows. Stimuli were projected via an Epson LCD projector onto a screen viewable with a mirror attached to a standard head coil. The participants were equipped with a fibre optic response device in both the left and right hand for recording behavioural responses. An experimental paradigm which followed a block design was used in both tasks. Total time in the scanner for the two activation paradigms, localizer and T1 weighted axial images was approximately 30 minutes.
Imaging data were analyzed using Statistical Parametric Mapping (SPM2) image analysis software (Wellcome Department of Imaging Neuroscience, London). All volumes from each subject were re-aligned and re-sliced using sinc interpolation methods to adjust for residual motion related signal changes. Images were spatially normalized to the standard EPI template available in SPM2 using nonlinear estimation of parameters. Normalized images were then spatially smoothed with an 8 mm full width at half maximum isotropic Gaussian kernel to compensate for any residual variability after spatial normalization. A boxcar waveform convolved with a synthetic hemodynamic response function (HRF) was used as the reference waveform for each condition. Proportional scaling was applied to remove any within subject difference in blood flow. Image data were high-pass filtered with a set of discrete cosine basis functions with a cut-off period of 128 s. Head motion parameters were included as regressors in the first level analyses. The second level group analyses were carried out using the contrast images generated at the individual level analysis. Individual group analyses were carried out with one sample t-tests, within group baseline-after treatment comparisons were completed with paired sample t-tests, and between group comparisons with independent sample t-tests. For both fMRI paradigms there are a number of published studies which can be used as a reference for the areas which should be significantly activated. Based on a priori hypotheses, threshold was adjusted in the elderly group to p < 0.02 corrected for the semantic association task and p < 0.005 corrected for the working memory task. For the within and between group comparisons a threshold of p < 0.05 corrected was chosen for both tasks. Unless otherwise specified these thresholds were used for all the results reported below. Age was included as a covariate in the fMRI analyses. Anatomical regions were identified using the Talairach Daemon Client (http://ric.uthscsa.edu/projects/tdc/), following appropriate conversion of the Montreal Neurological Institute coordinates extracted from the SPM analysis into Tailarach coordinates.
fMRI paradigms
Semantic association task
The paradigm followed a block design with two alternating conditions (activation and baseline). The stimuli for the activation conditions were selected from the word version of the Pyramids and Palm Trees Test (Howard and Patterson 1992). The word version of this test was used because it had lower perceptual demands than the picture version. The test stimuli were presented on a white background as in the original configuration except for presenting the target word in blue and the alternative choices in red to facilitate discrimination between the target element and the alternative choices. The participant responded by pressing the button corresponding to their choice either with the left or right hand.
The baseline task consisted of nonword stimuli with a configuration similar to those of the active condition and the participant had to make a simple visual discrimination by responding to the stimulus marked with a star. This simple perceptual judgment was chosen after extensive pilot testing showed that this task was easier to understand for the patients and clearly differed from the requirements of the active condition. In both activation and baseline conditions the number of appropriate left and right responses was balanced. Instructions for each condition were presented for five seconds, followed by the test stimuli. The presentation screen was white and the instructions were displayed in a black Times New Roman font type. The stimuli were on screen for 4500 ms, with an inter-stimulus interval of 500 ms and remained on screen even after a response had been made. Nine stimuli for each condition were presented in each epoch. This cycle of active and baseline conditions was repeated three times in each run. The order of the conditions was fixed. Each condition lasted 50 seconds. Total scanning time for each run was five minutes. Ten seconds of dummy scans were acquired before each run to enable the scanner to reach equilibrium.
Working memory task
In this paradigm a series of letters were presented. There were two conditions, the first (the baseline condition) included a five second presentation of instruction followed by 18 letters presented serially (in the centre of the screen) for 2000 ms each, with a blank screen inter-stimulus interval of 500 ms. The participant had to attend to the letters and press the response button only when the letter X was presented. The light working memory load (activation) condition began with a five second instruction screen followed by 18 single letter stimuli. Each was presented for 2000 ms with a blank screen inter-stimulus interval of 500 ms. In this activation condition participants were instructed to respond every time a letter was repeated in the sequence (1-back task). Only consonants were used. This cycle of baseline and activation conditions was repeated three times in each run. The order of the two conditions was fixed. Each condition lasted 50 seconds. Total scanning time for each run was five minutes. Ten seconds of dummy scans were acquired before each run to enable the scanner to reach equilibrium.
Results
Independent samples t-tests revealed no significant differences in age and education between the elderly control group and the patient group (t(8.782) = 2.140; ns and t(16) = .241; ns respectively). As expected the MMSE scores of the elderly group (mean 28.89, SD 0.93) were significantly higher (t (9.368) = −4.754, p < 0.001).
The elderly group performed at a high level on the semantic association task (mean percentage correct 84.57, SD 6.74, mean response time 1906.17 ms, SD 213.65 ms) and the working memory task (mean percentage correct 98.86, SD 3.21, mean response time 486.97 ms, SD 80.34 ms).
Clinical and behavioral assessment in the AD group
Paired sample t-test analyses showed that the only significant difference between the mean scores obtained by the patients at baseline and retest after treatment, on the cognitive tests and clinical scales was that on the ADAS-cog (t8 = 5.308; p < 0.001), scale on which there was an improvement (Table 1).
Table 1.
Mean (and standard deviation) scores obtained by the AD patients on the cognitive tests, clinical scales and during the fMRI tasks, before and after 20 weeks of treatment with rivastigmine
| Cognitive tests | Baseline | Retest |
|---|---|---|
| Mini Mental State Examination | 23.67 (3.16) | 24.89 (3.30) |
| ADAS–Cog* | 19.44 (4.25) | 15.22 (5.50) |
| Raven progressive matrices | 24.44 (3.84) | 25.29 (3.20) |
| Paired associate learning | 9.22 (2.39) | 9.71 (2.14) |
| Confrontation naming | 18.22 (1.72) | 18.86 (1.07) |
| Stroop test | ||
| Error interference score | 1.63 (2.00) | 1.33 (2.16) |
| Time interference score (s) | 36.06 (11.79) | 40.50 (24.07) |
| Clinical scales | ||
| Neuropsychiatric Inventory | 15.89 (15.62) | 11.11 (10.60) |
| Geriatric Depression Scale | 2.00 (1.85) | 2.29 (1.89) |
| Activities of Daily Living | ||
| Patient assessment | 25.38 (3.81) | 24.00 (2.88) |
| Carer assessment | 23.14 (5.49) | 22.63 (5.18) |
| CIBIC–Plus | 3.11 (0.93) | |
| fMRI behavioral tasks | ||
| Semantic association task | ||
| Percentage correct | 65.64 (21.08) | 61.94 (24.43) |
| Reaction times (ms) | 2460.42 (572.54) | 2581.52 (423.89) |
| Working memory task | ||
| Percentage correct | 90.34 (25.53) | 95.45 (6.43) |
| Reaction times (ms) | 628.74 (299.84) | 575.07 (195.34) |
Notes: Significantly different from baseline at p < 0.001.
On the semantic association fMRI task, the baseline mean percentage correct score was 65.64 (SD 21.08) with a range from 33.33 correct to 85.19, and after treatment the mean percentage correct score was 61.94 (SD 24.43) with a range from 22.22 to 87.04. Although there was a slight decrease in the mean behavioral score at retest after treatment, no significant differences from baseline emerged from the analysis (t8 = .541, ns). There was a variable response to treatment in the group, however, with individual variations from baseline score ranging from a −37.03 % reduction to a 35.19 % increase at retest.
On the working memory task the group mean score increased from baseline (mean score 90.34, SD 25.53, range 27.27 to 100) to retest (mean score 95.45, SD 6.43, range 81.82 to 100), but the difference was not significant (t7 = −0.72, ns) (see Table 1). A variable response to treatment was again observed. Individual variations from baseline scores ranged from a −4.45 % reduction to a 54.55 % increase at retest.
After treatment, there was an increase in mean response times compared to the baseline times for the semantic association task, but the difference was not significant (t8 = −1.331, ns). A decrease in response time was present for the working memory task; the difference, however, was also not significant (t7 = 1.038, ns) (see Table 1).
Semantic association task – fMRI results
Elderly group
Significant activation was found in the left prefrontal cortex, the left superior parietal lobule, and the precuneus. Significant decreases in activation were found in right temporal regions, inferior parietal areas bilaterally, right middle frontal areas, the anterior cingulate gyrus bilaterally and the left insula (Table 2a and Figure 1a).
Table 2.
a) Areas of significant differences in brain activation and deactivation in the elderly and in the AD patients (before and after 20 weeks of treatment with rivastigmine) during the semantic association task. b) Direct within group and between comparisons
| a) | ||||||
|---|---|---|---|---|---|---|
| Brain area | Left/right | Brodmann’s area | Talairach coordinates |
Z value at local maximum* | ||
| x | y | z | ||||
| Elderly – activations | ||||||
| Inferior frontal gyrus | L | 47 | −53 | 21 | −3 | 3.48 |
| Middle frontal gyrus | L | 46 | −44 | 21 | 25 | 4.93 |
| Superior parietal lobule | L | 7 | −34 | −70 | 46 | 4.27 |
| Precuneus | L | 7 | −24 | −71 | 53 | 3.27 |
| Elderly – deactivations | ||||||
| Inferior parietal lobule | L | 40 | −50 | −28 | 22 | 4.50 |
| Insula | L | 13 | −44 | −4 | −1 | 4.15 |
| Anterior cingulate | L | 10 | −6 | 38 | −7 | 3.86 |
| Middle frontal gyrus | R | 11 | 18 | 38 | −14 | 4.26 |
| Anterior cingulate | R | 32 | 20 | 39 | 0 | 3.85 |
| Postcentral gyrus | R | 40 | 63 | −24 | 16 | 5.33 |
| Middle temporal gyrus | R | 21 | 55 | −2 | −8 | 4.07 |
| Inferior parietal lobule | R | 40 | 65 | −30 | 25 | 4.30 |
| AD (baseline) – activations | ||||||
| Middle frontal gyrus | L | 9, 6, 46 | −42 | 13 | 27 | 5.50 |
| AD (baseline) – deactivations | ||||||
| Precuneus | R | 31 | 8 | −49 | 32 | 4.24 |
| Cuneus | R | 19 | 12 | −78 | 30 | 4.28 |
| AD (after treatment) – activations | ||||||
| Middle frontal gyrus | L | 46 | −40 | 19 | 23 | 4.04 |
| Superior frontal gyrus | L | 11 | −12 | 50 | −13 | 4.15 |
| Inferior frontal gyrus | R | 47 | 30 | 29 | −5 | 5.06 |
| AD (after treatment) – deactivations | ||||||
| Postcentral gyrus | R | 3, 43 | 65 | −12 | 25 | 4.26 |
| Supramarginal gyrus | R | 40 | 57 | −39 | 30 | 6.22 |
| b) | ||||||
| Brain area | Left/right | Brodmann’s area |
Talairach coordinates |
Z value at local maximum | ||
| x | y | z | ||||
| AD baseline versus AD after treatment (masking for deactivation in AD group after treatment) | ||||||
| No significant differences | ||||||
| AD after treatment versus AD baseline | ||||||
| Inferior frontal gyrus | L | 13, 47 | −32 | 12 | −16 | 2.76 |
| Middle frontal gyrus | L | 11 | −24 | 40 | −2 | 2.69 |
| Paracentral lobule | L | 5 | 0 | −34 | 54 | 3.15 |
| Postcentral gyrus | L | 5 | −32 | −44 | 60 | 2.95 |
| Parahippocampal gyrus | L | 35 | −24 | −30 | −30 | 3.01 |
| Middle temporal gyrus | L | 21 | −52 | −48 | −8 | 3.66 |
| Fusiform gyrus | L | 20 | −30 | −38 | −28 | 3.06 |
| Middle frontal gyrus | R | 47 | 28 | 36 | −8 | 3.88 |
| Superior frontal gyrus | R | 11 | 14 | 46 | −10 | 2.94 |
| Paracentral lobule | R | 31 | 4 | −24 | 42 | 3.01 |
| Parahippocampal gyrus | R | 36 | 18 | −38 | −22 | 3.10 |
| Fusiform gyrus | R | 20 | 36 | −36 | −22 | 3.21 |
| Elderly versus AD baseline | ||||||
| Precuneus | L | 7 | 0 | −54 | 47 | 3.35 |
| Elderly versus AD after treatment | ||||||
| No significant differences. | ||||||
| AD baseline versus elderly (masking for deactivation in elderly controls) | ||||||
| Caudate nucleus (Body) | L | −4 | 22 | 8 | 2.99 | |
| Middle frontal gyrus | R | 46 | 44 | 24 | 17 | 3.01 |
| Caudate nucleus (Body) | R | 14 | 20 | 16 | 2.81 | |
| AD after treatment versus elderly (masking for deactivation in elderly controls) | ||||||
| Anterior cingulate | L | 32 | −16 | 39 | 13 | 3.67 |
| Inferior frontal gyrus | R | 47 | 24 | 29 | −10 | 3.94 |
Notes: Z scores which correspond to p values corrected for multiple comparisons are highlighted in bold.
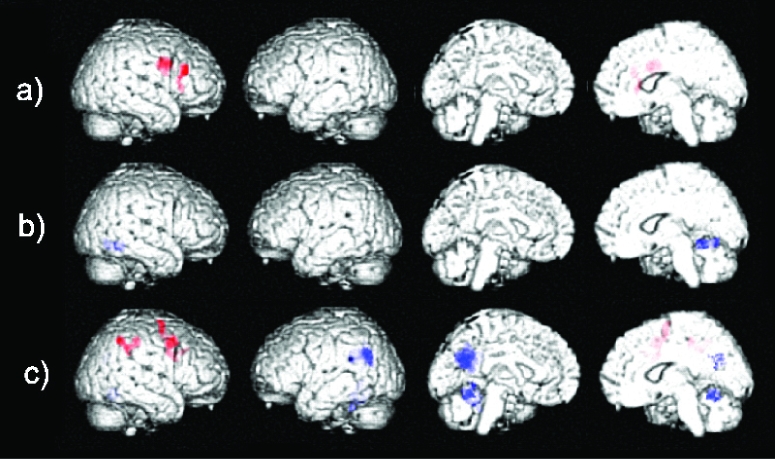
Figure 1.

Areas of significant increases (red) and decreases (blue) in brain activation in the semantic association task detected in a) healthy elderly and in patients with AD b) before and c) after 20 weeks of treatment with rivastigmine.
AD group
Before treatment the AD patients had one cluster of significant activation, the maxima of which were in the left middle frontal gyrus. Significant decreases were present in posterior regions including the right cuneus and precuneus (Table 2a and Figure 1b). After treatment with rivastigmine significant activation was present in broadly the same locations, eg, the left prefrontal cortex, but the pattern of activation was now more extensive, including the left superior frontal gyrus and the right inferior frontal gyrus (Table 2a). Significant activation was also seen in the orbitofrontal cortex and the anterior cingulate gyrus bilaterally, areas which were not activated at baseline (Figure 1c). Significant decreases in signal after treatment were found in the right supramarginal gyrus and the right postcentral gyrus.
A direct comparison between the after treatment and baseline images in the AD group, although not surviving correction for multiple comparisons, identified a number of regions which had significantly increased in activation after treatment. The locations of these areas were consistent with sites which published fMRI studies have reported as significantly activated by healthy controls when performing a semantic association paradigm similar to that used in the present study. Increased activation was found in the left inferior frontal gyrus, the left middle temporal gyrus, the right superior frontal gyrus and in the middle frontal, the fusiform and the parahippocampal gyri bilaterally (Table 2b, Figure 2a). The baseline versus retest comparison showed no differences surviving a corrected threshold of significance. Differences were present in the right postcentral gyrus and the right inferior parietal lobule at an uncorrected threshold level. To check whether these differences were due to greater deactivation in the AD group after treatment, the deactivation pattern from the random effects analysis was used as a mask (ie, significant areas of deactivation were used as a mask in the analyses to ensure that any significant differences referred only to actual increases in activation). After masking for deactivation, these differences were no longer detectable.
Figure 2.

Differences in activation between a) AD after treatment versus AD baseline, and between b) healthy elderly versus AD patients at baseline in the semantic association task.
Elderly/AD group comparisons
Statistical comparisons were performed between the healthy elderly group and the AD group both before and after treatment. These analyses were carried out to see whether any drug induced change resulted in restoration of age normal regional function. The direct comparison between the activation maps of the elderly group and those of the AD patients at baseline showed significant differences with lower levels of activation in the left precuneus in AD (Table 2b and Figure 2b). The difference in activation in this region was no longer detectable when the AD patients’ post-treatment scans were used in the analysis.
Conversely, at baseline the AD group showed more activation than the elderly controls in the right middle frontal gyrus and the caudate bilaterally (corrected for multiple comparisons and when masking for deactivation in the elderly group) (Table 2b).
After treatment, significantly higher levels of activation in the AD group than the controls were found in the right inferior frontal gyrus and the left anterior cingulate (at the corrected level and when masking for deactivation in the elderly group) (Table 2b).
Working memory task – fMRI results
Elderly group
Significant activation was present in the right middle frontal gyrus, insula and precentral gyrus. No significant decreases in signal were found when correcting for multiple comparisons (Table 3a and Figure 3a).
Table 3.
a) Areas of significant differences in brain activation and deactivation in the elderly and in the AD patients (before and after 20 weeks of treatment with rivastigmine) during the working memory task. b) Direct within and between group comparisons
| a) | ||||||
|---|---|---|---|---|---|---|
| Brain area | Left/right | Brodmann’s area | Talairach coordinates |
Z value at local maximum* | ||
| x | y | z | ||||
| Elderly – activations | ||||||
| Middle frontal gyrus | R | 9, 46 | 36 | 11 | 25 | 3.64 |
| Precentral gyrus | R | 6 | 48 | 1 | 28 | 4.34 |
| Insula | R | 13 | 32 | 23 | 3 | 3.79 |
| Elderly – deactivations | ||||||
| No significant deactivation at corrected level. | ||||||
| AD (baseline) – activations | ||||||
| No significant activation | ||||||
| AD (baseline) – deactivations | ||||||
| Parahippocampal gyrus | R | 19, 37 | 30 | −53 | −7 | 3.99 |
| Fusiform gyrus | R | 19 | 26 | −63 | −7 | 4.29 |
| AD (after treatment) – activations | ||||||
| Middle frontal gyrus | R | 8, 6 | 48 | 12 | 44 | 4.12 |
| Precentral gyrus | R | 9 | 42 | 8 | 38 | 3.83 |
| Postcentral gyrus | R | 40 | 40 | −29 | 44 | 3.95 |
| Inferior parietal lobule | R | 40 | 53 | −46 | 45 | 4.14 |
| AD (after treatment) – deactivations | ||||||
| Middle temporal gyrus | L | 39 | −46 | −57 | 25 | 4.03 |
| Superior temporal gyrus | L | 13 | −36 | −47 | 26 | 3.23 |
| Supramarginal gyrus | L | 40 | −57 | −57 | 29 | 3.36 |
| Precuneus | L | 7 | −16 | −54 | 40 | 3.16 |
| Posterior cingulate | L | 30, 31 | −6 | −52 | 17 | 4.73 |
| Cerebellum (Culmen) | L | 0 | −53 | −9 | 3.62 | |
| Cerebellum (Culmen) | R | 18 | −55 | −7 | 3.56 | |
| b) | ||||||
| Brain area – Brodmann area (BA) | Left/right | Brodmann’s area |
Talairach coordinates |
Z value at local maximum | ||
| x | y | z | ||||
| AD baseline versus AD after treatment (masking for deactivation in AD after treatment) | ||||||
| Middle frontal gyrus | L | 6 | −32 | 2 | 39 | 2.68 |
| Precentral gyrus | L | 4, 6 | −61 | −3 | 13 | 3.11 |
| Cingulate gyrus | L | 31 | −24 | −27 | 40 | 2.61 |
| Insula | L | 13 | −42 | −3 | 11 | 2.96 |
| Thalamus | L | −20 | −21 | 16 | 2.75 | |
| AD after treatment versus AD baseline | ||||||
| Inferior frontal gyrus | R | 9 | 46 | 5 | 27 | 2.59 |
| Middle frontal gyrus | R | 9, 6 | 44 | 12 | 38 | 3.04 |
| Superior frontal gyrus | R | 6 | 22 | −8 | 65 | 2.60 |
| Medial frontal gyrus | R | 6 | 6 | −16 | 65 | 2.62 |
| Precentral gyrus | R | 6 | 18 | −18 | 65 | 2.68 |
| Elderly versus AD baseline | ||||||
| Fusiform gyrus | L | 37 | −46 | −39 | −8 | 3.52 |
| Precuneus | L | 39, 19 | −42 | −68 | 35 | 3.81 |
| Elderly versus AD after treatment | ||||||
| Angular gyrus | L | 39 | −40 | −72 | 33 | 3.53 |
| Posterior cingulate | L | 30, 31 | −6 | −52 | 17 | 5.06 |
| AD baseline versus elderly (masking for deactivation in elderly controls) | ||||||
| Thalamus | L | −6 | −7 | 21 | 3.03 | |
| Caudate nucleus (Body) | L | 0 | 12 | 16 | 2.61 | |
| Cingulate gyrus | R | 31 | 12 | −22 | 34 | 2.80 |
| AD after treatment versus elderly (masking for deactivation in elderly controls) | ||||||
| Middle frontal gyrus | R | 6, 8, 9 | 34 | 1 | 53 | 3.34 |
| Postcentral gyrus | R | 2, 40 | 55 | −25 | 42 | 3.50 |
| Supramarginal gyrus | R | 40 | 55 | −41 | 35 | 4.09 |
Notes: Z scores which correspond to p values corrected for multiple comparisons are highlighted in bold.
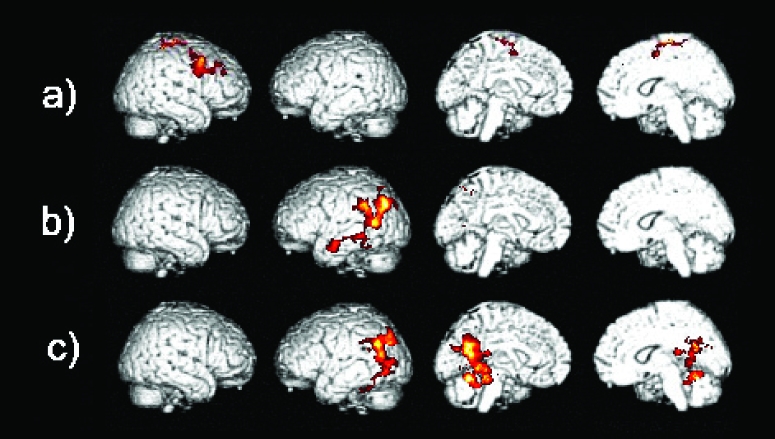
Figure 3.
Areas of significant increases (red) and decreases (blue) in brain activation in the working memory task detected in a) healthy elderly and in patients with AD b) before and c) after 20 weeks of treatment with rivastigmine.
AD group
No areas of significant activation were found in the baseline images of the AD patients at the chosen corrected threshold of significance. Significant decreases in signal were found in the right fusiform gyrus and the right parahippocampal gyrus (Table 3a and Figure 3b). After treatment, there were clusters of significant activation were larger, that survived correction for multiple comparisons and these included the right middle frontal gyrus, the precentral gyrus, postcentral gyrus, and inferior parietal lobule. Decreases in signal were also more extensive and included the left cingulate gyrus, middle temporal gyrus, superior temporal gyrus, precuneus, supramarginal gyrus, and the cerebellum bilaterally (Table 3a and Figure 3c).
Direct within subject comparisons of the image data from the AD patients at retest after treatment to those acquired at baseline showed significant differences in signal in the right inferior, middle, superior, and medial frontal gyri, in addition to the right precentral gyrus (Table 3b and Figure 4a). Conversely, the baseline versus retest comparison showed significant differences in left hemispheric areas, such as the precentral gyrus, middle frontal gyrus, insula, cingulate gyrus, and thalamus (when masking for deactivation in the AD group after treatment) (Table 3b).
Figure 4.
Differences in activation between a) AD after treatment versus AD baseline, and between healthy elderly versus AD patients at b) baseline and c) after treatment in the working memory task.
Elderly/AD group comparisons
The comparison of the elderly controls to the patients at baseline showed that the elderly activated the left precuneus and fusiform gyrus to significantly higher levels than the patients (Table 3b and Figure 4b). When the same comparison was carried out with the images of the AD patients acquired after treatment the elderly activated the left posterior cingulate and angular gyrus to a significantly higher level than the patients (Table 3b and Figure 4c).
When the baseline images of the AD patients were compared to those of the elderly control group significant differences were present and lower levels of activation were seen in the right cingulate gyrus, the left caudate and the left thalamus (when masking for deactivation in the elderly) (Table 3b). The AD patients after treatment activated the right middle frontal gyrus, postcentral gyrus, and supramarginal gyrus to higher levels than the elderly group (when masking for deactivation in the elderly) (Table 3b).
Discussion
Prolonged cholinesterase inhibitor treatment in patients with AD altered task related brain activity and the pattern of activity post-treatment appeared more like that of normal healthy elderly participants. At the behavioral level, the response was not uniform. There was a small non significant decrease in mean score and a lengthening of mean response time on the semantic task and a small, again non significant, increase in mean score and a shortening of mean response time on the working memory task. The range of behavioral response on the tasks probably reflected variation in drug efficacy across patients. Some people responded favorably to treatment, judging by their behavioral scores on the tasks and others did not. These variations in drug response probably weakened the collective detectable brain activation pattern of change in the group.
Semantic association task
Treatment increased levels of activation in areas involved with semantic processing. The significant cluster of activation in the left prefrontal cortex was larger after treatment, and the increase in activation in the left frontal cortex was confirmed in the direct before and after treatment within subject comparison. Increases in activation were detectable in the left inferior and middle frontal gyri, areas of the right prefrontal cortex, the left fusiform gyrus and the parahippocampal gyrus bilaterally. The activation of these areas has been reported in other neuroimaging studies in which the neural substrate of semantic processing has been studied in healthy people (Vandenberghe et al 1996; Price et al 1999; Ricci et al 1999; Sabsevitz et al 2005; Vandenbulcke et al 2007), which suggests that treatment was increasing activation in task relevant areas. The comparisons with the elderly showed that the AD patients after treatment had increased levels of activation in the left precuneus, to a level that the initial group difference in this area, present at baseline, was now no longer detectable. Treatment appeared, therefore, to have restored brain activity in this area to an age normal level. After treatment, the AD group also activated areas in the left hemisphere (in the temporal lobe) which are normally associated with verbal semantic memory tasks (Davies et al 2004; Baldo et al 2006), to higher levels than the healthy elderly controls.
Although the AD patients showed increased activation in parts of the cortex thought to be involved in semantic processing, on average the behavioral scores decreased after treatment. Not all patients showed a decrement in behavioral scores following treatment, however. On the contrary, some showed remarkable improvements with treatment, while others did not. The range of change in behavioral scores on the semantic association task was large and might well have influenced the overall pattern of brain activation seen at retest. The small sample size, however, does not provide enough statistical power to compute separate behavioral and imaging analyses for subgroups of patients responding and non responding to treatment.
Working memory task
The elderly participants activated the right prefrontal cortex, a brain region known to play a significant role in attention and visual working memory (Posner and Raichle 1997; Courtney et al 1998; Faw 2003). This aspect of right dorsolateral prefrontal cortex function would likely be a contributor to successful completion of the working memory task as the letter stimulus became a target only when it matched the previous letter. When presented, each letter would have been held in visual working memory temporarily. This strategy might have been sufficient for the elderly controls to perform this task accurately, given that this condition had a very low working memory load in healthy individuals. N-back tasks with higher working memory loads, instead, appear to involve areas associated with phonological rehearsal and storage (Awh et al 1996; Braver et al 1997; Veltman et al 2003).
The patients with AD, after receiving treatment, activated the right middle frontal gyrus more extensively than at baseline. The right parietal cortex, which has a significant role in the orientation of attention (Corbetta et al 1995), was also activated after treatment. Direct comparison of the AD patients’ images after treatment with the pre-treatment images showed significant increased activation in the right prefrontal cortex. This increased activation following treatment with rivastigmine is task appropriate and overlaps with the area that was activated by healthy elderly. In terms of behavior, the increase in mean score after treatment was modest, and the difference between baseline and retest was not significant. In the same way, a previous fMRI study of mild cognitive impairment found increases in brain activation (after 5 days of treatment with galantamine), but no significant behavioral improvement on a face encoding task or when 0 and 1-back working memory task conditions were compared separately with baseline (Goekoop et al 2004). In the working memory task, as in the semantic task, the range of behavioral response was variable. Some people showed substantial increases and others decreases in performance after treatment. Variation in drug efficacy is an important confounding variable which should be taken into account when interpreting such data.
Conclusion
The evidence from this exploratory fMRI study of AD patients receiving rivastigmine treatment for a clinically relevant period supports the conclusions from a similar study using galantamine (Shanks et al 2007). Variable patient response to treatment and drug dynamic and kinetic factors in small groups of patients studied with fMRI will inevitably bias (either way) the effect size of any relevant drug related changes in BOLD signal. Clinical diagnosis is always provisional and diagnostic heterogeneity cannot be completely ruled out in clinical samples. At the same time, when a multifactorial approach to clinical diagnosis is used, diagnostic errors are minimized and in research samples diagnostic accuracy can equal or exceed that achieved post-mortem. Genetic factors, including APOE status and cholinesterase variants may also contribute to patterns of response, perhaps especially so with rivastigmine where there is an additional BuChE inhibitory action. In this AD group two patients were APOE ε4 allele homozygous and one had the BuChE K variant polymorphism, too few for any meaningful subgroup analyses of possible genetic influences.
The detection of small modulatory changes in brain activation in task related areas, however, is encouraging, and may be a robust effect of ChEI therapy over longer periods in responding patients. It remains difficult to fully understand the clinical significance of published pharmacological fMRI studies of ChEI effects in AD, until clinical and behavioral responses can be adequately included as factors in the analysis of imaging data. Response to treatment is already known to be an important modulator of changes in brain blood flow and metabolism in a number of studies of ChEI effects in AD (Nobili et al 2002; Venneri et al 2002; Shimizu et al 2006). Routine clinical assessment of response to ChEIs, however, is based on simple screening tests and clinical impression, and often superficial stability is seen as a justification for continued therapy. An observer independent measure of benefit in terms of brain activation would better justify the costs of treatment for responders, and avoid prolonged unnecessary prescription with possible negative outcomes in those patients who are not responsive to treatment.
Acknowledgments
The authors thank Katrina E Forbes-McKay, Gordon D Waiter, Mario Ries and Iain Elrich for their assistance throughout the project. This study was supported partially through a grant from Novartis Pharma AG to AV and MFS and by a grant from MIUR to AV.
References
- Awh E, Jonides J, Smith EE, et al. Dissociation of storage and rehearsal in verbal working memory. Psychol Sci. 1996;7:25–31. [Google Scholar]
- Baldo JV, Schwartz S, Wilkins D, et al. Role of frontal versus temporal cortex in verbal fluency as revealed by voxel-based lesion symptom mapping. J Int Neuropsychol Soc. 2006;12:896–900. doi: 10.1017/S1355617706061078. [DOI] [PubMed] [Google Scholar]
- Birks J, Grimley Evans J, Iakovidou VV, et al. Rivastigmine for Alzheimer’s disease (Cochrane Review) Cochrane Database Syst Rev. 2000a;4:CD001191. doi: 10.1002/14651858.CD001191. [DOI] [PubMed] [Google Scholar]
- Birks JS, Melzer D, Beppu H, et al. Donepezil for mild and moderate Alzheimer’s disease (Cochrane Review) Cochrane Database Syst Rev. 2000b;4:CD001190. doi: 10.1002/14651858.CD001190. [DOI] [PubMed] [Google Scholar]
- Braver TS, Cohen JD, Nystrom LE, et al. A parametric study of prefrontal cortex involvement in human working memory. Neuroimage. 1997;5:49–62. doi: 10.1006/nimg.1996.0247. [DOI] [PubMed] [Google Scholar]
- Brun A, Englund B, Gustafson L, et al. Clinical and Neuropathological criteria for frontotemporal dementia. J Neurol Neurosurg Psychiatry. 1994;57:416–18. doi: 10.1136/jnnp.57.4.416. [DOI] [PMC free article] [PubMed] [Google Scholar]
- Corbetta M, Shulman GL, Miezin FM, et al. Superior parietal cortex activation during spatial attention shifts and visual feature conjunction. Science. 1995;270:802–5. doi: 10.1126/science.270.5237.802. [DOI] [PubMed] [Google Scholar]
- Courtney SM, Petit L, Haxby JV, et al. The role of prefrontal cortex in working memory: examining the contents of consciousness. Philos Trans R Soc Lond B Biol Sci. 1998;353:1819–28. doi: 10.1098/rstb.1998.0334. [DOI] [PMC free article] [PubMed] [Google Scholar]
- Davies RR, Graham KS, Xuereb JH, et al. The human perirhinal cortex and semantic memory. Eur J Neurosci. 2004;20:2441–6. doi: 10.1111/j.1460-9568.2004.03710.x. [DOI] [PubMed] [Google Scholar]
- Faw B. Pre-frontal executive committee for perception, working memory, attention, long-term memory, motor control, and thinking: a tutorial review. Conscious Cogn. 2003;12:83–139. doi: 10.1016/s1053-8100(02)00030-2. [DOI] [PubMed] [Google Scholar]
- Folstein MF, Folstein SE, McHugh PR. Mini-Mental-State: A practical method for grading the cognitive state of patients for the clinician. J Psychiatry Res. 1975;12:189–98. doi: 10.1016/0022-3956(75)90026-6. [DOI] [PubMed] [Google Scholar]
- Goekoop R, Rombouts SA, Jonker C, et al. Challenging the cholinergic system in mild cognitive impairment: a pharmacological fMRI study. Neuroimage. 2004;23:1450–9. doi: 10.1016/j.neuroimage.2004.08.006. [DOI] [PubMed] [Google Scholar]
- Goekoop R, Scheltens P, Barkhof F, et al. Cholinergic challenge in Alzheimer patients and mild cognitive impairment differentially affects hippocampal activation – a pharmacological fMRI study. Brain. 2006;129:141–57. doi: 10.1093/brain/awh671. [DOI] [PubMed] [Google Scholar]
- Gron G, Brandenburg I, Wunderlich AP, et al. Inhibition of hippocampal function in mild cognitive impairment: targeting the cholinergic hypothesis. Neurobiol Aging. 2006;27:78–87. doi: 10.1016/j.neurobiolaging.2004.12.005. [DOI] [PubMed] [Google Scholar]
- Hachinski VC, Iliff LD, Zilhka E, et al. Cerebral blood flow in dementia. Arch Neurol. 1975;32:632–7. doi: 10.1001/archneur.1975.00490510088009. [DOI] [PubMed] [Google Scholar]
- Howard D, Patterson K. The Pyramids and Palm Trees Test. Suffolk, VA: Thames Valley Test Co; 1992. [Google Scholar]
- Kadir A, Almkvist O, Wall A, et al. PET imaging of cortical 11C-nicotine binding correlates with the cognitive function of attention in Alzheimer’s disease. Psychopharmacology (Berl) 2006;188:509–20. doi: 10.1007/s00213-006-0447-7. [DOI] [PubMed] [Google Scholar]
- Kadir A, Darreh-Shori T, Almkvist O, et al. Changes in brain (11)C-nicotine binding sites in patients with mild Alzheimer’s disease following rivastigmine treatment as assessed by PET. Psychopharmacology (Berl) 2007;191:1005–14. doi: 10.1007/s00213-007-0725-z. [DOI] [PubMed] [Google Scholar]
- Kircher TT, Erb M, Grodd W, et al. Cortical activation during cholinesterase-inhibitor treatment in Alzheimer disease: preliminary findings from a pharmaco-fMRI study. Am J Geriatr Psychiatry. 2005;13:1006–13. doi: 10.1176/appi.ajgp.13.11.1006. [DOI] [PubMed] [Google Scholar]
- Lojkowska W, Ryglewicz D, Jedrzejczak T, et al. The effect of cholinesterase inhibitors on the regional blood flow in patients with Alzheimer’s disease and vascular dementia. J Neurol Sci. 2003;216:119–26. doi: 10.1016/s0022-510x(03)00229-6. [DOI] [PubMed] [Google Scholar]
- McKeith IG, Galasko D, Kosaka K, et al. Consensus guidelines for the clinical and pathologic diagnosis of dementia with Lewy bodies (DLB): Report of the consortium on DLB international workshop. Neurology. 1996;47:1113–24. doi: 10.1212/wnl.47.5.1113. [DOI] [PubMed] [Google Scholar]
- McKhann G, Drachman D, Folstein M, et al. Clinical diagnosis of Alzheimer’s disease: report of the NINCDS-ADRDA Work Group under the auspices of Department of Health and Human Services Task Force on Alzheimer’s Disease. Neurology. 1984;34:939–44. doi: 10.1212/wnl.34.7.939. [DOI] [PubMed] [Google Scholar]
- Nobili F, Koulibaly M, Vitali P, et al. Brain perfusion follow-up in Alzheimer’s patients during treatment with acetylcholinesterase inhibitors. J Nucl Med. 2002;43:983–90. [PubMed] [Google Scholar]
- Nobili F, Vitali P, Canfora M, et al. Effects of long-term Donepezil therapy on rCBF of Alzheimer’s patients. Clin Neurophysiol. 2002;113:1241–8. doi: 10.1016/s1388-2457(02)00110-4. [DOI] [PubMed] [Google Scholar]
- Petersen RC, Smith GE, Waring SC, et al. Aging, memory, and mild cognitive impairment. Int Psychogeriatr. 1997;9(Suppl 1):65–9. doi: 10.1017/s1041610297004717. [DOI] [PubMed] [Google Scholar]
- Posner MI, Raichle ME. Images of Mind. New York: Scientific American Library; 1997. [Google Scholar]
- Potkin SG, Anand R, Fleming K, et al. Brain metabolic and clinical effects of rivastigmine in Alzheimer’s disease. Int J Neuropsychopharmacol. 2001;4:223–30. doi: 10.1017/S1461145701002528. [DOI] [PubMed] [Google Scholar]
- Price CJ, Mummery CJ, Moore CJ, et al. Delineating necessary and sufficient neural systems with functional imaging studies of neuropsychological patients. J Cogn Neurosci. 1999;11:371–82. doi: 10.1162/089892999563481. [DOI] [PubMed] [Google Scholar]
- Ricci PT, Zelkowicz BJ, Nebes RD, et al. Functional neuroanatomy of semantic memory: recognition of semantic associations. Neuroimage. 1999;9:88–96. doi: 10.1006/nimg.1998.0386. [DOI] [PubMed] [Google Scholar]
- Roman GC, Tatemichi TK, Erkinjuntti T, et al. Vascular dementia: diagnostic criteria for research studies. Report of the NINDS-AIREN International Workshop. Neurology. 1993;43:250–60. doi: 10.1212/wnl.43.2.250. [DOI] [PubMed] [Google Scholar]
- Rombouts SA, Barkhof F, Van Meel CS, et al. Alterations in brain activation during cholinergic enhancement with rivastigmine in Alzheimer’s disease. J Neurol Neurosurg Psychiatry. 2002;73:665–71. doi: 10.1136/jnnp.73.6.665. [DOI] [PMC free article] [PubMed] [Google Scholar]
- Sabsevitz DS, Medler DA, Seidenberg M, et al. Modulation of the semantic system by word imageability. Neuroimage. 2005;27:188–200. doi: 10.1016/j.neuroimage.2005.04.012. [DOI] [PubMed] [Google Scholar]
- Saykin AJ, Wishart HA, Rabin LA, et al. Cholinergic enhancement of frontal lobe activity in mild cognitive impairment. Brain. 2004;127:1574–83. doi: 10.1093/brain/awh177. [DOI] [PubMed] [Google Scholar]
- Shanks MF, McGeown WJ, Forbes-McKay KE, et al. Regional brain activity after prolonged cholinergic enhancement in early Alzheimer’s disease. Magn Reson Imaging. 2007;25:848–59. doi: 10.1016/j.mri.2007.02.005. [DOI] [PubMed] [Google Scholar]
- Shimizu S, Hanyu H, Iwamoto T, et al. SPECT follow-up study of cerebral blood flow changes during Donepezil therapy in patients with Alzheimer’s disease. J Neuroimaging. 2006;16:16–23. doi: 10.1177/1051228405001468. [DOI] [PubMed] [Google Scholar]
- Stefanova E, Wall A, Almkvist O, et al. Longitudinal PET evaluation of cerebral glucose metabolism in rivastigmine treated patients with mild Alzheimer’s disease. J Neural Transm. 2006;113:205–18. doi: 10.1007/s00702-005-0312-6. [DOI] [PubMed] [Google Scholar]
- Vandenberghe R, Price C, Wise R, et al. Functional anatomy of a common semantic system for words and pictures. Nature. 1996;383:254–6. doi: 10.1038/383254a0. [DOI] [PubMed] [Google Scholar]
- Vandenbulcke M, Peeters R, Dupont P, et al. Word reading and posterior temporal dysfunction in amnestic mild cognitive impairment. Cereb Cortex. 2007;17:542–51. doi: 10.1093/cercor/bhj179. [DOI] [PubMed] [Google Scholar]
- Veltman DJ, Rombouts SA, Dolan RJ, et al. Maintenance versus manipulation in verbal working memory revisited: an fMRI study. Neuroimage. 2003;18:247–56. doi: 10.1016/s1053-8119(02)00049-6. [DOI] [PubMed] [Google Scholar]
- Venneri A. Imaging treatment effects in Alzheimer’s disease. Magn Reson Imaging. 2007;25:953–68. doi: 10.1016/j.mri.2007.02.004. [DOI] [PubMed] [Google Scholar]
- Venneri A, Shanks MF, et al. Picturing dementia: experience with SPECT. 7th International Geneva/Springfield Symmposium on Advances in Alzheimer Therapy; Geneva, CH. 2002. [Google Scholar]
- Venneri A, Shanks MF, Staff RT, et al. Cerebral blood flow and cognitive responses to rivastigmine treatment in Alzheimer’s disease. Neuroreport. 2002;13:83–7. doi: 10.1097/00001756-200201210-00020. [DOI] [PubMed] [Google Scholar]
- Wilcock GK, Lilienfeld S, Gaens E. Efficacy and safety of galantamine in patients with mild to moderate Alzheimer’s disease: multicentre randomised controlled trial. Galantamine International-1 Study Group. BMJ. 2000;321:1445–9. doi: 10.1136/bmj.321.7274.1445. [DOI] [PMC free article] [PubMed] [Google Scholar]