Abstract
Small ~8.5 nm discs formed spontaneously when and dimyristoyl phosphatidylcholine (DMPC) large unilamellar vesicles (LUVs) were incubated with apolipoprotein A-I (apoA-I) (100:1 molar ratio). However, in a time course study, the transient production of ~11 nm large discs was detected and isolated by gel filtration. The intermediate large discs contained three apoA-I molecules and were stable over time; but, when additional apoA-I was added they formed small discs containing two molecules of apoA-I. The reaction kinetics of apoA-I with DMPC LUVs was monitored by fluorescence resonance energy transfer and two phases were observed, supporting the presence of the intermediate in the formation of small discs. The lipid dynamics of LUVs and discs were assayed revealing the presence of sequestered lipid-protein domains upon apoA-I binding to DMPC LUVs. In addition, the lipids in the intermediate large discs were more constrained than those in the small discs. We propose that apoA-I binds with DMPC LUVs to form small lipid-protein domains on the LUV, then the domains are released to form large discs, which can mature in the presence of additional apoA-I to form small discs. Thus, the formation of small apoA-I lipid discs proceeds through the formation of a large disc intermediate.
Apolipoprotein A-I (apoA-I) is the major protein component of high-density lipoproteins (HDL). The well-known antiatherogenic properties of HDL can be partially attributed to its ability to remove cholesterol from peripheral tissues for transport to liver for excretion and metabolism, in the reverse cholesterol transport pathway (1;2). ApoA-I is reported to adopt three physiological distinct conformational states: lipid-free, lipid-poor, and lipid-bound (3) . Lipid-free and lipid-poor apoA-I exist in plasma, where they play a physiological role in both cellular cholesterol efflux and lecithin cholesterol acyl transferase activity (4). In vivo, the lipidation of apoA-I is dependent upon cellular lipid efflux mediated by ABCA1 that leads to the formation of nascent discoidal HDL, which can undergo maturation into spherical HDL through additional cellular and plasma activities (5;6). The molecular mechanism by which ABCA1 transforms lipid-free apoA-I into a nascent lipoprotein is not known.
A large body of work exists concerning the in vitro formation and structure of discoidal apoA-I phospholipid complexes. The cholate dialysis method can be used to make reconstituted high-density lipoprotein (rHDL) discs, and this method works for various lipids including the physiologically common phospholipids and phospholipid/cholesterol mixtures (7;8). ApoA-I can also spontaneously form stable lipoprotein discoidal complexes in vitro when incubated with dimyristoyl phosphatidylcholine (DMPC) dispersions or liposomes, but not when incubated with the physiologically prominent longer acyl chain phospholipids (9;10). Despite the limitation of this process to the non physiological DMPC, this is the only model that exists in which apoA-I can readily extract phospholipids from a lipid bilayer to form discoid particles that are similar to nascent HDL. The interaction of apoA-I and DMPC to produce nascent HDL-like particles has been studied extensively (7). This includes the interaction of apoA-I with different forms of DMPC, such as multilamellar dispersions (10–13), giant unilamellar vesicles (14), and small unilamellar vesicles (15;16). The nature and the size of apoA-I/DMPC complexes depend on the DMPC to apoA-I ratio, ranging from large vesicles (1000:1) to large discoidal complexes (300:1) and small discoidal complexes (≤100:1), with the large and small discs containing three and two apoA-I molecules, respectively (17). The binding of apoA-I to DMPC dispersions is a very rapid process which takes only a few minutes, while the formation of disc takes several hours at 25°C (16). Analysis of the kinetic data has led to the suggestion that the association of apoA-I with DMPC is thermodynamically stable only near the temperature of lipid phase transition, whereas beyond this region the stability of the complex is determined by kinetic factors (18). Jonas reported that no intermediates were observed when they investigated the interaction of apoA-I with DMPC vesicles, at molar ratios of lipid to protein from 4000:1 down to 50:1 (15).
The goal of this study was to investigate the mechanism by which apoA-I binds to and transforms lipid bilayers into discrete apoA-I lipid complexes. To accomplish this we used DMPC large unilamellar vesicles (LUVs) as our model system, since apoA-I cannot transform more physiological lipid bilayers into complexes in vitro without the use of detergents that destroy the lipid bilayer. We discovered the existence of an intermediate large disc that precedes the appearance of small discs. The intermediate ~11 nm large disc fraction was isolated by gel filtration and found to contain three apoA-I molecules. These large discs are fairly stable, but upon incubation with additional apoA-I, they mature into the small ~8.5 nm discs with two molecules of apoA-I. The reaction of apoA-I with DMPC LUVs was monitored by fluorescence resonance energy transfer, and two phases were observed, supporting the formation of an intermediate during the generation of small discs. The lipid dynamics of LUVs and discs were assayed by of diphenylhexatriene (DPH) anisotropy and pyrene excimer formation, and suggest that apoA-I binding to the LUVs constrains the lipid in domains, and that lipid fluidity decreases as large discs mature into small discs. Our data support the model that the formation of apoA-I lipid discs can proceed through remodeling of a larger intermediate into a smaller disc, which may provide insight into the mechanism of HDL biogenesis in vivo.
Experimental procedures
ApoA-I preparations and detection
Plasma derived human apoA-I (Biodesign) was dialyzed against PBS (0.15 M sodium chloride, 10 mM sodium phosphate, pH 7.4), diluted to 0.5 mg/ml, and stored frozen in small aliquots. We observed no precipitates or large aggregates in these frozen preparations. The concentrations of plasma-derived apoA-I was determined by absorbance at 280 nm using the extinction coefficient of 1.13 absorbance units for a 1 mg/ml solution. Recombinant human his-tagged apoA-I (rh-apoA-I) was prepared as previously described (19), and before use the guanidine hydrochloride was removed by dialysis against PBS. The concentration of rh-apoA-I was determined via the BCA reagent (Pierce) or via an alkaline modified Lowry assay (20), with plasma-derived apoA-I as the standard. The purity of rh-apoA-I was determined by electrophoresis on a 4–20% SDS-polyacrylamide gradient gel. The purities of all rh-apoA-I preparations were greater than 95%. For apoA-I western blot analysis, protein in gels was transferred to a PVDF membrane and probed with goat anti-human apoA1 (1:1000, Diasorin, Saco, ME) in the presence of casein blocker (Pierce). Detection was performed with a rabbit anti-goat antibody linked to horseradish peroxidase (1:10,000) followed by incubation with an enhanced chemiluminescence reagent (Pierce).
Preparation of LUVs
1,2-dimyristoyl-sn-glycero-3-phosphocholine (DMPC) (Avanti Polar Lipids) LUV with or without added 1-palmitoyl-2-(pyrene-1-yl)decanoyl-sn-glycero-3-phosphocholine (PPDPC, Sigma), or diphenylhexatriene (DPH, Sigma) were prepared by extrusion using a modification of a method described previously (21;22). The lipid mixtures in chloroform stock solutions were measured and mixed in an amber glass vial. The solvent was evaporated under a stream of nitrogen gas with constant rotation so that the dried lipids formed a thin film on the glass wall. PBS buffer was then added and vortex thoroughly. The suspension was incubated at 37°C, and the resulting dispersion was extruded 19 times through a polycarbonate membrane (Whatman) with 100 nm pores using a mini-extruder (Avanti Polar Lipids). DMPC concentrations of isolated complexes were determined by the Phospholipids B assay (Wako Chemicals) using DMPC to generate a standard curve. DMPC LUV vesicle size was 91± 6 nm as determined by laser scattering using a Dynapro-801 molecular sizing instrument (Protein Solutions, Charlottesville VA). Based on the surface area or 70 Å2 per DMPC, we estimate that each LUV contains ~ 67,000 DMPC molecules.
Gel filtration experiments
500 µL samples of LUV/apoA-I mixtures were applied to a Superdex 200 column (Amersham Biosciences) pre-equilibrated with PBS buffer. Sample loading and elution were controlled by a Biologic FPLC (Bio-Rad), and elution profile was determined by use of an in-line fluorescence or absorbance detector. The flow rate was set to 0.5 ml/min, and thirty 0.75 ml fractions were collected.
Native gel electrophoresis
ApoA-I, apoA-I-lipid complexes, and native gel molecular size standards (Amersham Biosciences) were run on a 4–20% tris-glycine native gel (Invitrogen) for 6 hrs, transferred to a PVDF membrane and probed for human apoA-I as described above. Western blotting was used for increased sensitivity allowing analysis of small sample volumes.
Chemical Cross-linking of ApoA-I in DMPC Discs
ApoA-I cross-linking was performed using disuccinimidyl suberate (DSS) using methods similar to those previously described (3;23). 5 mg of DSS (Pierce) was dissolved in 135 uL DMSO to prepare a 100 mM stock solution. This DSS stock solution was further diluted in DMSO to make appropriate stocks for adding to apoA-I or apoA-I DMPC complexes using no more than a final concentration of 2% DMSO and at the DSS:apoA-I molar ratios specified in the figure legend. The cross linking reaction was allowed to incubate at room temperature for 30 minutes, followed by quenching unreacted DSS by adding excess Tris-HCl, pH 7.5. Aliquots were analyzed by denaturing electrophoresis on a 10% Tris-glycine SDS gel. ApoA-I was detected by western blot, as described above.
Measurement of pyrene excimer formation
Fluorescence emission spectra for LUVs and discs labeled with 1-palmitoyl-2-(pyrene-1-yl)decanoyl-sn-glycero-3-phosphocholine (PPDPC) (2% mole) were measured with a Perkin-Elmer LS50B Luminescence-Spectrometer with a magnetically stirred, thermostated cuvette compartment. Bandwidths of 5 nm were used for both excitation and emission. The temperature was maintained at 23°C. Three scans were averaged, and the emission intensities at 398 and 480 nm were taken for Im and Ie, respectively.
DPH fluorescence anisotropy
Diphenylhexatriene (DPH) at 0.2 mole % was included during formation of DMPC LUV. Polarized emission of the DPH labeled LUVs and apoA-I lipid complexes was measured at 23°C in the L-format using Polaroid filters in a Perkin-Elmer LS50B. DPH fluorescence anisotropy, r, was measured with excitation at 357 nm and emission at 427 nm, using 10 nm bandwidths, and calculated using software provided by Perkin-Elmer.
Fluorescence resonance energy transfer measurement
Fluorescence resonance energy transfer (FRET) from apoA-I tryptophan and tyrosine residues to DPH was measured over time using a 96-well plate spectrofluorimeter (Gemini SpectraMAX Molecular Devices). The excitation and emission wavelengths were set at 280 nm and 434 nm, respectively. The cutoff filter wavelength was 420 nm. ApoA-I, LUVs, and LUV/apoA-I mixture samples were put into a 96-well opaque black plate to minimize reflection, with the excitation delivered and emission detected from above, at 23°C.
Results
ApoA-I reaction with DMPC LUVs
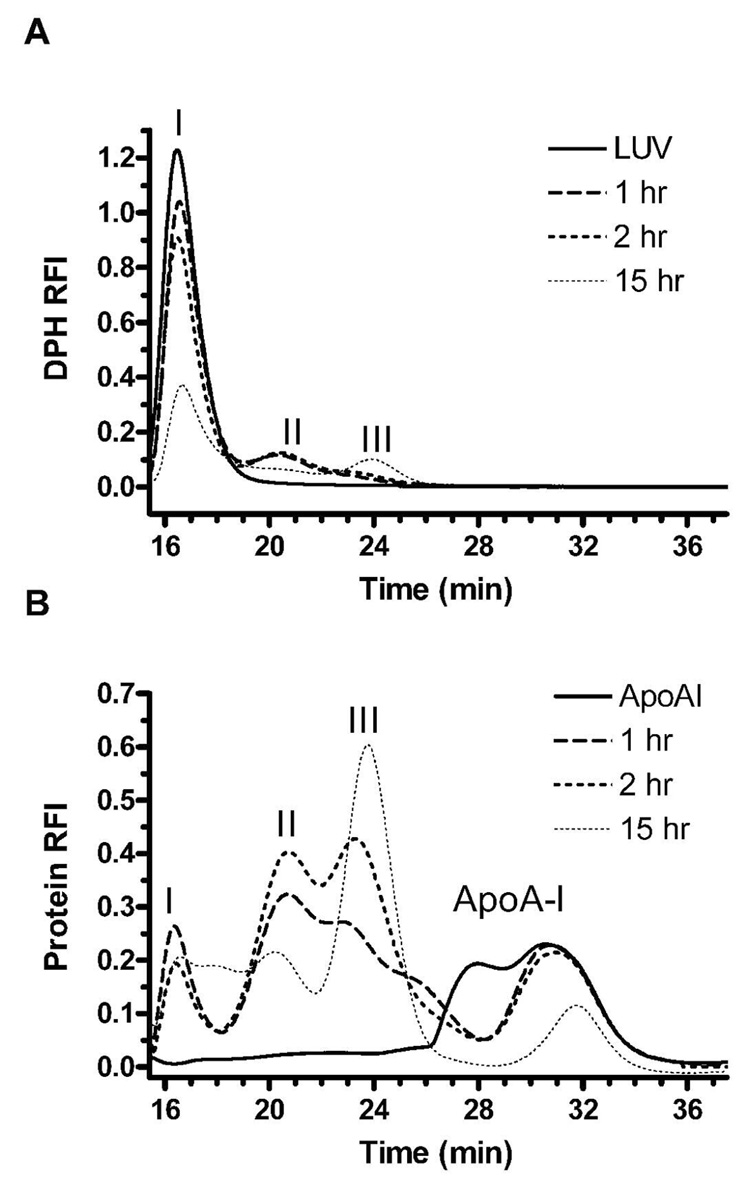
ApoA-I is well known to spontaneously form small discs when incubated with DMPC multilamellar dispersions or small unilamellar vesicles (SUVs) (12;13;15)). We initiated studies to examine the time course of apoA-I interaction with ~ 100 nm diameter LUVs, as these liposomes are unilamellar and avoid the small radius of SUVs that can be destabilizing, making LUVs a good model for the cellular plasma membrane. We followed the interaction of rh-apoA-I with 0.2% DPH-labeled DMPC LUVs over time by FPLC gel filtration, using inline fluorescence detection to identify protein (tyrosine and tryptophan residues) and the lipid tracer DPH, respectively, and allowing for the isolation and analysis of specific fractions. The results of the gel filtration were highly reproducible in independent experiments. ApoA-I and DPH-labeled DMPC LUVs, at a DMPC to apoA-I molar ratio of 100:1, were incubated for 1, 2, or 15 h at 23°C and immediately loaded onto a Superdex 200 column. Control samples of DMPC LUV and lipid-free apoA-I were also applied to the columns. The DMPC LUV ran as a sharp peak at ~16.5 min (peak I, solid line, Figure 1A). Lipid-free apoA-I yielded a broad double peak that extended from 26 to 36 min, demonstrating various degrees of apoA-I self association (solid line, Fig 1B). After 1 h of DMPC LUV incubation with apoA-I, the height of peak I (LUVs) decreased and the lipid tracer appeared in a new peak, labeled peak II, that elutes at 19 to 21 min, with a shoulder extending into the peak III region that elutes at 23 to 25 min (dashed line Figure 1A). After 1 h of incubation the starting apoA-I peak diminished, particularly the larger apoA-I oligomers in the peak shoulder that eluted at 26 to 29 min, and apoA-I appeared in the in peak II, as well as in the LUVs in peak I (dashed line Figure 1 B). After 2 h of DMPC LUV incubation with apoA-I, there is a large increase in the apoA-I appearing in the peak III (dotted line, Figure 2B). By 15 h of DMPC LUV incubation with apoA-I, the lipid tracer in peaks I and II decreased further with the appearance of a distinct peak III (thin dotted line, Fig 1 A), while most of the protein is also shifted from peak II to peak III (thin dotted line, Fig 1 B). This time course data suggest the initial formation of a large DMPC-apoA-I complex appearing in peak II, which was subsequently converted to a smaller DMPC-apoA-I complex appearing in peak III. Rh-apoA-I and plasma derived apoA-I performed similarly in this time course (data not shown). This agrees with prior findings that N-terminal his-tagged apoA-I behaves identically as plasma derived apoA-I as far as ABCA1-dependent cholesterol acceptor activity (19), and lipid binding activity as measured by DMPC emulsion clearance (unpublished results). Also, a similar time course was observed using OD280 which tracks both protein and LUV turbidity (data not shown). We also repeated this time course using DMPC multilamellar dispersions (at a DMPC to apoA-I molar ratio of 100:1) and found a similar time dependent shift in apoA-I from the peak II complex to the peak III complex (data not shown), thus this finding is not specific for LUVs.
Figure 1.
Time course of apoA-I DMPC complex formation followed by gel filtration detected by DPH fluorescence (A) and protein fluorescence (B), respectively. LUVs (1.8 mM DMPC) and 18 µM rh-apoA-I (100:1 mole ratio) mixtures were incubated for 1 (dashed line), 2 (dotted line), or 15 (thin dotted line) hrs at 23°C and applied immediately to the Superdex 200 column. The elution pattern of DMPC LUVs alone (solid line in panel A) and apoA-I alone (solid line in panel B) are also shown. Real time DPH fluorescence was detected by an in-line monitor using excitation and emission wavelengths of 357 nm and 427 nm respectively. Real time protein fluorescence was detected using excitation and emission wavelengths of 280 nm and 340 nm, respectively.
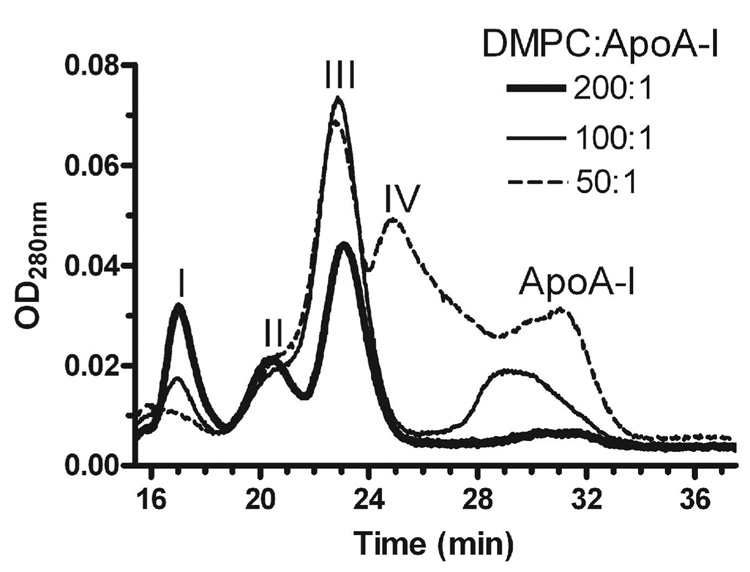
Figure 2.
Effect of varying the lipid:protein ratio on apoA-I DMPC complex formation. DMPC LUV:apoA-I mixtures were prepared with 1.8 mM DMPC at lipid:protein mole ratios of 50 (dashed line), 100 (thin line), and 200 (thick line) and incubated overnight at 23°C. The mixtures were then analyzed by gel filtration on a Superdex 200 column using an in-line detector to measure absorbance at 280 nm, that detects both protein absorbance as well as light scattering due to LUVs.
It has previously been shown with DMPC multilamellar dispersions and small unilamellar vesicles that varying the DMPC:apoA-I molar ratio leads to the formation of different sizes of discs (12;17); thus, we inferred that peaks II and III represent larger and smaller discs, and their sizes are estimated below in Figure 3. Thus, we altered the DMPC:apoA-I molar ratio to determine whether different sized discs would be produced after incubation at 23°C for 15 h (Figure 2). At a DMPC:apoA-I mole ratio of 200:1 (thick line), LUVs in peak I, large discs in peak II, small discs in peak III, and just a trace free apoA-I at 29 to 33 min were observed. At a DMPC:apoA-I mole ratio of 100:1 (thin line), compared to the 200:1 ratio, the height of the peak I LUVs decreased, as the abundance of the small discs in peak III increased, and a more free apoA-I was evident at 28 to 33 min. At a DMPC:apoA-I mole ratio of 50:1, a new smaller complex, peak IV, was observed that eluted at 24 to 26 min, and more free apoA-I was evident (dashed line).
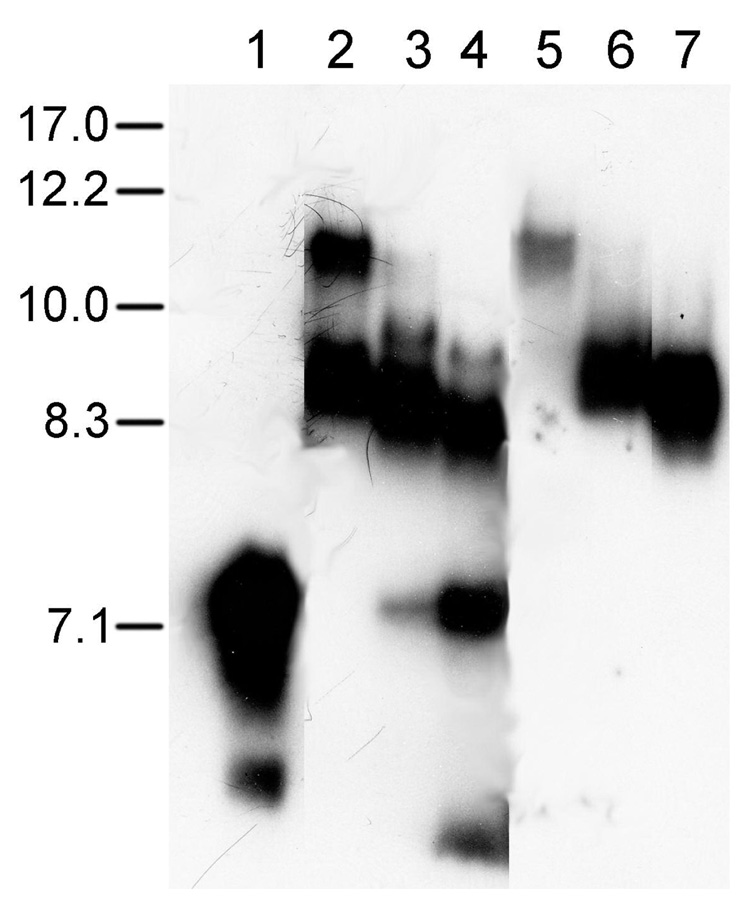
Figure 3.
Gel electrophoresis analysis of apoA-I DMPC complexes. ApoA-I western blot of non-denaturing gradient gel electrophoresis was performed on complexes formed by incubation of DMPC LUVs with plasma-derived apoA-I. Lane 1, lipid-free apoA-I; lanes 2–4, overnight incubation mix of DMPC LUVs with apoA-I at a lipid:protein mole ratio of 200:1 (lane 2); 100:1 (lane 3); and 50:1 (lane 4); lane 5, peak II from gel filtration of DMPC:apoA-I mixture at 200:1 mole ratio; lane 6, peak III of gel filtration from DMPC:apoA-I mixture at 200:1 mole ratio; lane 7, peak IV from gel filtration of DMPC:apoA-I mixture at 50:1 mole ratio. 250 ng of protein was loaded each for lanes 1–4, and 5 µl of each isolated fraction was loaded without adjusting for protein concentration in lanes 5–7. The migration of a high molecular weight standard (Amersham Biosciences; Newark, NJ) containing proteins of known Stokes diameter (nm) is shown at the left.
In order to determine the size of the various DMPC:apoA-I complexes we subjected whole mixtures and isolated FPLC peaks to native gel electrophoresis (Figure 3). ApoA-I spontaneously aggregates and most of it migrated at ~7.1 nm, but a small amount of non-aggregated apoA-I was also observed (lower band, lane 1). ApoA-I was incubated with DMPC LUVs at different mole ratios overnight. At a DMPC:apoA-I mole ratio of 200:1, two complexes were observed that migrated at ~11 and 8.6 nm, respectively (lane 2). At a DMPC:apoA-I mole ratio of 100:1, only a trace of the 11 nm complex was found, and the major complex was observed at ~8.5 nm along with a minor complex band at ~9.0 nm and a small amount of the free apoA-I band (lane 3). At a DMPC:apoA-I mole ratio of 50:1, the major complex shifted to ~8.3 nm, with a minor complex band at ~8.8 nm, and the free apoA-I band was more prominent (lane 4). The presence of the minor bands of apoA-I:DMPC complexes in lanes 3 and 4 indicates that there is heterogeneity in these particles which all run primarily as peak III small complexes by FLPC (Fig. 2). Lanes 5, 6, and 7, show the complexes found after gel filtration in peaks II, III, and IV, respectively. Peak II contains only the 11 nm large discs, while peaks III and IV contain small discs of 8.6 and 8.3 nm, respectively; however, these 8.6 and 8.3 nm bands may each represent several closely migrating species that are not resolved in our gel system, but might be resolved by longer runs, as observed by Li et al (12).
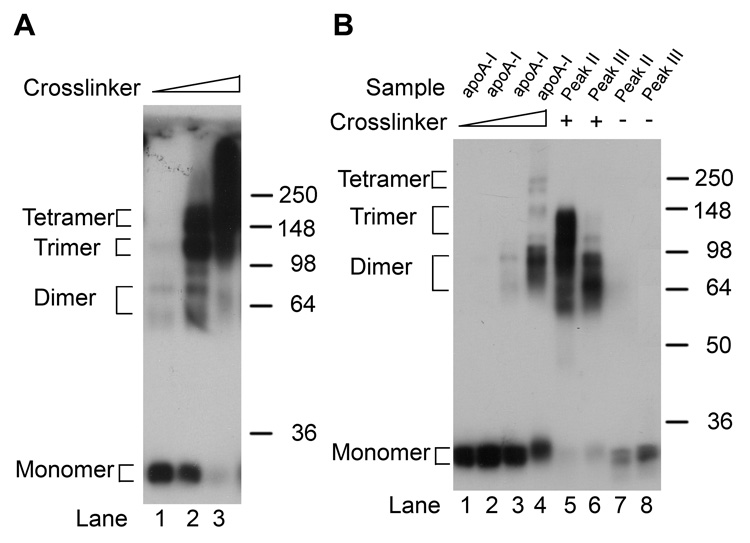
To determine the number of apoA-I molecules in the peak II and peak III complexes, we performed molecular cross linking with excess DSS followed by SDS PAGE and western blotting (Figure 4). First, we examined the effect of the cross linker on lipid-free apoA-I. Using concentrated apoA-I at 2.0 mg/ml, we found that an equal molar level of DSS yielded mostly apoA-I monomers and led to a trace amount of bands with apparent molecular weights of ~60 and 72 kDa (Fig 4A, lane 1). At a DSS to apoA-I ratio of 5:1, the monomer persisted along an increased yield of the 60 and 72 kDa bands; in addition, a new minor band was visible with apparent molecular weight of ~90 kDa, and two more prominent broad bands were visible with apparent molecular weight ranges of ~110 to 130 kDa and ~ 140 to 220 kDa, respectively (Fig 4A, lane 2). At a DSS to apoA-I molar ratio of 20:1 the monomer is lost, the 60 and 72 kDa bands diminished, and most of the apoA-I was driven into larger complexes (Fig 4A, lane 3). Based upon the elegant work of Bhat et al. (3), who made apoA-I with single cysteine substitutions at various positions, it is clear that apoA-I dimers can migrate at a variety apparent molecular weights ranging from ~53 to over 80 kDa, depending upon the position of the homodimerization. Thus, the bands we observe at 60, 72 and 90 kDa are probably all dimers, while the larger two complexes observe in lane 2 of Fig 4A probably represent trimers and tetramers. Next, we adjusted lipid-free apoA-I and the peak III complex to match the concentration of the dilute peak II material at 24 µg/ml. Lipid-free apoA-I at this concentration was much less sensitive to cross linking, again in agreement with data presented by Bhat et al., who demonstrated both concentration and molar ratio effects on apoA-I cross linking (3). Significant but partial cross linking was observed only at a DSS to apoA-I molar ratio of 200:1, where a broad dimer band is observed as well as faint trimer and tetramer bands (Fig 4B, lane 4). The peak II and III complexes were also treated with a 200:1 ratio of DSS:apoAI. Cross linked peak II had virtually no monomer and yielded primarily a band that migrated as an apoA-I trimer, although this broad band also contained apoA-I that migrated as a dimer (Fig 4B, lane 5). Cross linked peak III also had no monomer and yielded only a broad band that migrated as a dimer. Thus, we conclude that the peak II complex primarily contains three apoA-I molecules, while the peak III complex contains two apoA-I molecules.
Figure 4.
Cross linking analysis of lipid-free apoA-I and apoA-I DMPC complexes. A. Concentrated lipid-free apoA-I at 70 µM, was incubated with the DSS cross linker at 1x (lane 1), 5x (lane 2) and 20x molar ratios (lane 3), respectively. 150 ng of each product was analyzed by SDS PAGE and western blot analysis. The positions of the monomer, dimers, trimers, and tetramers are denoted. B. Lipid-free apoA-I, and isolated peak II and peak III complexes were adjusted to a final apoA-I concentration of 0.85 nM. Lanes 1–4, the low concentration of apoA-I was reacted with 0, 2.5x, 20x, and 200x molar ratio of the DSS cross linker, respectively. Lanes 5 and 6, peaks II and III, respectively, were reacted with the DSS cross linker at DSS to apoA-I molar ratio 200. Lanes 7 and 8, peaks II and III were incubated in the absence of DSS cross linker. 100 ng of each product was analyzed by SDS PAGE and western blot analysis.
We then analyzed the apoA-I and DMPC concentrations in three independent preparations of peak II and peak III complexes, in order to calculate the molar ratios of DMPC to apoA-I in these complexes. The DMPC to apoA-I mole ratios for peak II and peak III were 175 ± 17 and 120 ± 13, respectively (mean ± S.D., p=0.01 by two-tailed t test). Combining the cross linking data with the composition data, large disks in peak II consist of three molecules of apoA-I and ~525 molecules of DMPC, while the small discs of peak III consist of two molecules of apoA-I and ~240 molecules of DMPC (Table 1).
Table 1.
Composition and size of apoA-I DMPC complexes in peaks II and III.
| Peak # | DMPC:apoA-I (mean±SD) | ApoA-I per particle | PL per particle | Size (nm) |
|---|---|---|---|---|
| II | 175 ± 17 | 3 | 474 to 576 | 11 |
| III | 120 ± 13 | 2 | 214 to 266 | 8.6 |
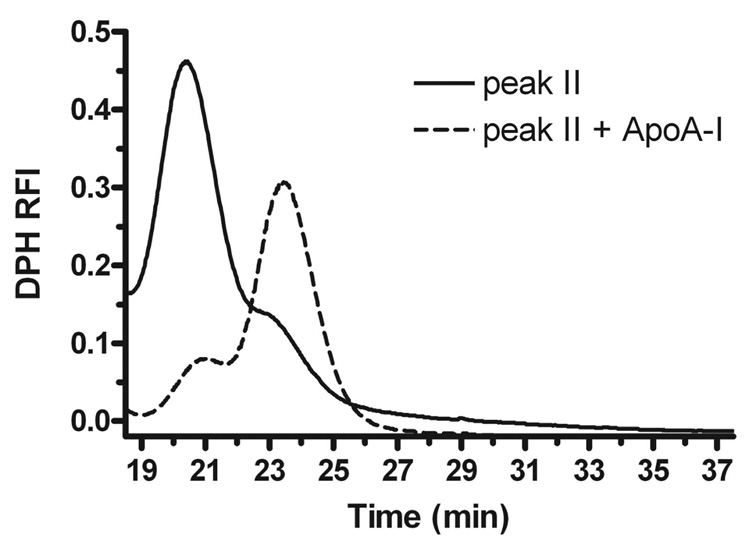
In order to determine whether the large DMPC-apoA-I discs in peak II were stable, or whether they could spontaneously mature to smaller discs, we isolated peak II from a reaction with a DMPC:apoA-I mole ratio of 200:1, and divided it in half. One half was incubated at 23°C overnight, and the other half was incubated after adding additional apoA-I (Figure 5). The peak II complex appeared to be rather stable, as after further incubation without additional apoA-I it retained most of its absorbance in peak II, although a small shoulder appeared in peak III. This could either be due to imperfect separation by gel filtration leading to contamination of the smaller peak III complex in peak II, or due to a limited extent of maturation of the larger peak II complex to the smaller peak III complex; and, we cannot distinguish between these possibilities. However, with additional apoA-I, most of the large discs in peak II were converted to smaller discs in peaks III. Thus, the isolated larger discs in peak II were predominantly stable in the absence of additional apoA-I.
Figure 5.
Stability of DMPC:apoA-I peak II complex. Peak II was isolated by gel filtration of an overnight incubation of DPH-labeled LUVs (DMPC:apoA-I 200:1 mole ratio). The sample in peak II was separated into two aliquots, which were incubated at 23°C overnight without (solid line) or with addition of apoA-I to a final concentration of 8.6 µM (dotted line). These two samples were then analyzed by gel filtration on a Superdex 200 column and monitored for DPH fluorescence.
ApoA-I effects on DMPC packing and fluidity
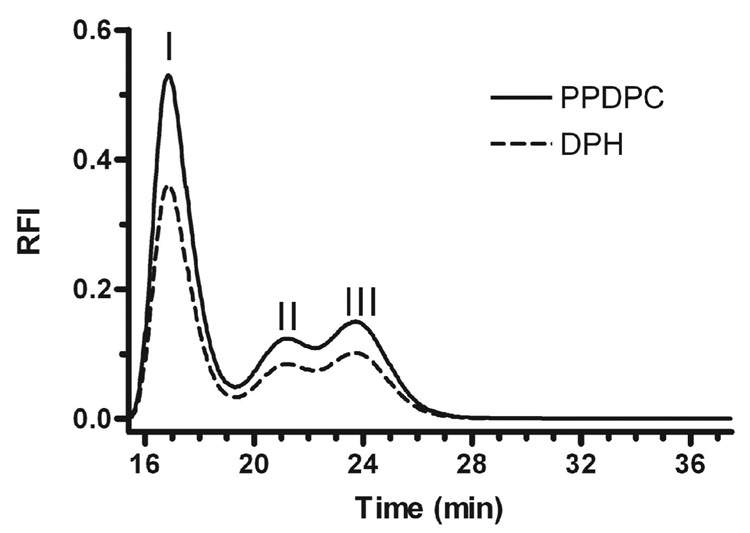
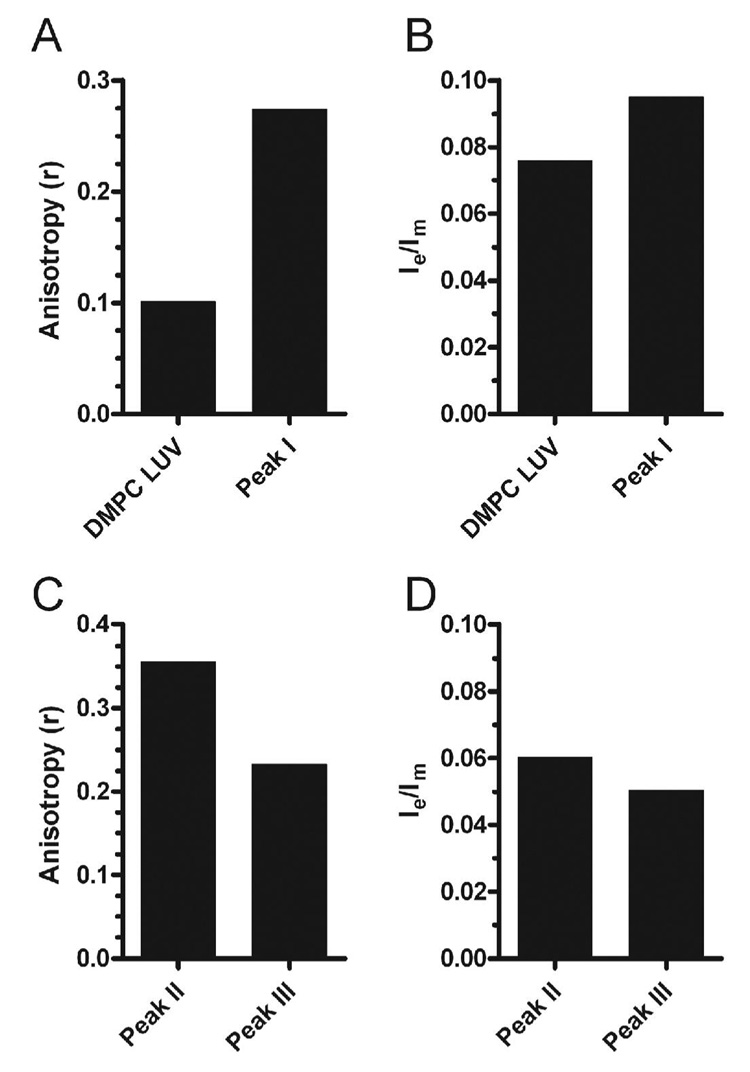
The gel filtration studies showed that it is possible to generate distinctly migrating lipid-protein complexes when apoA-I was incubated with DMPC LUVs. The lipid dynamics of these complexes along with the initial DMPC LUV were studied by measuring DPH fluorescence anisotropy and the formation of pyrene excimers. DPH (0.2 mole %) or PPDPC (2.0 mole %) labeled DMPC LUV were incubated with apoA-I (100:1 mole ratio) for 4 h, and applied to the Superdex 200 column. The fluorescent elution profiles of the complexes formed after incubation of apoA-I with either DPH or PPDPC labeled DMPC LUVs were similar (Figure 6), indicating the absence of fluorophore specific sorting into peak II or peak III complexes. Fractions containing peaks I, II, and III were studied for DPH anisotropy and pyrene excimers. Excitation of pyrene at 344 nm generates a monomeric excited state, which relaxes back to ground state by emitting photons with a maximum at ~398 nm (Im). If the local concentration of pyrene is high enough or if it is spatially constrained in a domain, the excited monomer may collide with a ground-state pyrene, forming an excited dimer (excimer). The excimer dissociates back to two ground-state pyrenes by emitting photons at a broad band centered at ~480 nm (Ie) (24;25). Since peak I could contain both un-reacted LUVs and LUVs containing apoA-I, and we have no way to separate these, we compared peak I only to unreacted LUVs. The DPH anisotropy (r) and pyrene excimer to monomer fluorescent intensity ratio (Ie/Im) for peak I were 2.7-fold and 1.3-fold higher than those of the un-reacted DMPC LUV, respectively (Figures 7A and B), indicating that apoA-I on at least a fraction of the LUVs, induces decreased lipid fluidity in the LUV, and organizes the lipids into domains surrounded by the protein. Presumably this organized domain is the precursor of the large disc. We also examined the lipid properties of the apoA-I containing large and small discs in peaks II and III (Figure 7 C and D). Compared to the large disc intermediates in peak II, the small discs in peak III had a 30% decrease in DPH anisotropy and a 16% decrease in pyrene excimer/monomer fluorescent intensity ratio. This demonstrates that the lipids in large discs are more constrained and less fluid than in the small discs.
Figure 6.
ApoA-I complexes formed after incubation with fluorescently labeled DMPC LUVs. ApoA-I (18 µM) was incubated for 4 hours at 23°C with 1.8 mM DMPC LUVs that were labeled with 0.2 mole % DPH (dashed line), or 2 mole % PPDPC (solid line). The reactions were then analyzed by gel filtration on a Superdex 200 column and monitored with an in-line fluorescence detector.
Figure 7.
Lipid fluidity and domains of DMPC LUVs and apoA-I lipid complexes. A. Anisotropy (r) of DPH labeled DMPC LUVs and of the LUV sized particles isolated in peak I after gel filtration of a 2 hour incubation of 1.8 mM DMPC (DPH-labeled) LUVs with 18 µM rh-apoA-I. B. Pyrene excimer to monomer ratio (Ie/Im) of PPDPC labeled DMPC LUVs and in the LUV sized particles isolated in peak I after gel filtration of 2 hour incubation of 1.8 mM DMPC (PPDPC-labeled) LUVs with 18 µM rh-apoA-I. C. Anisotropy (r) of peak II and peak III, respectively, after gel filtration of a 2 hour incubation of 1.8 mM DMPC (DPH-labeled) LUVs with 18 µM rh-apoA-I. D. Pyrene excimer to monomer ratio (Ie/Im) of peak II and peak III, respectively, after gel filtration of a 2 hour incubation of 1.8 mM DMPC (PPDPC-labeled) LUVs with 18 µM rh-apoA-I. Anisotropy data is the mean of three 10-second integrated readings with a standard deviation of <1%. The Ie/Im data is based upon the mean of three emission wavelength scans, with an instrument standard deviation of 7%.
Fluorescence resonance energy transfer (FRET) assay for apoA-I interaction with LUV
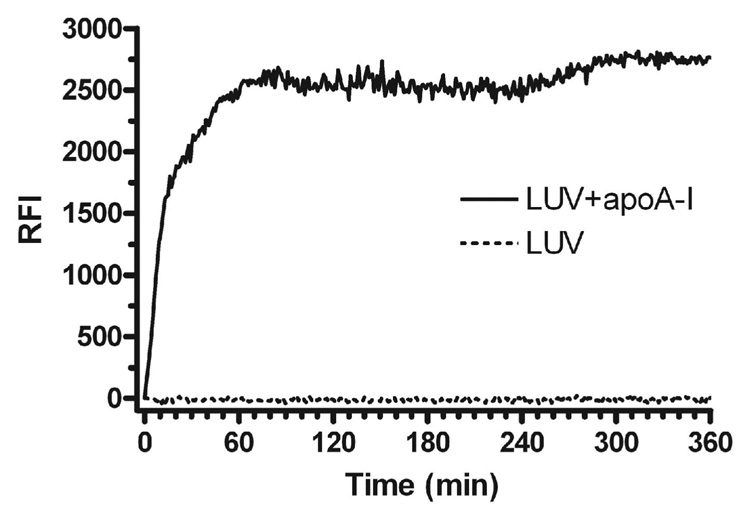
ApoA-I contains four tryptophan (Trp) and 7 tyrosine (Tyr) residues whose fluorescent emission spectra overlaps with the absorbance of DPH (λmax = 357 nm). Thus, we monitored the time course of the interaction of apoA-I with DPH labeled DMPC LUV by measuring FRET from Trp and Tyr in apoA-I to DPH in labeled DMPC LUV. When apoA-I was added to the DMPC LUVs, the FRET increased rapidly and dramatically (Figure 8, solid line). The FRET time course after adding apoA-I showed two distinct phases (observed in 5 separate experiments), a rapid and large increase that plateaus at about 60 minutes, and a second delayed and smaller increase in FRET that occurred between 250 and 300 minutes. Control studies with apoA-I alone (not shown) or with DPH labeled DMPC LUVS alone (Figure 8, dotted line) showed no evidence of increased FRET over time.
Figure 8.
Interaction of apoA-I with DMPC LUV as monitored by FRET. rh-apoA-I was added to DPH labeled (0.2 mole%) DMPC LUVs at a final concentration of 18 µM apoA-I and 1.8 mM DMPC. Interaction between apoA-I and the LUVs was monitored over time by FRET (solid line). The fluorescence intensity of DPH labeled DMPC LUVs without added apoA-I is also shown (dashed line).
Discussion
It has long been appreciated that apoA-I can spontaneously form small disc-like particles when incubated with DMPC dispersions and liposomes. An important determinant of the nature and the size of products of apoA-I incubations with DMPC is the ratio of DMPC to apoA-I (11;15). For example, Jonas et al. reported that incubation of DMPC SUVs with apoA-I at a ratio of 100:1 led to the formation of a small lipid-protein complex, without the occurrence of a larger intermediate sized complex (15). In addition, Jonas reported that no intermediates were observed in a time course study of DMPC and apoA-I at a ratio of 100:1, which led to the formation of primarily small discs (16). In their studies, apoA-I was fluorescently labeled and DMPC was radioactively labeled, and after incubation the products were separated by Sepharose CL-4B gel filtration; however, due to the lack of inline monitoring, the use of large fraction volumes, and the low resolving power of this particular gel filtration media to separate distinct discoidal apoA-I-DMPC complexes, the resolution of this system was low and intermediate complexes were not observable. In the current study using inline monitoring and a more suitable gel filtration media, we identified four distinct peaks of apoA-I-DMPC complexes, three of which were observed with a DMPC:apoA-I ratio of 100:1. Peak I contains both protein-free LUV, as well as LUV with bound apoA-I. ApoA-I was directly observed in this peak via fluorescence detection (Figure 1B), and its effects were also observed as changes in lipid fluidity and domains in this peak compared to the un-reacted LUVs. The amplitude of the protein in peak I decreased with increasing incubation time as LUVs were transformed into smaller complexes. Peaks II and III, corresponding to large and small discs, appeared sequentially during the apoA-I DMPC LUV incubation, in a manner suggesting that peak II may be converted into peak III. When apoA-I and DMPC LUVs were incubated for 15 h, the small discs in peak III became more prominent. Thus, we conclude that peak II large discs are intermediates in the formation of peak III small discs. This relationship was also evident upon incubation of isolated peak II complexes with additional apoA-I, leading to the formation of peak III (Figure 5).
Our cross-linking results demonstrate that the large discs in peak II contain three molecules of apoA-I, while the small discs in peak III contain two molecules of apoA-I. This finding is consistent with the results reported by Forte et al. (17). The lipid:apoA-I ratio for peak II large and peak III small discs are 175±17 and 120±13, respectively. Thus, the peak II large discs contain about 470 to 570 DMPC molecules. Our data are consistent with the binding of one additional apoA-I molecule to a large disc resulting in the formation of two small discs each with 2 molecules of apoA-I and about 235 to 285 DMPC molecules. These values overlap with our peak III experimental values of 214 to 266 DMPC molecules per particle.
We found increased pyrene excimer to monomer ratio in peak I when apoA-I was incubated with PPDPC labeled LUVs compared to the un-reacted labeled LUVs. The Ie/Im values reflect the lateral mobility as well as the local concentration of the fluorophore in the membrane (24;25). Thus, the increased Ie/Im of the peak I complex can result either from lateral segregation of the probe in domains or from an increased rate of lipid lateral diffusion. To resolve between these two mechanisms, we assessed lipid fluidity by measuring the fluorescence anisotropy of DPH labeled LUVs and peak I. Increasing DPH anisotropy is associated with decreased lipid lateral diffusion (26;27). Our data demonstrated that the lipid microenvironment became less fluid in the peak I complex in which apoA-I is bound to at least a fraction of the DMPC LUVs. Thus, the increase in Ie/Im in peak I must be due to an enrichment of PPDPC into microdomains formed upon apoA-I binding. We did not feel justified in comparing peak I directly to peaks II and III, since peak I may be a mixture of protein-free LUVs and LUV with bound apoA-I, while peaks II and III are exclusively lipid-protein complexes. However, upon comparing large discs in peak II with small discs in peak III, we found increased lipid fluidity in the small discs.
We used FRET (Figure 8) to trace the interaction of apoA-I with DMPC LUVs. Our finding of a very rapid interaction with a delayed second phase agrees with prior work from Jonas who showed that the binding of apoA-I with DMPC vesicles is very fast, while the formation of small complexes take several hours at 25°C (16). We interpret the first rapid phase of FRET to be due primarily to the binding of apoA-I to the surface of the LUVs generating peak I along with the formation the peak II large discs. The delayed FRET increase after 2 hours is consistent with the time course of the formation of peak III small discs, as FRET is expected to be higher in the peak III small discs vs. peak II large discs due to the increased ratio of protein (FRET donor) to lipid (FRET acceptor) in the small discs (2:240) compared to the large discs (3:525). Previously, Segall et al. showed that apoA-I mediated clearance of a turbid solution of DMPC MLVs is a second order biphasic reaction with simultaneous fast and slow phases (28). In comparing different apolipoproteins and an amphipathic peptide, the turbidity clearance rate differed, and was related to the extent of helical flexibility. However, in each case a biphasic reaction was observed, which was attributed to two protein binding sites with differing affinities on the lipid surface (28). Our demonstration of a larger intermediate in the formation of the smaller peak III complexes, and the two-phase FRET kinetics could provide another factor that could contribute to the two-phase clearance reaction, as both the large and small complexes scatter light (large > small), and the conversion of peak II to peak III complexes would affect turbidity levels.
As previously characterized (12;15), we also found that the equilibrium pattern of apoA-I-DMPC complexes formed was dependent upon the lipid to protein mole ratio (Figure 2). At a ratio of 200:1, the large and small discs of peaks II and III predominated. At a ratio of 100:1, most of the product is found in the small discs of peak III. At a ratio of 50:1, peak III as well as a new smaller peak IV predominated. The time course of DMPC LUV interaction with apoA-I (Figure 1, 100:1 ratio) revealed that large discs of peak II are an intermediate in the formation of the small discs of peak III. Thus, at a ratio of 200:1 the equilibrium peak II large discs could not be completely converted to the peak III small discs. When peak II large discs were isolated, incubated overnight, and reloaded to the column, most of the material eluted in peak II, indicating that the peak II large discs are rather stable. However, when the peak II large discs were incubated with additional apoA-I, the particles resolved into peak III. Thus, we conclude that the formation of discs in the presence of sufficient apoA-I progresses from large to small discs.
Forte et al. used electron microscopy to investigate complex formation at DMPC:apoA-I mole ratios of 100:1 and 300:1 At a lipid:protein ratio of 100:1, the main products are small discs of 9.64 ± 0.08 nm that contain two apoA-I molecules, but some large discs could also be found. At a lipid:protein ratio of 300:1, both large 16.9–18.7 nm discs and small 9.7 nm discs exist together, containing three and two molecules of apoA-I, respectively (17). We speculate that these products correspond directly to the peak II and peak III complexes observed in the current study. We also note that gel filtration and EM are probably better methods to determine apoA-I DMPC complex size than non denaturing gradient gel electrophoresis (commonly used for sizing these particle and used in the present study), which is sensitive to both lipid and protein net charge.
The methods employed in the current report restricted our study to the non-physiological lipid DMPC, as we could not observe significant apoA-I binding to, or complex formation from, LUVs made from the physiological palmitoyl-oleoyl phosphatidylcholine (POPC) or a natural mixture found in egg derived phosphatidylcholine (data not shown). It is possible that the short chain length and high lipid phase transition temperature of DMPC (~23°C) may play roles in its ability to spontaneously produce apoA-I lipid discs in contrast to physiological lipids; however, this topic requires further research. Although, apoA-I can form discs with POPC using the cholate dialysis method, this in vitro procedure does not seem to be a likely model for the cellular lipidation of apoA-I mediated by ABCA1.
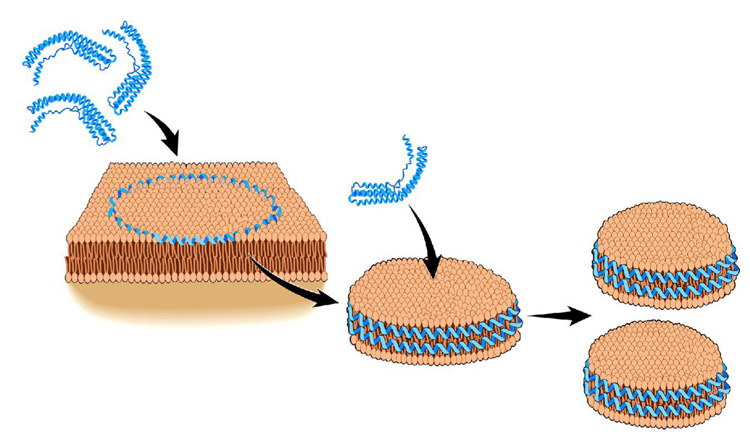
Figure 9 shows a model in which the folded helical lipid-free apoA-I unfolds and intercalates into the DMPC LUV. A trimer of apoA-I forms a constrained lipid domain on the LUV surface and subsequently releases an 11 nm disc containing three apoA-I molecules and ~ 500 DMPC molecules. An additional apoAI can interact with this disc resulting in the formation of two 8.6 nm discs, each containing two apoA-I molecules and ~250 DMPC molecules. Based upon the salt bridge (29), fluorescent (30;31), and cross linking data (3;23), we believe that apoA-I exists in a belt like confirmation in the 11 and 8.6 nm discs. It is possible that the 11 nm discs contain 2 antiparallel apoA-I belts with an additional apoA-I in a hairpin confirmation.
Figure 9.
Model for formation of apoA-I-DMPC discs. Three molecules of lipid-free apoA-I, each a helix bundle, intercalate into the DMPC LUV generating a constricted domain, which can pop out into an 11 nm disc containing three molecules of apoA-I and ~ 500 molecules of DMPC. An additional lipid-free apoA-I can bind to this large disc generating two 8.6 nm discs, each with two molecules of apoA-I and ~250 molecules of DMPC.
An alternate interpretation of our data is possible. At the beginning of the interaction of apoA-I with the DMPC LUVs, the effective concentration of the lipid is very high, which could drive the production of the larger peak II particles, with apoA-I taking up the lipid by accretion a few molecules at a time. This reaction could rapidly pass through the smaller sized peak III particles to produce the larger peak II particles. With time, the free lipid concentration would decrease, and the newly formed particles would only be driven as far as the smaller peak III particles. The final distribution of large and small particles would be driven by equilibration, depending on the ratio of DMPC:apoA-I. We believe that it is more likely that apoA-I can directly pop out a domain of DMPC bilayer (as depicted in Fig. 9), than acquire individual DMPC molecules by accretion, as we have never observed lipid tracers in the lipid-poor apoA-I peak in gel filtration (Fig 1A).
We speculate that cell mediated lipidation of apoA-I occurs by a process, analogous to the interaction of apoA-I with DMPC LUVs, in which ABCA1 mediates the binding of an apoA-I oligomer to a patch of a cellular membrane (perhaps an endosomal membrane) allowing an intact nascent disc to be shed, which consists of multiple apoA-I molecules and the phospholipid and cholesterol derived from the membrane. This proposed mechanism is in contrast to an alternative mechanism in which ABCA1 acts to sequentially load apoA-I with lipids, building up by accretion a disc like complex that can then be released from the cell. Previously, Forte et al. studied nascent discoidal HDL formation from lipid poor apoA-I incubated with CHO cells, and their conclusions support this alternative sequential lipid loading model (32). Forte et al. found the apparent successive maturation of a small 7.3 nm particle into 9.0 and 11.0 nm particles over a 1 to 24 hour time course using nondenaturing gradient gel electrophoresis (32). We and others have found that lipid-free apoA-I migrates at ~7.1 to 7.3 nm (12), and whether Forte’s 7.3 nm apoA-I contained lipid or not was not demonstrated. It is possible that 9.0 nm particles can be converted into 11.0 nm particles by cells, although isolation of the 9.0 nm particle and re-incubation with cells was not performed to prove this point. Nevertheless, the current study clearly demonstrates that cell free lipidation of apoA-I with DMPC LUVs can generate an 11 nm particle, which when isolated and incubated with additional apoA-I can form a smaller 8.6 nm particle. Future studies are required to distinguish between these alternative models of cell mediated apoA-I lipidation.
Abbreviations
- apoA-I
apolipoprotein A-I
- DMPC
1,2-dimyristoyl-sn-glycero-3-phosphocholine
- DSS
disuccinimidyl suberate
- DPPC
1,2-dipalmitoyl-sn-glycero-3-phosphocholine
- DPH
diphenylhexatriene
- FRET
fluorescence resonance energy transfer
- POPC
1-palmitoyl-2-oleoyl-sn-glycerol-3 phosphocholine
- PPDPC
1-palmitoyl-2-(pyrene-1-yl)decanoyl-sn-glycero-3-phosphocholine
- Ie/Im
excimer-to-monomer ratio of PPDPC
- LUV
large unilamellar vesicle
- r
anisotropy
- RFI
relative fluorescence intensity
Footnotes
This work was supported by Grant R01 HL-66082 from the National Institutes of Health to J.D.S.
References
- 1.Gordon DJ, Probstfield JL, Garrison RJ, Neaton JD, Castelli WP, Knoke JD, Jacobs DR, Jr, Bangdiwala S, Tyroler HA. High-density lipoprotein cholesterol and cardiovascular disease. Four prospective American studies. Circulation. 1989;79:8–15. doi: 10.1161/01.cir.79.1.8. [DOI] [PubMed] [Google Scholar]
- 2.Fielding CJ, Fielding PE. Molecular physiology of reverse cholesterol transport. J. Lipid Res. 1995;36:211–228. [PubMed] [Google Scholar]
- 3.Bhat S, Sorci-Thomas MG, Alexander ET, Samuel MP, Thomas MJ. Intermolecular contact between globular N-terminal fold and C-terminal domain of ApoA-I stabilizes its lipid-bound conformation: studies employing chemical cross-linking and mass spectrometry. J. Biol. Chem. 2005;280:33015–33025. doi: 10.1074/jbc.M505081200. [DOI] [PubMed] [Google Scholar]
- 4.Sparks DL, Davidson WS, Lund-Katz S, Phillips MC. Effect of cholesterol on the charge and structure of apolipoprotein A-I in recombinant high density lipoprotein particles. J. Biol. Chem. 1993;268:23250–23257. [PubMed] [Google Scholar]
- 5.Wang M, Briggs MR. HDL: the metabolism, function, and therapeutic importance. Chem. Rev. 2004;104:119–137. doi: 10.1021/cr020466v. [DOI] [PubMed] [Google Scholar]
- 6.Duong PT, Collins HL, Nickel M, Lund-Katz S, Rothblat GH, Phillips MC. Characterization of nascent HDL particles and microparticles formed by ABCA1-mediated efflux of cellular lipids to apoA-I. J. Lipid Res. 2006;47:832–843. doi: 10.1194/jlr.M500531-JLR200. [DOI] [PubMed] [Google Scholar]
- 7.Jonas A. Reconstitution of high-density lipoproteins. Methods Enzymol. 1986;128:553–582. doi: 10.1016/0076-6879(86)28092-1. [DOI] [PubMed] [Google Scholar]
- 8.Brouillette CG, Anantharamaiah GM, Engler JA, Borhani DW. Structural models of human apolipoprotein A-I: a critical analysis and review. Biochim. Biophys. Acta. 2001;1531:4–46. doi: 10.1016/s1388-1981(01)00081-6. [DOI] [PubMed] [Google Scholar]
- 9.Jonas A, Krajnovich DJ, Patterson BW. Physical properties of isolated complexes of human and bovine A-I apolipoproteins with L-alpha-dimyristoyl phosphatidylcholine. J. Biol. Chem. 1977;252:2200–2205. [PubMed] [Google Scholar]
- 10.Surewicz WK, Epand RM, Pownall HJ, Hui SW. Human apolipoprotein A-I forms thermally stable complexes with anionic but not with zwitterionic phospholipids. J. Biol. Chem. 1986;261:16191–16197. [PubMed] [Google Scholar]
- 11.Fang Y, Gursky O, Atkinson D. Lipid-binding studies of human apolipoprotein A-I and its terminally truncated mutants. Biochemistry. 2003;42:13260–13268. doi: 10.1021/bi0354031. [DOI] [PubMed] [Google Scholar]
- 12.Li L, Chen J, Mishra VK, Kurtz JA, Cao D, Klon AE, Harvey SC, Anantharamaiah GM, Segrest JP. Double belt structure of discoidal high density lipoproteins: molecular basis for size heterogeneity. J. Mol. Biol. 2004;343:1293–1311. doi: 10.1016/j.jmb.2004.09.017. [DOI] [PubMed] [Google Scholar]
- 13.Massey JB, Pownall HJ. Role of oxysterol structure on the microdomain-induced microsolubilization of phospholipid membranes by apolipoprotein A-I. Biochemistry. 2005;44:14376–14384. doi: 10.1021/bi051169y. [DOI] [PubMed] [Google Scholar]
- 14.Tricerri MA, Toledo JD, Sanchez SA, Hazlett TL, Gratton E, Jonas A, Garda HA. Visualization and analysis of apolipoprotein A-I interaction with binary phospholipid bilayers. J. Lipid Res. 2005;46:669–678. doi: 10.1194/jlr.M400340-JLR200. [DOI] [PubMed] [Google Scholar]
- 15.Jonas A, Drengler SM, Patterson BW. Two types of complexes formed by the interaction of apolipoprotein A-I with vesicles of L-alpha-dimyristoylphosphatidylcholine. J. Biol. Chem. 1980;255:2183–2189. [PubMed] [Google Scholar]
- 16.Jonas A, Drengler SM. Kinetics and mechanism of apolipoprotein A-I interaction with L-alpha-dimyristoylphosphatidylcholine vesicles. J. Biol. Chem. 1980;255:2190–2194. [PubMed] [Google Scholar]
- 17.Forte TM, Nichols AV, Selmek-Halsey J, Caylor L, Shore VG. Lipid-poor apolipoprotein A-I in Hep G2 cells: formation of lipid-rich particles by incubation with dimyristoylphosphatidylcholine. Biochim. Biophys. Acta. 1987;920:185–194. doi: 10.1016/0005-2760(87)90094-4. [DOI] [PubMed] [Google Scholar]
- 18.Epand RM. The apparent preferential interaction of human plasma high density apolipoprotein A-I with gel-state phospholipids. Biochim. Biophys. Acta. 1982;712:146–151. doi: 10.1016/0005-2760(82)90096-0. [DOI] [PubMed] [Google Scholar]
- 19.Peng DQ, Wu Z, Brubaker G, Zheng L, Settle M, Gross E, Kinter M, Hazen SL, Smith JD. Tyrosine modification is not required for myeloperoxidase-induced loss of apolipoprotein A-I functional activities. J. Biol. Chem. 2005;280:33775–33784. doi: 10.1074/jbc.M504092200. [DOI] [PubMed] [Google Scholar]
- 20.Markwell MA, Haas SM, Bieber LL, Tolbert NE. A modification of the Lowry procedure to simplify protein determination in membrane and lipoprotein samples. Anal. Biochem. 1978;87:206–210. doi: 10.1016/0003-2697(78)90586-9. [DOI] [PubMed] [Google Scholar]
- 21.Huang H, Schroeder F, Estes MK, McPherson T, Ball JM. Interaction(s) of rotavirus non-structural protein 4 (NSP4) C-terminal peptides with model membranes. Biochem. J. 2004;380:723–733. doi: 10.1042/BJ20031789. [DOI] [PMC free article] [PubMed] [Google Scholar]
- 22.Zhao H, Rinaldi AC, Di Giulio A, Simmaco M, Kinnunen PK. Interactions of the antimicrobial peptides temporins with model biomembranes. Comparison of temporins B and L. Biochemistry. 2002;41:4425–4436. doi: 10.1021/bi011929e. [DOI] [PubMed] [Google Scholar]
- 23.Silva RA, Hilliard GM, Li L, Segrest JP, Davidson WS. A mass spectrometric determination of the conformation of dimeric apolipoprotein A-I in discoidal high density lipoproteins. Biochemistry. 2005;44:8600–8607. doi: 10.1021/bi050421z. [DOI] [PubMed] [Google Scholar]
- 24.Kinnunen PK, Koiv A, Mustonen P. Fluorescence Spectroscopy. New York: Spinger-Verlag; 1993. [Google Scholar]
- 25.Duportail G, Lianos P. Vesicles. New York: Marcel Dekker; 1996. [Google Scholar]
- 26.Lehtonen JY, Kinnunen PK. Changes in the lipid dynamics of liposomal membranes induced by poly(ethylene glycol): free volume alterations revealed by inter- and intramolecular excimer-forming phospholipid analogs. Biophys. J. 1994;66:1981–1990. doi: 10.1016/S0006-3495(94)80991-9. [DOI] [PMC free article] [PubMed] [Google Scholar]
- 27.Holopainen JM, Lehtonen JY, Kinnunen PK. Lipid microdomains in dimyristoylphosphatidylcholine-ceramide liposomes. Chem. Phys. Lipids. 1997;88:1–13. doi: 10.1016/s0009-3084(97)00040-6. [DOI] [PubMed] [Google Scholar]
- 28.Segall ML, Dhanasekaran P, Baldwin F, Anantharamaiah GM, Weisgraber KH, Phillips MC, Lund-Katz S. Influence of apoE domain structure and polymorphism on the kinetics of phospholipid vesicle solubilization. J. Lipid Res. 2002;43:1688–1700. doi: 10.1194/jlr.m200157-jlr200. [DOI] [PubMed] [Google Scholar]
- 29.Segrest JP, Jones MK, Klon AE, Sheldahl CJ, Hellinger M, De Loof H, Harvey SC. A detailed molecular belt model for apolipoprotein A-I in discoidal high density lipoprotein. J. Biol. Chem. 1999;274:31755–31758. doi: 10.1074/jbc.274.45.31755. [DOI] [PubMed] [Google Scholar]
- 30.Li H, Lyles DS, Thomas MJ, Pan W, Sorci-Thomas MG. Structural determination of lipid-bound ApoA-I using fluorescence resonance energy transfer. J. Biol. Chem. 2000;275:37048–37054. doi: 10.1074/jbc.M005336200. [DOI] [PubMed] [Google Scholar]
- 31.Panagotopulos SE, Horace EM, Maiorano JN, Davidson WS. Apolipoprotein A-I adopts a belt-like orientation in reconstituted high density lipoproteins. J. Biol. Chem. 2001;276:42965–42970. doi: 10.1074/jbc.M106462200. [DOI] [PubMed] [Google Scholar]
- 32.Forte TM, Goth-Goldstein R, Nordhausen RW, McCall MR. Apolipoprotein A-I-cell membrane interaction: extracellular assembly of heterogeneous nascent HDL particles. J. Lipid Res. 1993;34:317–324. [PubMed] [Google Scholar]


