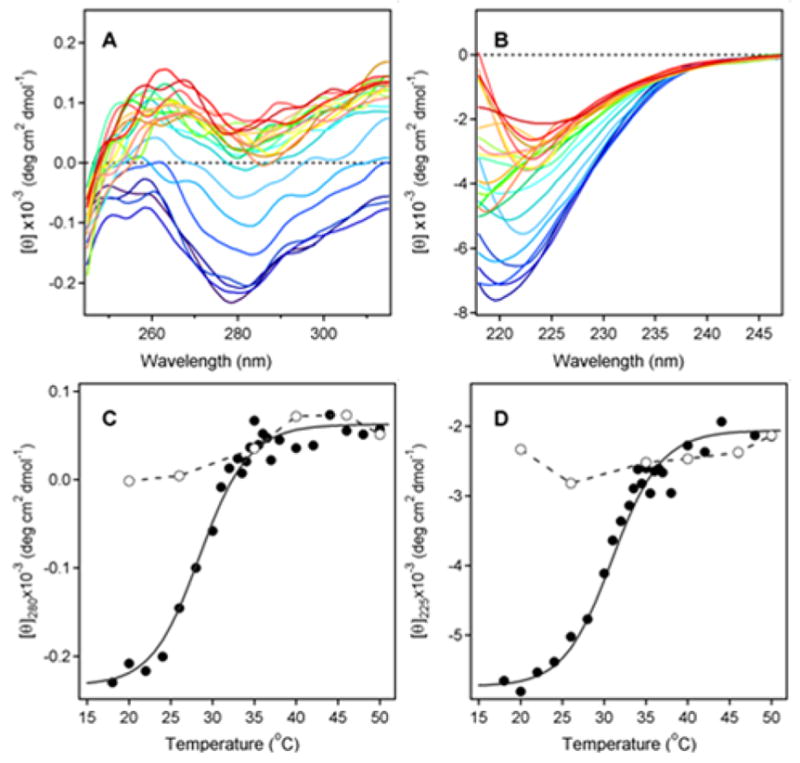
Figure 1.

Temperature-Induced Unfolding of the PT S1 Subunit. (A–B): 37.4 μg of PT S1 was dissolved in 0.225 ml of 20 mM Na-phosphate buffer (pH 7.4) containing 150 mM NaCl and 10 mM β-ME. Thermotropic conformational changes to the structure of PT S1 were then monitored by near-UV CD (A) and far-UV CD (B). Both measurements were conducted on the same sample with the use of a 4-mm optical path-length rectangular quartz cuvette. Samples were equilibrated for 4 min at each temperature before measurements were taken. CD spectra were recorded from 200–315 nm, which covers both the near-UV and far-UV range. The change in color from blue to red corresponds to a change in temperature from 18°C to 50°C, as shown in panels C & D. (C–D): Thermal unfolding profiles for PT S1 tertiary structure (C) and PT S1 secondary structure (D) were derived from the data in panels A & B. The mean residue molar ellipticities at 280 nm (near-UV CD; tertiary structure) and 225 nm (far-UV CD; secondary structure) were plotted as a function of temperature. As described in Experimental Procedures, curves were simulated according to a two-state phase transition approach using the following best-fit parameters: heat capacities were ΔC = 0.39 kcal mol−1 K−1, and the values of ΔH were 55.0 kcal mol−1. The open circles represent measurements taken at the indicated temperatures during sample cooling from 50°C to 18°C.
