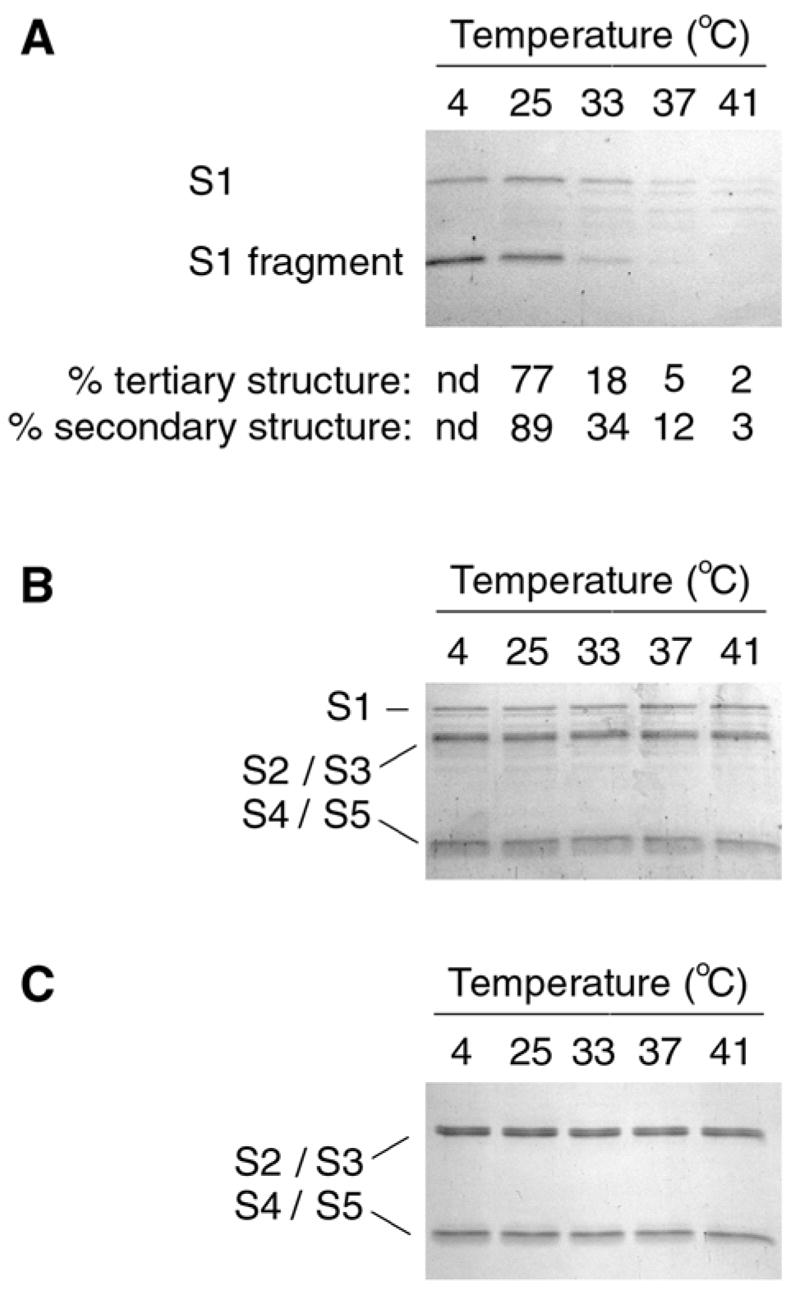
Figure 2.

PT S1 Protease Sensitivity Assay. (A): PT S1 was placed in 20 mM Na-phosphate buffer (pH 7.0) containing 10 mM β-ME. Toxin samples were incubated for 45 min at the indicated temperatures and then shifted to 4°C for 10 min. Thermolysin was subsequently added for another 45 min at 4°C. Samples were visualized by SDS-PAGE and Coomassie staining. The percentage of native tertiary or secondary structure remaining in PT S1 at the indicated temperatures was calculated from the thermal unfolding profiles presented in Figs. 1C & 1D, respectively. nd; not determined. (B–C): PT (B) and PT B (C) were processed as described above for PT S1. The subunits of PT are identified: S1 (26 kDa), S2/S3 (~22 kDa each), and S4/S5 (11–12 kDa).
