Abstract
OBJECTIVE—In vitro expansion of β-cells from adult human islets could solve the tissue shortage for cell replacement therapy of diabetes. Culture of human islet cells typically results in <16 cell doublings and loss of insulin expression. Using cell lineage tracing, we demonstrated that the expanded cell population included cells derived from β-cells. Understanding the molecular mechanisms involved in β-cell fate in vitro is crucial for optimizing expansion and redifferentiation of these cells. In the developing pancreas, important cell-fate decisions are regulated by NOTCH receptors, which signal through the hairy and enhancer of split (HES)-1 transcriptional regulator. Here, we investigated the role of the NOTCH signaling pathway in β-cell dedifferentiation and proliferation in vitro.
RESEARCH DESIGN AND METHODS—Isolated human islets were dissociated into single cells. β-Cells were genetically labeled using a Cre-lox system delivered by lentiviruses. Cells were analyzed for changes in expression of components of the NOTCH pathway during the initial weeks in culture. HES-1 expression was inhibited by a small hairpin RNA (shRNA), and the effects on β-cell phenotype were analyzed.
RESULTS—Human β-cell dedifferentiation and entrance into the cell cycle in vitro correlated with activation of the NOTCH pathway and downregulation of the cell cycle inhibitor p57. Inhibition of HES-1 expression using shRNA resulted in significantly reduced β-cell replication and dedifferentiation.
CONCLUSIONS—These findings demonstrate that the NOTCH pathway is involved in determining β-cell fate in vitro and suggest possible molecular targets for induction of β-cell redifferentiation following in vitro expansion.
Replacement of β-cells by transplantation is a promising approach for treatment of type 1 diabetes; however, its application on a large scale is limited by the availability of pancreas donors. In a normal adult pancreas, a slow rate of β-cell renewal is responsible for maintenance of an adequate functional β-cell mass. This rate is accelerated in conditions of increased demands for insulin, such as pregnancy (1) and obesity (2). Work in an animal model demonstrated that new β-cells are generated in adult mice predominantly by replication of preexisting β-cells rather than by neogenesis from insulin-negative stem/progenitor cells (3). This finding has raised hopes for recapitulation of β-cell expansion in cultures of adult human islets. However, previous attempts at in vitro expansion of adult human β-cells resulted in a limited number of cell population doublings and loss of insulin expression (4–7). Insulin-negative cells with a considerable proliferative capacity were derived from cultured human islets (8–10). Insulin expression in these cells could be induced by changing the culture conditions; however, its levels were low and varied among donors (8–10). One possible interpretation of these results is that β-cells survive, dedifferentiate, and divide in culture. Recently, we applied a genetic cell lineage tracing approach for labeling cultured adult human islets and demonstrated that, in contrast to mouse β-cells (11–14), dedifferentiated, label-positive cells derived from human β-cells could be induced to significantly proliferate in vitro (15). These cells may be of value for development of cell therapy for type 1 diabetes, since they may retain some β-cell–specific chromatin structure to allow their redifferentiation. Understanding the molecular mechanisms involved in β-cell dedifferentiation and replication in vitro may facilitate the expansion and redifferentiation of these cells.
In the developing pancreas, important cell-fate decisions, including the switch from proliferation to differentiation, and the choice between exocrine and endocrine fates (16), as well as among different endocrine fates (17–19), are regulated by the NOTCH signaling pathway. Expression of NOTCH ligands on a differentiating cell inhibits development of the same phenotype in neighboring cells, in a mechanism termed lateral inhibition (16). Ligand binding to NOTCH receptors on a neighboring cell results in cleavage of the NOTCH intracellular domain (NICD), which enters the nucleus and forms a complex that modulates gene expression (20). The hairy and enhancer of split (HES) family of transcriptional regulators is a major target of the NICD complex. In fetal pancreata, HES-1 acts as an inhibitor of neurogenin 3 (NGN3) gene expression, which is required for islet development (21). In addition, HES-1 regulates the cell cycle by inhibiting expression of genes encoding the cyclin kinase inhibitors p27 and p57 (22,23). Some evidence suggests that it may also inhibit insulin gene expression (17). Overall, HES-1 is associated with promoting cell replication and preventing cell differentiation. Forced expression of NOTCH inhibits pancreas cell differentiation (17,18), while mice with null mutations in genes encoding NOTCH pathway components exhibit accelerated differentiation of endocrine pancreas (16,21). The NOTCH pathway is not normally expressed in the adult pancreas; however, it is activated in conditions associated with cell dedifferentiation and replication, such as regeneration following experimental pancreatitis (24), pancreatic neoplasia (25), metaplasia of cultured pancreatic exocrine cells (26), and in rat β-cells exposed to cytokines (27).
We hypothesized that β-cell dedifferentiation and entrance into the cell cycle in vitro involve induction of the NOTCH pathway. Our findings demonstrate a considerable activation of the NOTCH pathway in these cells, which correlates with downregulation of the cell cycle inhibitor p57 and loss of insulin expression. Inhibition of HES-1 expression using small hairpin RNA (shRNA) results in reduced replication of cultured β-cells and a decrease in cell dedifferentiation. These findings suggest possible molecular targets for prevention of β-cell dedifferentiation in culture or induction of cell redifferentiation following in vitro expansion.
RESEARCH DESIGN AND METHODS
Islet cell culture.
Islets were received 2–3 days following isolation. Islets from individual donors were dissociated into single cells and cultured in CMRL-1066 medium containing 5.6 mmol/l glucose and supplemented with 10% fetal bovine serum (FBS), 100 units/ml penicillin, 100 μg/ml streptomycin, 100 μg/ml gentamicin, and 5 μg/ml amphotericine B as described (8). The cultures were refed twice a week and split 1:2 once a week.
HES-1 inhibition and lineage tracing.
HES1 shRNAs (accession nos. TRCN 18989, 18990, 18991, and 18993) and a nontarget shRNA, cloned in pLKO.1 lentiviral vector, were obtained from the RNAi Consortium (Sigma-Aldrich). Virus was produced in 293T cells following cotransfection with the pCMVdR8.91 and pMD2.G packaging plasmids. The culture medium was harvested 48 h later. Islet cells cultured for 1–2 days were washed with PBS and infected at multiplicity of infection 2.5:1 in CMRL-1066 medium containing 8 μg/ml polybrene overnight. The medium was then replaced with regular culture medium. Four days after infection, the cells were selected for puromycin resistance (1 μg/ml) for 3 days. Two weeks after infection, the cells were harvested for further analysis. For γ-secretase inhibition, 5 μmol/l of l-685,458 (Calbiochem) were added to cells at passage 2 (P2) for 17 h. Lineage tracing was performed using the RIP-Cre and pTrip cytomegalo virus (CMV)-loxP-DsRed2-loxP–enhanced green fluorescent protein (eGFP) viruses as described (15). Briefly, islet cells cultured for 1–2 days were infected with a 1:1:1 mixture of the three viruses (shRNA plus RIP-Cre plus pTrip CMV-loxP-DsRed2-loxP-eGFP) at a total multiplicity of infection 4:1. Selection and further analysis were carried out as described above.
RNA analyses.
Total RNA was extracted using a High Pure RNA isolation kit (Roche). cDNA was synthesized using SuperScript III (Invitrogen). qPCR was performed using a Prism 7300 ABI Real-Time PCR System (Applied Biosystems). The Assay-On-Demand (Applied Biosystems) TaqMan fluorogenic probes that were used in this study are listed in Table 1. Relative quantitative analysis was performed according to the comparative computed tomography method by using the arithmetic formula 2−(ΔΔct). The cDNA levels were normalized to human ribosomal protein P0 cDNA.
TABLE 1.
Assay-on-Demand (Applied Biosystems) TaqMan fluorogenic probes used in the study
| Gene | Probe |
|---|---|
| DLL1 | Hs00194509_m1 |
| HES1 | Hs00172878_m1 |
| Insulin | Hs00355773_m1 |
| JAG2 | Hs00171432_m1 |
| NEUROD1 | Hs00159598_m1 |
| NOTCH1 | Hs00413187_m1 |
| NOTCH2 | Hs01050706_m1 |
| NOTCH3 | Hs01128547_m1 |
| NOTCH4 | Hs00965897_m1 |
| p57 | Hs00175938_m1 |
| PDX1 | Hs00426216_m1 |
| RPLP0 | Hs99999902_m1 |
Immunofluorescence.
Cells were plated in 24-well plates on sterilized coverslips and fixed in 4% paraformaldehyde. Cells were permeabilized with 0.25% NP40 for 10 min and blocked for 10 min at room temperature in 1% BSA, 10% FBS, and 0.2% saponin. Cells were then incubated with the following primary antibodies diluted in blocking solution overnight at 4°C: mouse anti-insulin (1:1,000; Sigma-Aldrich), rabbit anti-p57 (1:500; Santa Cruz), rabbit anti–HES-1 (1:1,000; Chemicon), mouse anti-Ki67 (1:200; Zymed), rabbit anti-Ki67 (1:50; Zymed), mouse anti–bromo-deoxyuridine (BrdU) (1:20), rabbit anti-NICD (1:10; Cell Signaling), mouse anti–green fluorescent protein (1:500; Chemicon), and rabbit anti-GFP (1:1,000; Invitrogen). The bound antibody was visualized with a fluorescent secondary antibody (anti-mouse or anti-rabbit AMCA [1:200; Jackson], anti-mouse or anti-rabbit Cy3 [1:200; Biomeda], and anti-mouse or anti-rabbit Alexa Fluor 488 [1:200; Molecular Probes]) under a Zeiss confocal microscope. The specificity of the primary antibodies was demonstrated using FDC human colon fibroblast cells (data not shown). The specificity of the rabbit anti–HES-1 antibody from Chemicon was determined using LAN-5 human neuroblastoma cells as a negative control and human bone marrow mesenchymal stem cells as a positive control. The lack of HES-1 expression in LAN-5 cells and its presence in bone marrow mesenchymal stem cells were demonstrated using immunoblotting with a different HES-1 antibody (see below). Lack of HES1 mRNA in LAN-5 cells was previously reported (28). Nuclei were visualized by staining with DAPI (Roche) for 5 min at room temperature. BrdU staining was performed following a 24-h labeling period as previously described (29).
Immunoblotting.
Total cellular protein was extracted in 0.5% NP40 containing a protease inhibitor cocktail (Roche). Protein concentration was determined by the bicinchoninic acid method (Pierce, Rockford, IL). A total of 70 μg protein were separated on 12% SDS-PAGE and electroblotted onto polyvinylidene fluoride membranes. The membranes were incubated with rabbit anti–HES-1 (1:1,000; a gift from T. Sudo), rat anti–NOTCH-1 (1:100; DSHB), or rabbit anti–poly (ADP-ribose) polymerase (PARP) (1:1,000; Cell Signaling). Loading was monitored using goat anti–β-actin or mouse anti–heat shock cognate protein 70 (HSC70) (1:1,000; Santa Cruz). The bound antibody was visualized with the appropriate horseradish peroxidase–conjugated anti-IgG (Jackson) and SuperSignal West Pico Chemiluminescent Substrate (Pierce). Signal intensity was quantitated using TINA software. Cells treated with 1 μmol/l staurosporine for 6 h were used as positive control for the PARP blot.
Apoptosis assay.
Terminal uridine deoxynucleotidyl transferase dUTP nick-end labeling assay was performed using a Chemicon ApopTag Fluorescein In Situ Apoptosis Detection Kit according to the instructions of the manufacturer. Cells at P0 were stained 24 h following culture initiation. Cells were costained for insulin as described above.
Insulin content and secretion.
Glucose-stimulated insulin secretion and insulin content were assayed as described (8).
Statistical analysis.
Significance was determined using Student's t test. To approach a normal distribution of the qPCR data, a logarithmic transformation was performed. To account for multiple testing, the Bonferroni correction was applied.
RESULTS
Upregulation of HES-1 in cultured human β-cells.
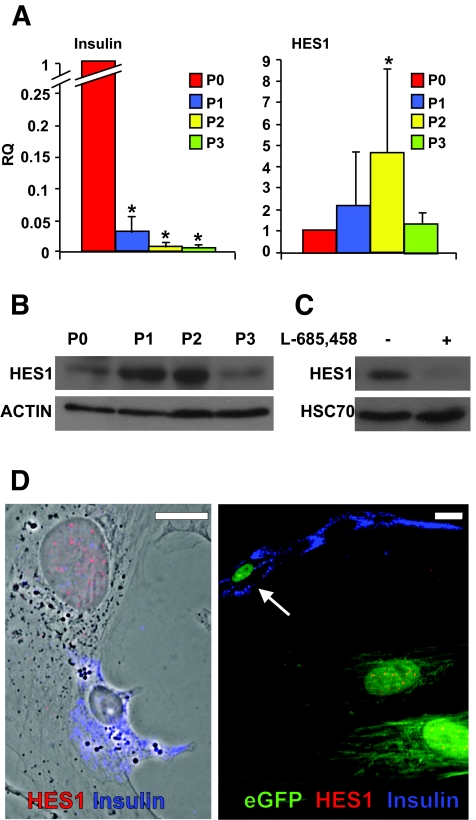
Human islets were isolated from nine donors, six males and three females aged 38–60 years (mean age 50 ± 8), with a purity ranging between 65 and 85% (mean 78 ± 6%). Islets from each donor were dissociated and expanded in culture as described (8). Quantitative RT-PCR (qPCR) analyses of RNA extracted from these cells during the first 2 weeks of culture revealed a rapid dedifferentiation, as previously reported (8), which was manifested in a drastic decrease in insulin mRNA levels, averaging 166-fold (P = 8.7 × 10⁻⁷ at P2) (Fig. 1A) (see data on cells from individual donors in online appendix Fig. 1 [available at http://dx.doi.org/10.2337/db07-1323]). Concomitant with this decrease, an increase in HES1 mRNA was observed in cells from all donors, averaging 4.6-fold (P = 0.006 at P2) within the first 2 weeks of culture (Fig. 1A). A similar increase was noted in HES-1 protein levels (Fig. 1B). At both RNA and protein levels, the wave of HES-1 upregulation peaked within the first 2 weeks of culture and was downregulated thereafter. To demonstrate that HES-1 upregulation in this system was dependent on NOTCH activation, we used an inhibitor of γ-secretase, the protease complex required for generation of NICD (30). As seen in Fig. 1C, cell incubation with the inhibitor resulted in 10-fold lower HES-1 levels, supporting a NOTCH-dependent mechanism. Immunostaining could not detect significant HES-1 expression in nuclei of cells with intense insulin staining (Fig. 1D). In contrast, HES-1 was clearly detected in insulin-negative cells. To monitor HES-1 expression in dedifferentiated cells derived from β-cells, β-cells in freshly isolated islets were heritably labeled using a cell lineage tracing approach recently developed in our laboratory (15). The labeling approach is based on cell infection with a mixture of two lentivirus vectors: one expressing Cre recombinase under the insulin promoter (RIP-Cre) and the other a reporter cassette in which the CMV promoter is separated from an eGFP gene by a loxP-flanked stop region. Removal of the stop region in β-cells infected by both viruses activates eGFP expression specifically in these cells, thereby allowing continuous tracking of β-cell fate after insulin expression is lost. Residual insulin expression in β-cells during the initial days in culture provides a sufficient window of time for RIP-Cre expression and eGFP activation. Using this method, 57.5 ± 8.9% of insulin-positive cells were labeled with eGFP (15). Analysis of the cells expanded in culture following labeling revealed HES-1 staining in cells that lost insulin expression but maintained eGFP expression, demonstrating that they were derived from β-cells (Fig. 1D). A total of 89.3 ± 0.1% of eGFP+ insulin-negative cells were HES-1+ (based on counting >200 cells in cultures from each of three donors).
FIG. 1.
Upregulation of HES-1 in cultured human islet cells and eGFP+ cells derived from β-cells correlates with downregulation of insulin. A: qPCR analysis of RNA extracted from islet cells derived from nine donors. P indicates passage number and weeks in culture. RQ indicates relative quantification compared with P0, which represents islet cells at culture initiation. Data are means ± SD (n = 9). Asterisks indicate statistical significance, compared with P0 (P < 3.3 × 10⁻⁵ for insulin and P < 0.006 for HES1). The increase in HES1 mRNA levels at P1 was marginally significant (P = 0.06). B: Immunoblotting for HES-1 in protein extracted from islet cells at the indicated passage number. β-Actin served as a loading control. C: Immunoblotting for HES-1 in protein extracted from islet cells at P2, following a 17-h incubation with the γ-secretase inhibitor l-685458. HSC70 served as a loading control. D: Immunofluorescence analysis of islet cells (left panel) and eGFP+ cells derived from β-cells (right panel) following 10 days in culture. The left panel is merged with a phase contrast image. Arrow points to a β-cell that still expresses insulin and is not labeled for HES-1. eGFP is detected in both cytoplasm and nucleus. Bar = 20 μm. (Please see http://dx.doi.org/10.2337/db07-1323 for a high-quality digital representation of this figure.)
Changes in expression of components of the NOTCH pathway in cultured human β-cells.
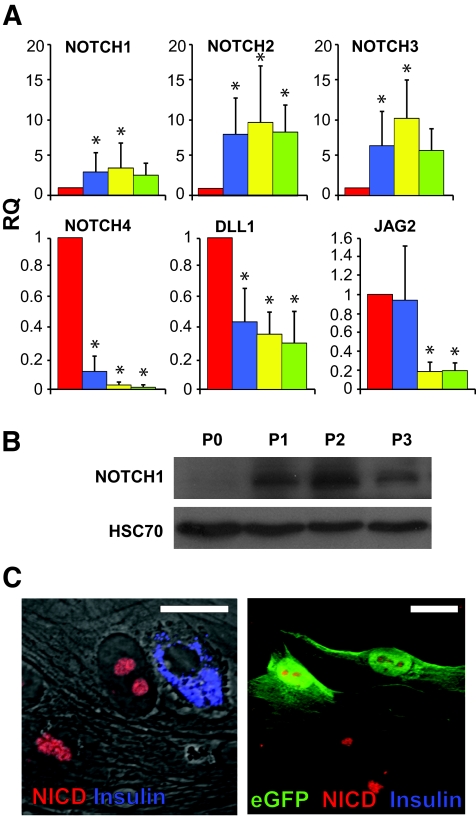
qPCR analyses revealed changes in levels of transcripts encoding the four members of the NOTCH family. NOTCH1 transcripts were upregulated on average by 3.6-fold within the first 2 weeks of culture (P = 0.02 at P2) (Fig. 2A). A similar increase was detected in the NOTCH1 120-kd transmembrane fragment (Fig. 2B), paralleling the changes in HES-1 levels (Fig. 1B). NOTCH2 and NOTCH3 were significantly upregulated on average by 9.7-fold (P = 8.8 × 10⁻⁵ at P2) and 10.1-fold (P = 1.0 × 10⁻⁴ at P2), respectively, within the first 2 weeks of culture. Overall, the activation of NOTCH1–3 paralleled that of HES-1. In contrast, NOTCH4 was drastically downregulated, on average 50-fold (P = 3.0 × 10⁻⁵ at P2) from its level in primary islets. As with HES1 upregulation, NOTCH1–3 upregulation peaked within the first 2 weeks of culture and was downregulated thereafter. Transcripts encoding presenilin-1, a component of the γ-secretase complex, and recombination signal-binding protein 1 for J-κ (RBPJK), a protein that participates in the NICD nuclear complex, were not significantly changed in the cultured cells (data not shown). In contrast, transcripts for NOTCH ligands were downregulated during the initial weeks of culture (Fig. 2A). DELTA1 transcripts were downregulated on average 3.3-fold (P = 1.4 × 10⁻⁴ at P2) within the first 2 weeks of culture. JAG1 transcripts were not significantly changed (data not shown). JAG2 transcripts were downregulated on average 5.5-fold (P = 1.9 × 10⁻⁵ at P2) within the first 2 weeks of culture. The increased activity of the NOTCH pathway was manifested by appearance of NICD in cell nuclei, as revealed by immunostaining (Fig. 2C). Similar to the pattern of HES-1 immunostaining, staining for NICD could not be detected in cells intensely stained for insulin. NICD staining was detected in all (100%) lineage-labeled, insulin-negative cells identified as originating from β-cells by eGFP expression (Fig. 2C) (based on counting >200 cells in cultures from each of three donors).
FIG. 2.
Upregulation of the NOTCH pathway in cultured human islet cells and eGFP+ cells derived from β-cells. A: qPCR analysis of RNA extracted from islet cells derived from eight donors at the indicated passage numbers. P indicates passage number and weeks in culture. RQ indicates relative quantification compared with P0. Data are means ± SD (n = 8). Asterisks indicate statistical significance, compared with P0 (P < 0.03 for NOTCH1; P < 0.04 for NOTCH2; P < 9 × 10⁻⁴ for NOTCH3; P < 0.03 for NOTCH4; P < 0.005 for DLL1; P < 0.026 for JAG2). The increase in NOTCH3 mRNA levels at P3 was marginally significant (P = 0.06). B: Immunoblotting for NOTCH1 120-kd transmembrane fragment in protein extracted from islet cells at the indicated passage number. HSC70 served as a loading control. C: Immunofluorescence analysis of islet cells (left panel) and eGFP+ cells derived from β-cells (right panel) following 10 days in culture. Bar = 20 μm. (Please see http://dx.doi.org/10.2337/db07-1323 for a high-quality digital representation of this figure.)
Changes in expression of cell cycle inhibitors.
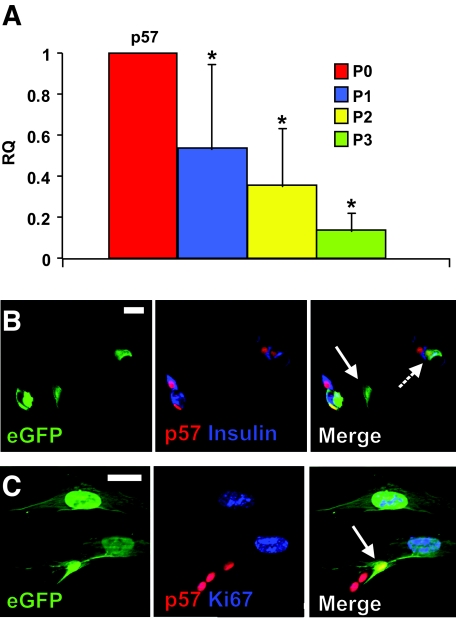
To evaluate the consequences of increased HES-1 expression in the cultured islet cells, we analyzed changes in transcripts of genes encoding cyclin kinase inhibitors, which are among the main targets of repression by HES-1 (22,23). Transcripts encoding p57, which is thought to be the main cell cycle inhibitor in human β-cells (22), were downregulated, on average, 2.9-fold (P = 0.004 at P2) within the first 2 weeks of culture (Fig. 3A). A further reduction was observed at P3, averaging 7.1-fold, compared with P0 (P = 0.002). This finding was supported by immunostaining for p57, which showed its presence in all (100%) lineage-labeled insulin-positive eGFP+ cells and its absence in all (100%) insulin-negative eGFP+ cells (based on counting >200 cells in cultures from each of three donors) (Fig. 3B). In contrast to p57, transcripts for p21 were upregulated in cells from all donors, and those for p27 varied considerably among donors (data not shown). The downregulation of p57 transcripts and protein correlated with cell entrance into the cell cycle, as manifested by Ki67 staining in p57-negative eGFP+ cells (Fig. 3C). The nuclear area of replicating cells was 2.5- to 4-fold larger than that of insulin-positive cells, as previously reported (8). The increase in cell size is likely associated with recruitment of quiescent β-cells into the cell cycle (31).
FIG. 3.
Downregulation of p57 in cultured human islet cells and eGFP+ cells derived from β-cells. A: qPCR analysis of RNA extracted from islet cells derived from eight donors at the indicated passage numbers. P indicates passage number and weeks in culture. RQ indicates relative quantification compared with P0. Data are means ± SD (n = 8). Stars indicate statistical significance, compared with P0 (P < 0.03). B and C: Immunofluorescence analysis of eGFP+ cells derived from β-cells following 10 days in culture. Solid arrow in B points to an eGFP+ cell that has lost both insulin and p57 expression; dashed arrow points to an eGFP+ β-cell that maintains both insulin and p57 expression. Arrow in C points to an eGFP+ cell that maintains p57 expression and is not labeled for Ki67. Bar = 20 μm. (Please see http://dx.doi.org/10.2337/db07-1323 for a high-quality digital representation of this figure.)
Inhibition of HES-1 expression prevents induction of β-cell replication.
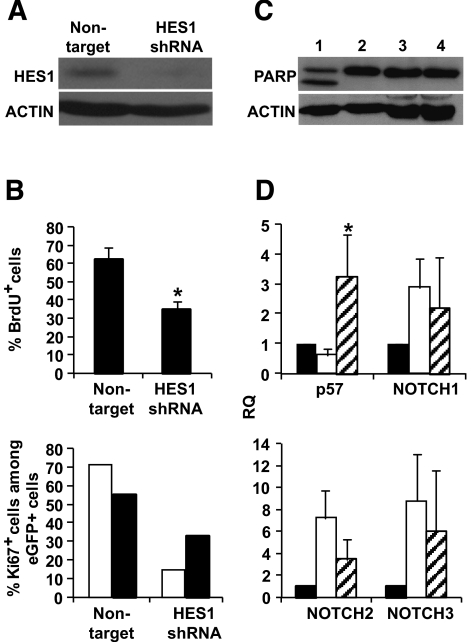
To further correlate the induction of β-cell replication with HES-1 upregulation, HES-1 induction during the initial weeks of culture was inhibited using shRNA. Following screening of four HES1 shRNA sequences for activity in 293T cells, one of four (TRCN18993) was selected as most efficient, based on reduction in HES-1 protein levels, as analyzed by immunoblotting (data not shown). Isolated human islets were dissociated, and the cells were infected with a lentivirus encoding HES1 shRNA before culture under standard conditions. Selection for drug resistance allowed elimination of uninfected cells. Cells infected with a nontarget shRNA lentivirus and selected under similar conditions served as control. As seen in Fig. 4A, cell infection with the HES1 shRNA virus resulted in up to six-times-lower HES-1 protein levels, compared with cells infected with the control virus. The lower HES-1 levels were associated with a diminished cell proliferation compared with cells infected with the control vector, as judged by staining for BrdU incorporation (Fig. 4B). In addition, staining for Ki67 in eGFP+ cells demonstrated a lower replication rate among cells derived from β-cells (Fig. 4B). The reduced replication in cells infected with the HES1 shRNA virus did not correlate with an increase in cell apoptosis, as judged by immunoblotting analysis for cleaved PARP (Fig. 4C). In addition, terminal uridine deoxynucleotidyl transferase dUTP nick-end labeling assay did not detect significant changes between cells at P2 treated with either virus and cells at P0 among insulin-expressing cells or the total cell population (averaging 1.41, 2.19, and 1.64% apoptotic cells among insulin-positive cells at P0, P2 cells treated with HES1 shRNA, and P2 cells treated with nontarget virus, respectively, based on counting 500 cells in cultures from each of three donors). The reduced proliferation of cells infected with the HES1 shRNA virus correlated with a 5.7-fold (P = 0.001) higher level of p57 transcripts, compared with those in cells infected with the control virus (Fig. 4D) (see data on cells from individual donors in online appendix Fig. 2). The levels of p57 transcripts obtained with HES1 shRNA were 3.3-fold higher (P = 0.04) compared with P0. The reduced HES-1 levels did not significantly affect the levels of NOTCH transcripts, which is consistent with the position of HES-1 downstream of NOTCH in the pathway (Fig. 4D).
FIG. 4.
Prevention of HES-1 upregulation by shRNA reduces replication of cultured human islet cells and eGFP+ cells derived from β-cells. A: Immunoblotting for HES-1 in protein extracted from islet cells following infection with HES1 shRNA TRCN18993 or nontarget virus. β-Actin served as a loading control. B: Top panel: Incidence of BrdU+ cells among cultured islet cells following infection with HES1 shRNA TRCN18993 or nontarget virus. Data are means ± SD (n = 3 donors; >1,000 cells counted in culture from each donor; P = 0.02). Bottom panel: Incidence of Ki67+ cells among eGFP+ cells from two representative donors following infection with HES1 shRNA or nontarget virus. Data are based on >1,000 cells counted in culture from each donor. □, G13; ▪, I10. C: Immunoblotting for PARP in protein extracted from islet cells following infection with nontarget (lane 3) or HES1 shRNA TRCN18993 virus (lane 4). Uninfected cells incubated with (lane 1) or without (lane 2) the apoptotic agent staurosporin served as controls. The lower band in lane 1 represents cleaved PARP. β-Actin served as a loading control. D: qPCR analysis of RNA extracted from islet cells following infection with HES1 shRNA TRCN18993 or nontarget virus. RQ indicates relative quantification compared with P0. Data are means ± SD (n = 3 donors). Only the change in p57 is significant (P = 0.001 vs. cells infected with nontarget virus, indicated by star). ▪, P0; □, nontarget; , HES1 shRNA. All the analyses were done 14 days following viral infection.
Inhibition of HES-1 expression reduces β-cell dedifferentiation.
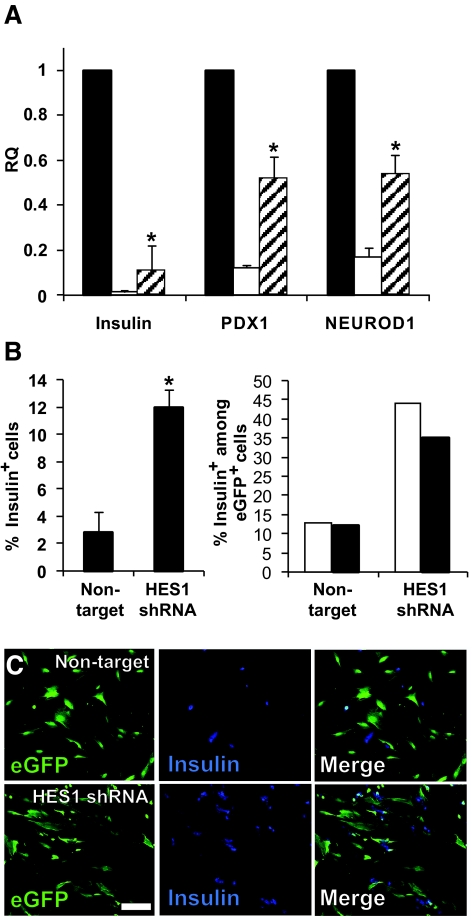
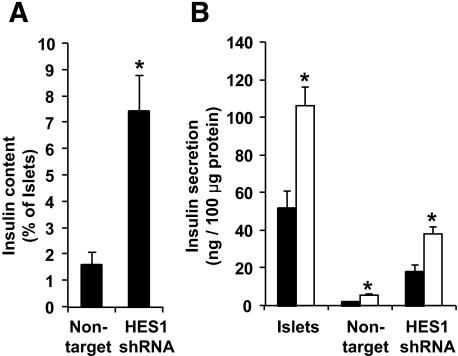
The lower HES-1 levels in cells expressing HES1 shRNA resulted in a reduced rate of cell dedifferentiation, as manifested by higher levels of transcripts encoding differentiated β-cell markers. Thus, levels of insulin transcripts were 6.6-fold higher (P = 5.5 × 10⁻⁴) compared with cells infected with the control virus (Fig. 5A). Similarly, transcript levels for the β-cell transcription factors PDX1 and NEUROD1 were 4.4-fold (P = 0.005) and 3.3-fold (P = 0.004) higher, respectively, in cells expressing HES1 shRNA (Fig. 5A). The levels of PDX1 and NEUROD1 transcripts in cells expressing HES1 shRNA were 0.52 and 0.54 of those in primary islets, respectively. In contrast, the levels of insulin transcripts in cells expressing HES1 shRNA were ninefold lower compared with those in primary islets. In agreement with the higher insulin mRNA levels, insulin immunostaining detected a fourfold (P = 0.016) higher number of insulin-positive cells in cultures expressing HES1 shRNA compared with those treated with the control virus (Fig. 5B). The fraction of insulin-positive cells among eGFP+ cells was also threefold higher in the presence of HES1 shRNA, indicating that fewer β-cells underwent dedifferentiation (Fig. 5B and C). Insulin content in cells expressing HES1 shRNA was 3.5-fold higher (P = 0.03) compared with cells treated with the control virus (Fig. 6A), although these levels were 14-fold lower compared with intact islets before trypsinization. Cells at P2 maintained the same two- to threefold increase in insulin secretion in response to glucose observed in intact islets (Fig. 6B). However, insulin secretion from cells expressing HES1 shRNA was 6.8-fold higher (P = 0.006) compared with cells treated with the control virus, in response to 16 mmol/l glucose (Fig. 6B). Nevertheless, cells expressing HES1 shRNA secreted a much higher fraction of their insulin content (15.5%), compared with intact islets (3.9%), during a 30-min assay. (Cells infected with the nontarget virus secreted 19.7% of their content.)
FIG. 5.
Prevention of HES-1 upregulation by shRNA reduces β-cell dedifferentiation. A: qPCR analysis of RNA extracted from islet cells following infection with HES1 shRNA TRCN18993 or nontarget virus. RQ indicates relative quantification compared with P0. Data are means ± SD (n = 3 donors). The changes in all three genes in cells infected with HES1 shRNA, compared with cells infected with nontarget virus, were significant (P < 0.004). ▪, P0; □, nontarget; , HES1 shRNA. B: Left: Incidence of insulin-positive cells among cultured islet cells following infection with HES1 shRNA TRCN18993 or nontarget virus. Data are means ± SD (n = 3 donors; >1,000 cells counted in culture from each donor; P = 0.016). Right: Incidence of insulin-positive cells among eGFP+ β-cells from two representative donors following infection with HES1 shRNA or nontarget virus. Data are based on >1,000 cells counted in culture from each donor. Significant differences compared with nontarget are indicated by stars. □, G13; ▪, I10. C: Immunofluorescence analysis of insulin in eGFP+ cells following infection with HES1 shRNA TRCN18993 or nontarget virus. Bar = 100 μm. All the analyses were done 14 days following viral infection. (Please see http://dx.doi.org/10.2337/db07-1323 for a high-quality digital representation of this figure.)
FIG. 6.
HES1 shRNA reduces the decrease in insulin content and glucose-stimulated insulin secretion observed during dedifferentiation of cultured islet cells. A: Insulin content in cells infected with HES1 shRNA TRCN18993 or nontarget virus compared with primary islets. Data are means ± SD (n = 3 donors). Asterisks indicate statistical significance (P = 0.03). B: Insulin secretion in response to glucose during a 30-min assay. Data are means ± SD (n = 3 individual experiments from a representative donor). Asterisk indicate statistical significance of the difference between 0 and 16 mmol/l glucose in each cell type (P < 0.04). ▪, 0 mmol/l; □, 16 mmol/l.
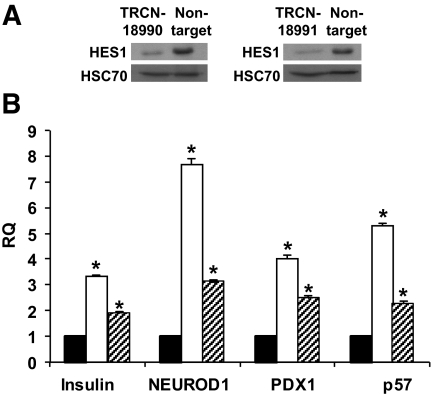
To verify that these results were due to specific inhibition of HES-1 expression, the studies were reproduced with two additional HES1 shRNAs, TRCN18990 and TRCN18991. As seen in Fig. 7A, cell infection with viruses encoding these shRNAs resulted in reduction in cellular HES-1 protein levels. The reduction in HES-1 correlated with 5.3-fold (P = 3.3 × 10⁻⁵) and 2.2-fold (P = 6.6 × 10⁻⁴) higher levels of p57 transcripts in cells expressing the two HES1 shRNAs, respectively, compared with the levels in cells infected with the nontarget virus. The levels of insulin transcripts were 3.4-fold (P = 1.3 × 10⁻⁵) and 1.9-fold (P = 2.8 × 10⁻⁴) higher, respectively. The levels of PDX1 transcripts were 4.0-fold (P = 9.2 × 10⁻⁵) and 2.5-fold (P = 1.9 × 10⁻⁴) higher, respectively, and the levels of NEUROD1 transcripts were 7.7-fold (P = 3.5 × 10⁻⁵) and 3.1-fold (P = 8 × 10⁻⁶) higher, respectively. These results are comparable with those obtained using HES1 shRNA TRCN18993, indicating that the effects on cell proliferation and differentiation were caused by specific inhibition of HES-1 expression.
FIG. 7.
Effects of HES1 shRNAs TRCN18990 and TRCN18991 on gene expression in cultured islet cells. A: Immunoblotting for HES-1 in protein extracted from islet cells 14 days following infection with HES1 shRNA TRCN18990, TRCN18991, or nontarget virus. HSC70 served as a loading control. B: qPCR analysis of RNA extracted from islet cells 14 days following infection with HES1 shRNAs or nontarget virus. RQ indicates relative quantification compared with cells infected with nontarget virus. Data are means ± SD (n = 3). Significant differences compared with nontarget are indicated by asterisks. ▪, nontarget; □, TRCN18990;
 , TRCN18991.
DISCUSSION
Our findings demonstrate that culture of dissociated adult human islet cells in serum-containing medium, which induces β-cell dedifferentiation and replication, involves activation of elements of the NOTCH pathway. Transcript levels for NOTCH1–3 and HES1 are upregulated. In contrast, transcripts for NOTCH4, and the NOTCH ligands DELTA1 and JAG2, are downregulated. These changes were initially observed in a mixed population of islet cells, which likely included contaminating duct and exocrine cells. Using virus-mediated cell lineage tracing, we then determined that these changes occurred in β-cells. The upregulation of the NOTCH pathway correlated with cell dedifferentiation, as manifested by a dramatic decrease in insulin transcripts, and by cell entrance into the cell cycle, as manifested by downregulation of p57 transcripts and an increase in Ki67 staining. The findings at the RNA level were supported by immunostaining, which demonstrated a negative correlation between the presence of HES-1 or NICD in the nucleus and insulin expression in eGFP+ cells, which marked their origin from β-cells. These in situ analyses also detected a positive correlation between p57 and insulin expression, confirming the view that β-cell replication involves dedifferentiation.
The key role of HES-1 in these events was revealed by inhibiting its upregulation with shRNA. In these cells, the decrease in p57 was prevented and cell proliferation was greatly reduced. While cell dedifferentiation was not completely prevented, it was significantly inhibited compared with cells in which HES-1 upregulation was not repressed. This was manifested by higher levels of insulin transcripts and fraction of cells immunostaining for insulin, as well as transcripts encoding β-cell transcription factors. In addition, loss of insulin content and secretion was less pronounced. These findings suggest that a partial cell dedifferentiation is independent of HES-1 activity and cell replication; however, induction of advanced dedifferentiation and cell replication requires HES-1 upregulation. This interpretation is supported by the finding that the bulk of decrease in insulin mRNA occurs during the first week, thus preceding the peak in HES-1 mRNA levels. It is therefore possible that loss of most of the insulin content is a precondition for β-cell entrance into cell cycle in vitro.
Given the fact that upregulation of the NOTCH pathway in islet cell cultures followed cell dissociation into single cells, it is unlikely that it was trigerred by a cell-associated ligand, as in the lateral inhibition model (16). Rather, it is possible that this pathway is activated in response to soluble serum components, as was demonstrated in a number of cultured cell types (32). This possibility is supported by our findings of decreased expression of NOTCH ligands in islet cell cultures concomitant with HES-1 upregulation. This is reminiscent of the low levels of NOTCH ligands in the embryonic pancreas cells expressing HES-1, which are directed for further proliferation rather than differentiation (16).
Among the four members of the NOTCH family that were analyzed, NOTCH1, NOTCH2, and NOTCH3 transcripts were upregulated, while NOTCH4 transcripts were greatly downregulated. While expression of NOTCH1 and NOTCH2 was implicated in islet development, NOTCH3 and NOTCH4 expression was documented in mesenchymal and endothelial cells (21). Downregulation of NOTCH4 may reflect the elimination of a NOTCH4+ subpopulation, which is present in the original islet cell suspension but for some reason is not maintained in continuous culture.
The wave of HES-1 upregulation peaked within the first 2 weeks of culture and was downregulated thereafter. Nevertheless, the effects of HES-1 were not reversed, as manifested by continuous replication of cells derived from dedifferentiated β-cells for up to 16 population doublings (8,15). The levels of p57 and insulin transcripts did not rebound thereafter, suggesting that their reinduction requires other signals in addition to the decrease in the inhibitory effect of HES-1. This finding suggests a transient role of HES-1 upregulation that is limited to the initial adaptation of islet cells to culture, after which cell replication may continue in the presence of the lower HES-1 levels found in nonreplicating cells.
In summary, our findings provide evidence for activation of the NOTCH pathway in adult cells and offer an in vitro model system for studying interactions within this pathway. In addition, the findings emphasize the role of components of the NOTCH pathway in the transition of quiescent β-cells into a dedifferentiated, proliferative state in vitro. Our findings demonstrate a negative correlation between replication and maintenance of differentiated function in cultured β-cells, suggesting that significant cell expansion inevitably involves dedifferentiation and will require the development of methods for cell redifferentiation following expansion. Components of the NOTCH pathway may represent molecular targets for induction of redifferentiation of the expanded cells.
Supplementary Material
Acknowledgments
Human islets were provided by the Cell Isolation and Transplantation Center at the University of Geneva School of Medicine and San Raffaele Hospital, Milan, Italy, through the European Consortium for Islet Transplantation “Islets for Research” distribution program, sponsored by the Juvenile Diabetes Research Foundation award 6-2005-1178, and by the Diabetes Cell Therapy unit, Faculty of Medicine, Lille 2 University. This work was supported by grants from the Israel Science Foundation and Juvenile Diabetes Research Foundation (to S.E.).
We thank T. Sudo for anti-HES1 antibody and Ran Elkon for assistance with statistical analyses.
This work was performed in partial fulfillment of the requirements for a PhD degree of Yael Bar.
Published ahead of print at http://diabetes.diabetesjournals.org on 3 July 2008.
The costs of publication of this article were defrayed in part by the payment of page charges. This article must therefore be hereby marked “advertisement” in accordance with 18 U.S.C Section 1734 solely to indicate this fact.
REFERENCES
- 1.Sorenson RL, Brelje TC: Adaptation of islets of Langerhans to pregnancy: beta-cell growth, enhanced insulin secretion and the role of lactogenic hormones. Horm Metab Res 29 :301 –307,1997 [DOI] [PubMed] [Google Scholar]
- 2.Butler AE, Janson J, Bonner-Weir S, Ritzel R, Rizza RA, Butler PC: β-Cell deficit and increased β-cell apoptosis in humans with type 2 diabetes. Diabetes 52 :102 –110,2003 [DOI] [PubMed] [Google Scholar]
- 3.Dor Y, Brown J, Martinez OI, Melton DA: Adult pancreatic beta-cells are formed by self-duplication rather than stem-cell differentiation. Nature 429 :41 –46,2004 [DOI] [PubMed] [Google Scholar]
- 4.Beattie GM, Itkin-Ansari P, Cirulli V, Leibowitz G, Lopez AD, Bossie S, Mally MI, Levine F, Hayek A: Sustained proliferation of PDX-1+ cells derived from human islets. Diabetes 48 :1013 –1019,1999 [DOI] [PubMed] [Google Scholar]
- 5.Beattie GM, Leibowitz G, Lopez AD, Levine F, Hayek A: Protection from cell death in cultured human fetal pancreatic cells. Cell Transplant 9 :431 –438,2000 [DOI] [PubMed] [Google Scholar]
- 6.Halvorsen TL, Beattie GM, Lopez AD, Hayek A, Levine F: Accelerated telomere shortening and senescence in human pancreatic islet cells stimulated to divide in vitro. J Endocrinol 166 :103 –109,2000 [DOI] [PubMed] [Google Scholar]
- 7.Beattie GM, Montgomery AM, Lopez AD, Hao E, Perez B, Just ML, Lakey JR, Hart ME, Hayek A: A novel approach to increase human islet cell mass while preserving β-cell function. Diabetes 51 :3435 –3439,2002 [DOI] [PubMed] [Google Scholar]
- 8.Ouziel-Yahalom L, Zalzman M, Anker-Kitai L, Knoller S, Bar Y, Glandt M, Herold K, Efrat S: Expansion and redifferentiation of adult human pancreatic islet cells. Biochem Biophys Res Commun 341 :291 –298,2006 [DOI] [PubMed] [Google Scholar]
- 9.Gershengorn MC, Hardikar AA, Wei C, Geras-Raaka E, Marcus-Samuels B, Raaka BM: Epithelial-to-mesenchymal transition generates proliferative human islet precursor cells. Science 306 :2261 –2264,2004 [DOI] [PubMed] [Google Scholar]
- 10.Lechner A, Nolan AL, Blacken RA, Habener JF: Redifferentiation of insulin-secreting cells after in vitro expansion of adult human pancreatic islet tissue. Biochem Biophys Res Commun 327 :581 –588,2005 [DOI] [PubMed] [Google Scholar]
- 11.Weinberg N, Ouziel-Yahalom L, Knoller S, Efrat S, Dor Y: Lineage tracing evidence for in vitro dedifferentiation but rare proliferation of mouse pancreatic β-cells. Diabetes 56 :1299 –1304,2007 [DOI] [PubMed] [Google Scholar]
- 12.Chase LG, Ulloa-Montoya F, Kidder BL, Verfaillie CM: Islet-derived fibroblast-like cells are not derived via epithelial-mesenchymal transition from Pdx-1 or insulin-positive cells. Diabetes 56 :3 –7,2007 [DOI] [PubMed] [Google Scholar]
- 13.Morton RA, Geras-Raaka E, Wilson LM, Raaka BM, Gershengorn MC: Endocrine precursor cells from mouse islets are not generated by epithelial-to-mesenchymal transition of mature beta cells. Mol Cell Endocrinol 270 :87 –93,2007 [DOI] [PMC free article] [PubMed] [Google Scholar]
- 14.Atouf F, Park CH, Pechhold K, Ta M, Choi Y, Lumelsky NL: No evidence for mouse pancreatic β-cell epithelial-mesenchymal transition in vitro. Diabetes 56 :699 –702,2007 [DOI] [PubMed] [Google Scholar]
- 15.Russ HA, BarY, Ravassard P, Efrat S: In vitro proliferation of cells derived from adult human β-cells revealed by cell-lineage tracing. Diabetes 57 :1575 –1583,2008 [DOI] [PubMed] [Google Scholar]
- 16.Apelqvist A, Li H, Sommer L, Beatus P, Anderson DJ, Honjo T, Hrabe de Angelis M, Lendahl U, Edlund H: Notch signalling controls pancreatic cell differentiation. Nature 400 :877 –881,1999 [DOI] [PubMed] [Google Scholar]
- 17.Hald J, Hjorth JP, German MS, Madsen OD, Serup P, Jensen J: Activated Notch1 prevents differentiation of pancreatic acinar cells and attenuate endocrine development. Dev Biol 260 :426 –437,2003 [DOI] [PubMed] [Google Scholar]
- 18.Murtaugh LC, Stanger BZ, Kwan KM, Melton DA: Notch signaling controls multiple steps of pancreatic differentiation. Proc Natl Acad Sci U S A 100 :14920 –14925,2003 [DOI] [PMC free article] [PubMed] [Google Scholar]
- 19.Greenwood AL, Li S, Jones K, Melton D: Notch signaling reveals developmental plasticity of Pax4(+) pancreatic endocrine progenitors and shunts them to a duct fate. Mech Dev 124 :97 –107,2007 [DOI] [PubMed] [Google Scholar]
- 20.Ehebauer M, Hayward P, Arias AM: Notch, a universal arbiter of cell fate decisions. Science 314 :1414 –1415,2006 [DOI] [PubMed] [Google Scholar]
- 21.Jensen J, Pedersen EE, Galante P, Hald J, Heller RS, Ishibashi M, Kageyama R, Guillemot F, Serup P, Madsen OD: Control of endodermal endocrine development by Hes-1. Nat Genet 24 :36 –44,2000 [DOI] [PubMed] [Google Scholar]
- 22.Georgia S, Soliz R, Li M, Zhang P, Bhushan A: p57 and Hes1 coordinate cell cycle exit with self-renewal of pancreatic progenitors. Dev Biol 298 :22 –31,2006 [DOI] [PubMed] [Google Scholar]
- 23.Murata K, Hattori M, Hirai N, Shinozuka Y, Hirata H, Kageyama R, Sakai T, Minato N: Hes1 directly controls cell proliferation through the transcriptional repression of p27Kip1. Mol Cell Biol 25 :4262 –4271,2005 [DOI] [PMC free article] [PubMed] [Google Scholar]
- 24.Jensen JN, Cameron E, Garay MV, Starkey TW, Gianani R, Jensen J: Recapitulation of elements of embryonic development in adult mouse pancreatic regeneration. Gastroenterology 128 :728 –741,2005 [DOI] [PubMed] [Google Scholar]
- 25.Miyamoto Y, Maitra A, Ghosh B, Zechner U, Argani P, Iacobuzio-Donahue CA, Sriuranpong V, Iso T, Meszoely IM, Wolfe MS, Hruban RH, Ball DW, Schmid RM, Leach SD: Notch mediates TGF alpha-induced changes in epithelial differentiation during pancreatic tumorigenesis. Cancer Cell 3 :565 –576,2003 [DOI] [PubMed] [Google Scholar]
- 26.Rooman I, De Medts N, Baeyens L, Lardon J, De Breuck S, Heimberg H, Bouwens L: Expression of the Notch signaling pathway and effect on exocrine cell proliferation in adult rat pancreas. Am J Pathol 169 :1206 –1214,2006 [DOI] [PMC free article] [PubMed] [Google Scholar]
- 27.Darville MI, Eizirik DL: Notch signaling: a mediator of beta-cell de-differentiation in diabetes? Biochem Biophys Res Commun 339 :1063 –1068,2006 [DOI] [PubMed] [Google Scholar]
- 28.Van Limpt VA, Chan AJ, Van Sluis PG, Caron HN, Van Noesel CJ, Versteeg R: High delta-like 1 expression in a subset of neuroblastoma cell lines corresponds to a differentiated chromaffin cell type. Int J Cancer 105 :61 –69,2003 [DOI] [PubMed] [Google Scholar]
- 29.Berkovich I, Efrat S: Inducible and reversible beta-cell autoimmunity and hyperplasia in transgenic mice expressing a conditional oncogene. Diabetes 50 :2260 –2267,2001 [DOI] [PubMed] [Google Scholar]
- 30.Schroeter EH, Kisslinger JA, Kopan R: Notch-1 signalling requires ligand-induced proteolytic release of intracellular domain. Nature 393 :304 –305,1998 [DOI] [PubMed] [Google Scholar]
- 31.Baserga R: Is cell size important? Cell Cycle 6 :814 –816,2007 [DOI] [PubMed] [Google Scholar]
- 32.Hirata H, Yoshiura S, Ohtsuka T, Bessho Y, Harada T, Yoshikawa K, Kageyama R: Oscillatory expression of the bHLH factor Hes1 regulated by a negative feedback loop. Science 298 :840 –843,2002 [DOI] [PubMed] [Google Scholar]
Associated Data
This section collects any data citations, data availability statements, or supplementary materials included in this article.


