Abstract
The N1-acetylation of spermidine and spermine by spermidine/spermine acetyltransferase (SSAT) is a crucial step in the regulation of the cellular polyamine levels in eukaryotic cells. Altered polyamine levels are associated with a variety of cancers as well as other diseases, and key enzymes in the polyamine pathway, including SSAT, are being explored as potential therapeutic drug targets. We have expressed and purified human SSAT in Escherichia coli, and characterized its kinetic and chemical mechanism. Initial velocity and inhibition studies support a random sequential mechanism for the enzyme. The bisubstrate analogue, N1-spermine-acetyl-coenzyme A, exhibited linear, competitive inhibition against both substrates with a true Ki of 6 nM. The pH activity profile was bell shaped, depending on the ionization state of two groups exhibiting apparent pKa values of 7.27 and 8.87. The three-dimensional crystal structure of SSAT with bound bisubstrate inhibitor was solved at 2.3 Å resolution. The structure of the SSAT-spermine-acetyl-coenzyme A complex suggested that Tyr140 acts as general acid and Glu92, through one or more water molecules acts as the general base during catalysis. Based on kinetic properties, pH dependence and structural information, we propose an acid/base assisted reaction catalyzed by SSAT, involving a ternary complex.
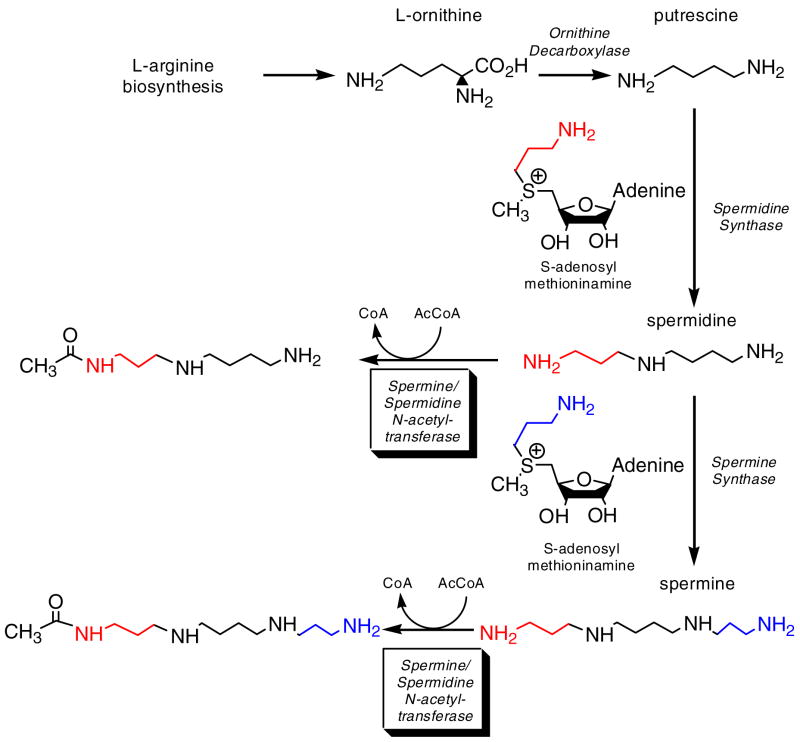
The polyamines, spermine, spermidine and their diamine precursor, putrescine, are naturally occurring polycations that are essential for the normal growth and proliferation of all cells. These ubiquitous molecules play an important role in numerous physiological functions such as cell growth and proliferation, nucleic acid and protein synthesis, cell adhesion and repair of the extracellular matrix, immunity, etc. (1–4 and references therein). The cellular concentrations of these compounds are highly regulated via biosynthesis, transport, degradation and interconversion of these molecules and also through the induction and degradation of the enzymes involved in their biosynthesis and degradation. A reduced level of polyamines has been shown to affect cell proliferation, migration, and cause defective embryo development, while over accumulation induces apoptosis and cell transformation (4). Altered levels of polyamines have been found in disease conditions such as Alzheimer’s disease (5), cystic fibrosis (6,7) and in a variety of tumor and cancer cells (8–12). The polyamine metabolic pathway in higher mammals, including humans is well understood (2, 4, 13 and references therein). The first committed and regulatory step in the polyamine biosynthetic pathway is the conversion of ornithine to putrescine by ornithine decarboxylase (Scheme I). The successive polyamines, spermidine and spermine are then synthesized by the sequential addition of aminopropyl groups to putrescine catalyzed by their respective synthases (Scheme I). Spermidine/spermine N1-acetyltransferase (SSAT), the key enzyme in the catabolism of eukaryotic polyamines, acetylates spermine and spermidine and the mono-acetylated spermidine/spermine are either degraded by N1-acetylpolyamine oxidase or exported from the cell. The SSAT level is very low under normal conditions and is rapidly induced by a variety of stimuli such as hormones and growth factors, toxic compounds, polyamines and polyamine analogs, certain drugs and pathophysiological conditions (14).
Scheme I.
Human SSAT (hSSAT) has previously been purified from cultured melanoma cells and preliminary kinetic properties have been reported (15). The three-dimensional structures of the recombinant hSSAT holoenzyme and a ternary complex have recently been reported (16, 17). In this paper we report a detailed kinetic and mechanistic characterization, including determining bisubstrate (N1-spermine-acetylCoA) inhibition patterns and the three-dimensional structure of the recombinant hSSAT with bound bisubstrate inhibitor.
MATERIALS AND METHODS
Materials
All chemicals, coenzyme A derivatives and polyamines were purchased from Sigma-Aldrich Chemical Co. Enzymes used in molecular biology were supplied by New England Biolabs. Plasmid pET-28a, E. coli strains Nova Blue and BL21(DE3) were obtained from Novagen. The hSSAT cDNA clone was obtained from Origene Inc.
Cloning, Overexpression, and Purification of hSSAT
The open reading frame of the hSSAT gene (Swissprot P21673) was amplified from the cDNA clone by standard PCR techniques using the oligonucleotides SATF (5′-ATCCCGCTCATATGGCTAAATTCGT GATCCGC-3′) and SATR (5′-ATCCCGCTAAGCTTTCACTCCTCTGTTGCCAT-3′) containing the underlined NdeI and HindIII restriction sites shown, respectively. The PCR fragment was cloned into pET-28a(+) and the recombinant hSSAT bearing a thrombin-cleavable N-terminal His6 tag was expressed in the E. coli strain BL21(DE3). For shake flask growth, 1 l of LB-medium supplemented with kanamycin (35 μg/mL) was inoculated with 10 mL of an overnight culture and incubated at 37 °C. The culture was grown to mid-log phase (A600 ~ 0.8), cooled to 20 °C, induced with 0.5 mM IPTG, and further incubated overnight at 20°C.
All purification procedures were carried out at 4 °C. The cells were collected by centrifugation at 6000 × g and resuspended in buffer A (50 mM Tris, pH 7.8 containing 150 mM NaCl) containing protease inhibitors, lysozyme (5 μg/mL), and DNase I (0.1 μg/mL) and stirred for 20 min. The cells were then lysed by sonication and cell debris removed by centrifugation at 18000 × g for 30 min. The supernatant was dialyzed against buffer A, loaded onto a Ni-NTA column pre-equilibrated with buffer A and washed with 10 column volumes of the same buffer. The bound proteins were eluted with a linear 0 to 0.3 M imidazole gradient at a flow rate of 1 mL/min. The active fractions were pooled, and concentrated to 5 mL by ultrafiltration. The His6 tag was then cleaved using thrombin (2U/mg of protein) and the solution was dialyzed overnight against buffer A containing 2 mM CaCl2 and loaded onto a Superdex S-75 column pre-equilibrated with buffer A. Pure fractions as determined by SDS-PAGE were pooled and concentrated by ultrafiltration.
Protein Estimation
Protein concentrations were estimated by the Bio-Rad protein assay method using bovine serum albumin as a standard.
Synthesis of N1-spermine-acetylCoA
Chloroacetyl-CoA was synthesized and purified as described previously (18). The N1-chloroacetylation of spermine by hSSAT was performed using 200 μM ClAcCoA, 200 μM spermine, 50 mM Tris, pH 7.5 and 2 μM hSSAT at room temperature for one hour. 1 mM CoA was added, and 200 mM Tris, pH 8.4 was used to increase the pH (to pH 8.2) of the solution that was allowed to stand at 4 °C for 10 hours. The pH was adjusted to 2 by the addition of TFA. After removing the precipitated hSSAT by centrifugation, spermine was separated away from CoA and N1-spermine-acetylCoA by HPLC using a Phenomenex Synergi Fusion C18 column (4μ, 250 × 21.2 mm) using a linear 0–40 % methanol gradient in 0.1% aqueous TFA over 110 minutes at 8 mL/min. The retention times of CoA, and N1-spermine-acetylCoA were 62 and 68 minutes, respectively. The identity of the product has been confirmed by mass spectrometry.
Measurement of Enzyme Activity
Reaction rates were measured spectrophotometrically by following the increase in absorbance at 324 nm due to the reaction between the free sulfhydryl group of CoASH, generated by the enzyme-catalyzed polyamine acylating activity, and 4,4′-dithiopyridine. The reaction was monitored continuously on a UVIKON XL spectrophotometer and enzyme activities were calculated using a molar absorption coefficient of 19,800 M−1 cm−1 (38). Assay mixtures contained 50 mM Tris, pH 7.5, 0.2 mM 4,4′-dithiopyridine, in addition to substrates or inhibitors in a volume of 1 mL. Reactions were initiated by the addition of enzyme and followed at room temperature for 1–2 min.
Initial Velocity Experiments
Initial velocity kinetic data were fitted using Sigma Plot 2000. Kinetic constants for AcCoA were determined at fixed, saturating concentrations of spermidine. Kinetic constants for polyamines were determined using fixed, saturating conditions of AcCoA. Individual substrate saturation kinetic data were fitted to the eq. 1
| (1) |
where V is the maximal velocity, A is the substrate concentration, and K is the Michaelis-Menten constant (Km). Initial velocity patterns were obtained by measuring the initial rate at five concentrations of each substrate. Equation 2 was used to fit the intersecting initial velocity pattern:
| (2) |
where A and B are the concentrations of the substrates, Ka and KB are the Michaelis-Menten constants for the substrates, and Kia is the inhibition constant for substrate A.
Bisubstrate Inhibition Patterns
Bisubstrate inhibition patterns were determined by measuring initial velocities at variable concentrations of one reactant (AcCoA or spermidine), the second reactant concentration fixed (spermidine or AcCoA), and the bisubstrate inhibitor at several concentrations. Equation 3 was used to fit the competitive inhibition data.
| (3) |
where I is the inhibitor concentration and Kis is the slope inhibition constant, respectively.
Determination of the true Ki value
In order to determine the true Ki value for of N1-spermine-acetylCoA, appKi values were determined from inhibition patterns versus AcCoA at four different concentrations of the non-varied reactant (spermidine at 27, 40, 56.6 and 100 μM). The appKi values were plotted against the concentration of spermidine and the data was fitted to equation 4.
| (4) |
where, Ki is the true inhibition constant for of N1-spermine-acetylCoA, appKi is the apparent inhibition constant, B is the concentration of the non-varied substrate (spermidine) and Kib is the dissociation constant for substrate B.
Dependence of hSSAT activity on pH
The pH dependence of the kinetic parameters exhibited by hSSAT were determined using AcCoA as the variable substrate. Activity was monitored every 0.3 pH units from pH 6.7 to pH 9.1 using the following buffer: HEPES (pH 6.7–7.9) and TAPS (pH 7.6–9.1). The resulting kinetic data were fitted to equation 1 to obtain the kinetic parameters kcat and kcat/Km. Profiles were generated by plotting the log of kcat or kcat/Km versus the pH and fitted using the equations:
| (5) |
where C is the pH-independent plateau value, K1 is the ionization constant for the acidic group, K2 is the ionization constant for the basic group, and H+ is the hydrogen ion concentration.
Solvent Kinetic Isotope Effects
The solvent kinetic isotope effects on kcat and kcat/Km were determined by measuring the initial velocities using saturating concentrations of AcCoA while varying the concentration of spermidine in either H2O or 99% D2O at pH 8.0. Solvent deuterium kinetic isotope effects were fitted to the following equation:
| (6) |
where EV/K and EV are the isotope effects on kcat/Km −1 and kcat −1, respectively, and Fi represents the fraction of isotope.
Crystallization and Structure determination
Protein utilized for crystallization was dialyzed overnight against 20 mM Tris pH 8.0 containing 1 mM DTT, 0.1 mM EDTA and concentrated to 15 mg/mL by ultrafiltration. Prior to crystallization, N1-spermine-acetylCoA was added to a concentration of 4 mM and the complex was incubated on ice for 2 hours. Crystals of hSSAT were grown by hanging drop vapour diffusion at 18°C. 2 μl of purified protein was combined with 2 μl of the reservoir (3–4 M NaCl, 200 mM K/Na tartrate, 100 mM Tris-HCl pH 7–8, 50 mM MgCl2). Large rectangular crystals grew to their maximal dimensions of (0.5 × 0.5 × 0.2 mm) over 1–3 days. Crystals were briefly soaked in 4M NaCl, 200 mM K/Na Tartrate, 100 mM Tris pH 7.75, 50 mM MgCl2 prior to vitrification in liquid nitrogen with the high salt acting as a cryoprotectant. Data were collected utilizing a Rigaku RU300 generator and R-Axis IV++ image plate, and scaled using MOSFLM (19). Phasing utilized the molecular replacement program AMORE (20) and the structure of apo hSSAT (PDBID=2F5I) (16), as a search model. Molecular models were fit to the data using the molecular graphics program COOT (21) and refined using REFMAC (22). Data and refinement statistics are listed in Table 2. The structural data have been deposited in the Protein Data Bank (PDBID=2JEV).
Table 2.
Data Collection and Refinement Statistics1
|
Data Collection
| |
| Space Group | P43 |
| Unit Cell Dimensions | a=b=46.7, c=191.8 |
| Resolution (Å) | 50-2.3 (2.42-2.3) |
| Completeness (%) | 98.5 (93.9) |
| Redundancy | 3.8 (3.3) |
| I/σ(I) | 20.2 (4.3) |
| Rmerge (%) | 4.4 (22.6) |
| Wilson B-factor (Å2) | 51.7 |
|
| |
|
Refinement
| |
| Resolution (Å) | 50-2.3 (2.36-2.3) |
| Rfactor (%) | 22.4 (27.0) |
| Unique reflections2 | 16978 (1200)/908 (59) |
| Rfree (%) | 27.5 (37.4) |
| Protein residues fit | A2-A170, B2-B170 |
| Number of atoms | |
| protein | 2784 |
| solvent/ligands | 67/130 |
| Average B-factors (Å2) | |
| protein | 44.6 |
| solvent/ligands | 39.0/68.6 |
| RMS deviations | |
| bonds (Å) | 0.011 |
| angles (°) | 1.354 |
Statistics in parentheses are for the highest resolution shell
Used in refinement and calculation of Rfactor/Rfree
RESULTS AND DISCUSSION
Purification and properties of hSSAT
PCR amplification of the hSSAT gene yielded a single fragment of the expected length. Cloning and overexpression of the PCR product resulted in an expressed protein product with an apparent molecular mass, by SDS-PAGE, in agreement with the mass of 20,023 deduced from the amino acid sequence. DNA sequencing of the cloned fragment confirmed the absence of any mutations introduced during PCR amplification. The two-step purification procedure yielded greater than 98% pure protein.
Substrate specificity of hSSAT
Initial velocities were determined spectrophotometrically, at pH 7.5, at 8–12 different concentrations of each substrate. The data were plotted by nonlinear, least square curve fitting using Sigmaplot (version 2000). Kinetic constants for acetyl-CoA, determined at a saturating concentration of spermidine, are presented in Table 1. The steady-state kinetic parameters for various polyamines at saturating concentrations of acetyl-CoA are also summarized in Table 1.
Table 1.
Kinetic parameters for acetyl coenzyme A and polyamines
| Substrate | Km (μM) | kcat (min−1) | V/K (M−1min−1) |
|---|---|---|---|
| Acetyl CoAa | 3.8 ± 0.2 | 590 ± 9 | 155 × 106 |
| Spermineb | 5.7 ± 0.4 | 155 ± 3 | 27 × 106 |
| Spermidineb | 22 ± 1 | 584 ± 9 | 26 × 106 |
| 1,3-diaminopropaneb | 107 ± 4 | 60 ± 1 | 56 × 104 |
| Diethylenetriamineb | 194 ± 8 | 94 ± 2 | 48 × 104 |
| Ethylenediamineb | 196 ± 30 | 13 ± 1 | 66 × 103 |
| Putrescine | na | ||
| Cadaverene | na |
Measured at fixed saturating concentration of spermidine.
Measured at fixed saturating concentrations of acetyl-CoA.
na No detectable activity.
From the determined steady state kinetic parameters, particularly the relative V/K values, acetyl-CoA was the strongly preferred acyl donor (Table 1) while other coenzyme A derivatives were either extremely poor substrates or did not demonstrate any activity (data not shown). The hSSAT exhibits somewhat broad specificity with respect to polyamines. Amongst physiologically relevant substrates, spermidine and spermine were good substrates for hSSAT while their diamine precursor putrescine was not acetylated by hSSAT. The substrate specificity, as evaluated by the V/K values, was the same for both spermine and spermidine. However, both Km and kcat values were four-fold higher for spermidine compared to spermine. Among di- and polyamine analogs tested, diethylenetriamine (DET) and ethylenediamine (EDA) exhibited significant activity (Table 1). It has previously been reported that acetylation by SSAT occurs on a primary amino group that is linked by a three carbon unit and that all substrates have the structure R-NH-(CH2)3-NH2. The acetylation pattern observed here generally follows the above rule. However, the acetylation of diethylenetriamine and ethylenediamine, but not putrescine or cadaverine (diamino butane and diamino pentane, respectively) by hSSAT suggests that diamines separated by two methylenes, but not longer alkyl groups, can be acetylated, albeit poorly.
Kinetic mechanism
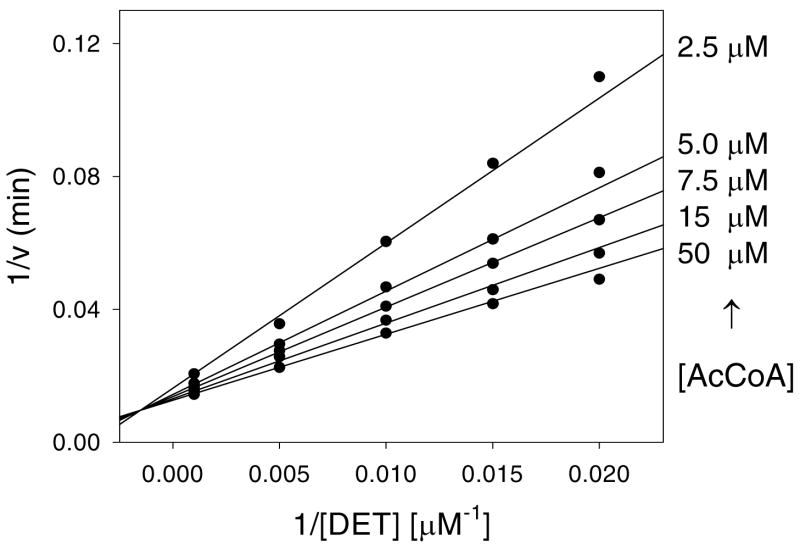
The initial velocity pattern was determined using DET and acetyl-CoA at five different concentrations of each substrate. The resultant double reciprocal plot was intersecting (Figure 1). The intersecting initial velocity plot obtained with DET and acetyl-CoA suggests a sequential kinetic mechanism, where both substrates must be bound to the enzyme for catalysis to occur. The sequential kinetic mechanism appears to be used by all SSAT’s studied to date (23, 24).
Figure 1. Initial velocity pattern.
The symbols are experimentally determined values, while the lines are fits of the data to Equation 2.
Bisubstrate inhibitors represent a potentially powerful group of compounds that have been synthesized and tested against a number of enzymes that catalyze sequential bi-reactant reactions and the detailed theory for predicting the expected patterns of inhibition against the two substrates for various bi-reactant kinetic mechanisms has recently been reported (18, and references therein). Bisubstrate inhibitors have been extensively used in kinetic and structural studies of the Gcn5-related N-acetyltransferase (GNAT) superfamily, to which the SSAT’s belong (25–29).
N1-spermine-acetyl-CoA exhibited linear, competitive inhibition versus both acetyl-CoA (Figure 2A) and spermidine (data not shown). These data are compatible with a random mechanism, where either of the substrates can bind to the free enzymw. Kinetic analyses of Bacillus subtilis (23) and rat liver (24) SSAT’s have previously been reported. The rat liver SSAT was reported to follow an ordered sequential mechanism, where polyamine binds first followed by acetyl-CoA (24) while the B. subtilis enzyme was reported to use a random mechanism (23). It is interesting to note that rat liver SSAT (24) and hSSAT share 97% sequence identity, yet apparently differ in their kinetic mechanism.
Figure 2. Bisubstrate inhibition of hSSAT.
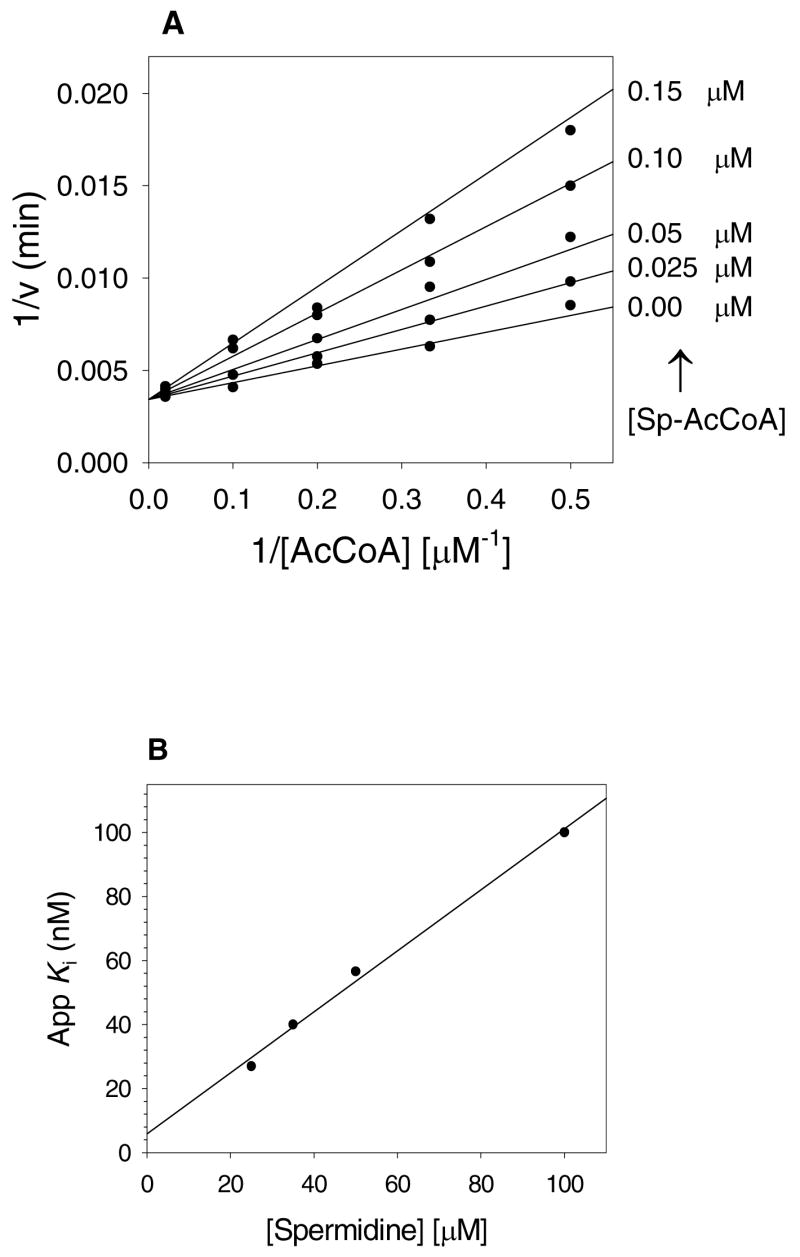
A, inhibition pattern of spermine-AcCoA versus AcCoA at a fixed 50 μM spermidine concentration. B, Linear dependence of appKi values at various concentrations of spermidine. Symbols are experimentally determined Ki values of spermine-AcCoA versus AcCoA at different fixed spermidine concentrations while the line is the fit of the data to Equation 4.
When the apparent Ki value versus acetyl-CoA of the N1-spermine-acetyl-CoA was determined at several concentrations of spermidine, the apparent Ki value decreased as the [spermidine] decreased, as expected for an inhibitor that binds to both substrate-binding sites (Figure 2B). These data allowed the determination of true Ki value for the binding of the bisubstrate to the free enzyme by extrapolation to [spermidine] = 0, yielding a value of Ki = 6 ± 1 nM.
Studies of solvent kinetic isotope effects can be a useful tool in the determination of rate-limiting chemical steps and the kinetic mechanism, especially to distinguish between steady-state random and rapid equilibrium random mechanisms. In a rapid equilibrium random kinetic mechanism, the rates of substrate binding and product dissociation are very fast relative to the catalytic step, and equivalent isotope effects must be observed on V and V/K. This is not a requirement for the steady-state random mechanism. Solvent kinetic isotope effects were determined at pH 8.0, in both H2O and 99% D2O, a region where small changes in pH(D) did not have any effect on the kinetic parameters (see below). Reactions were performed at fixed, saturating concentrations of acetyl-CoA, and at varying polyamine concentrations. Two different polyamines, spermidine and DET, exhibiting relatively low and high Km values, respectively, were used. The solvent kinetic isotope effects on V were 1.15 ± 0.01 and 1.59 ± 0.02 using spermidine and DET, respectively, (Figure 3). The solvent kinetic isotope effects on V/K were 1.12 ± 0.03 and 1.91 ± 0.06 for spermidine and DET, respectively, (Figure 3).
Figure 3. Solvent kinetic isotope effect for hSSAT.
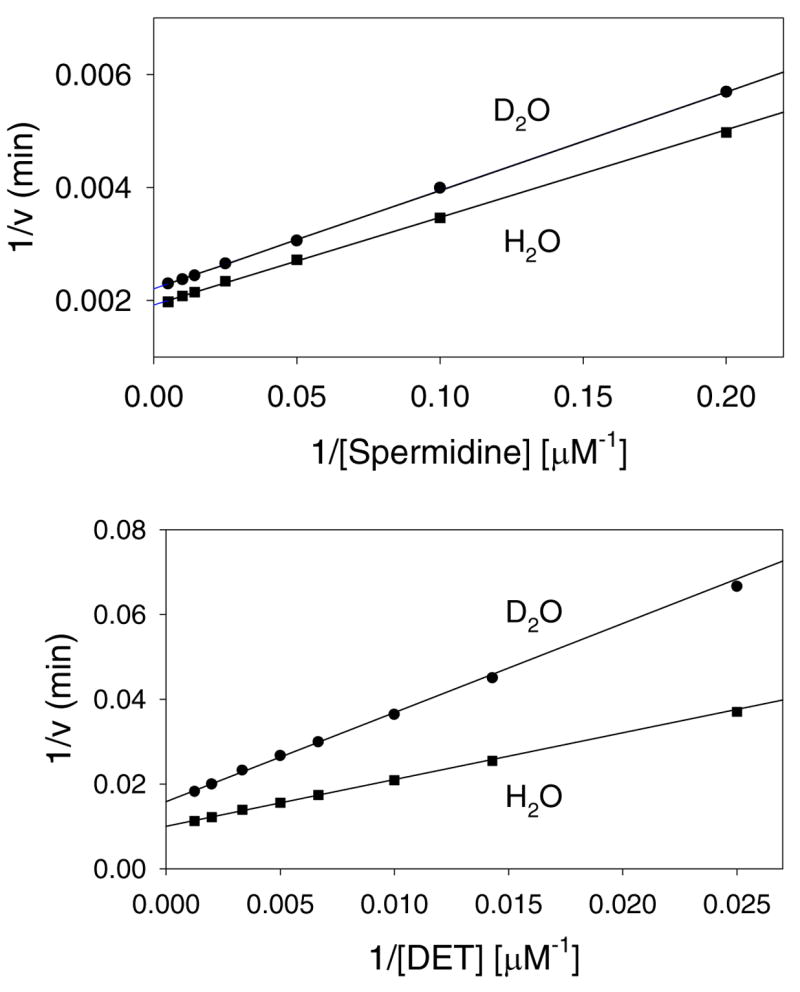
The symbols are experimentally determined values in H2O (■) or 99% D2O (●); the lines are fits of the data to Equation 6. Spermidine and DET were variable substrates at a fixed, saturating concentration of AcCoA.
The very low value of the solvent kinetic isotope effects on V/K determined with spermidine suggests that spermidine is kinetically “sticky”, and that no slow, solvent isotopically-sensitive step occurs between spermidine binding and the first irreversible step, generally assumed to be the release of first product. The larger value of solvent kinetic isotope effect on V/K obtained using DET likely reflects the lower commitment factor of this poorer substrate. The larger values of the solvent kinetic isotope effects on V, which includes steps from the precatalytic ternary complex through final product release, may reflect the effects of solvent isotopic substitution on the chemical step, the release of products, or the conformational changes that allow this to occur. The magnitude of the solvent kinetic isotope effects and inequality of D2OV and D2OV/K argues against a rapid equilibrium random mechanism where the chemical step is rate-limiting.
Structure of hSSAT with bound N1-spermine-acetylCoA
In order to confirm that the bisubstrate interacted in a kinetically relevant fashion with hSSAT, its 3-dimensional structure bound to hSSAT was pursued. Initial crystallization searches to produce a hSSAT-bisubstrate complex utilized commercial screens and vapor diffusion under oil. These screens yielded a single crystal form (P62, a=b=66.9 Å, c=78.6 Å) similar to that reported by Bewley, et. al (PDBID, 2B3V/2B58) (17). Examination of electron density maps indicated a symmetric dimer with CoA bound in each active site, which presumably copurifies with the enzyme, and no density for the bisubstrate (data not shown). Presumably this crystal form is not compatible with the structural conformation required to bind the bisubstrate. Narrower crystallization trials were initiated around those used previously to crystallize hSSAT in other forms (PDBID, 2F5I/2BEI) (16). New crystals were obtained under high salt conditions similar to those used to crystallize hSSAT in an APO form. Examination of electron density maps clearly indicates electron density for the CoA and polyamine functions of the bisubstrate (Fig 4). The C-axis of this crystal form with bound bisubstrate increases by 10 Å over the APO structure (191.8 vs. 180.5Å) while the a/b axes remain unchanged. A crystal contact in the direction of the c-axis positions two crystallographically related CoA binding sites in close proximity and the c-axis must therefore expand to accommodate the adenosine functionality of the bound bisubstrate inhibitor. Interestingly, there are only minor structural rearrangements upon binding the bisubstrate analogue compared to the apo enzyme form (RMSD of 0.43 Å, over 333 common Cαs). The largest movements were limited to two regions: 1) the pyrophosphate binding loop (β4/α3), specifically the sidechain of Arg101 which moves to optimize its van der Walls contacts with the panothenic acid moiety of CoA, and 2) the α1/α2 loop which provides contacts with both CoA and C8-N12 portion of spermine. Specifically, the sidechain of Tyr27 changes rotamers to maximize its interactions with the β-alanine moiety of CoA and the α1/α2 loop changes conformation to maximize the electrostatic interactions of Glu32 and Glu28 with N12 of spermine.
Figure 4. Structure of hSSAT with bisubstrate analog.
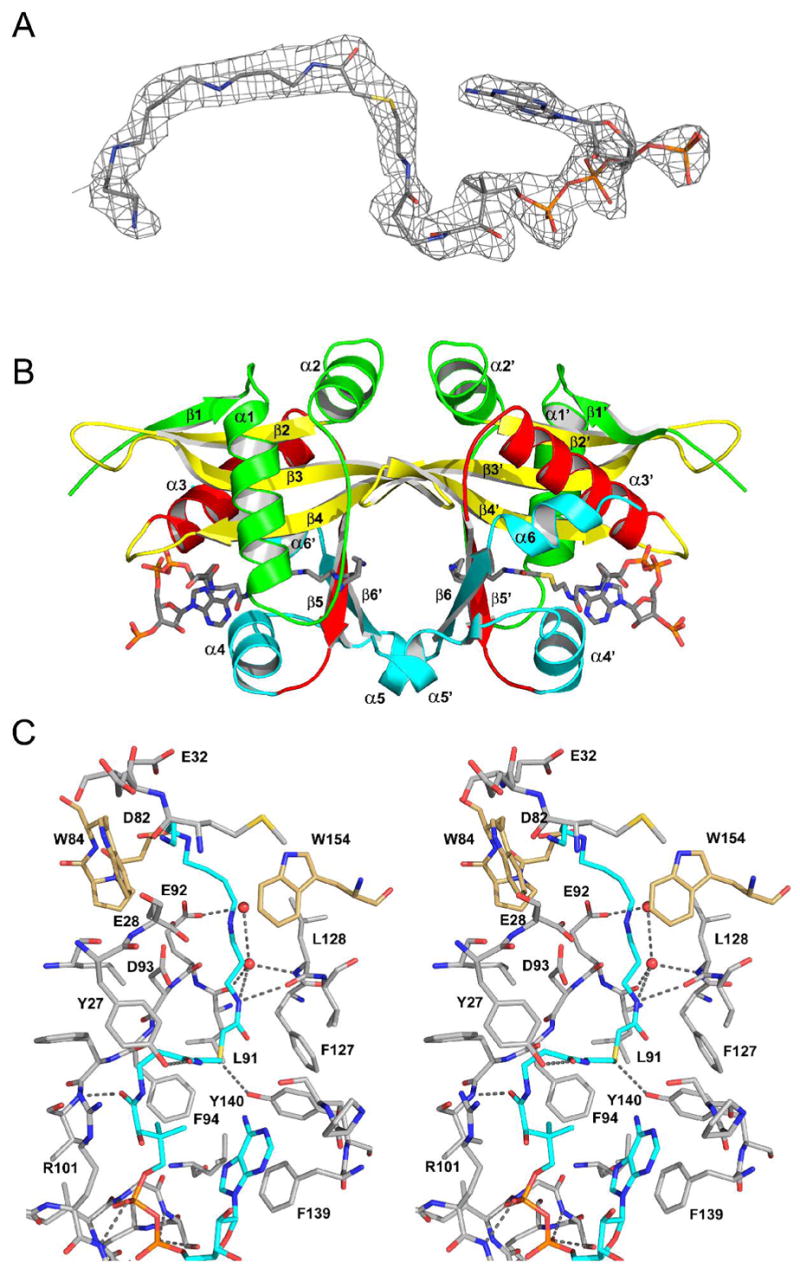
A, Final 2Fo−Fc electron density for the bisubstrate analog contoured at 1σ. B, Ribbon diagram of the hSSAT dimer colored according to the color scheme for conserved GNATs secondary structure in Vetting et. al (30) (β1, α1, α2 = green; β2, β3, β4 = yellow; α3, β5 = red; α4, β5, (α5), β6, (α7) = cyan). The bisubstrate analog, is displayed as sticks, colored by atom type. C, Stereo diagram depicting residues within 5Å of the bisubstrate analog colored by atom type. Residues from the opposing subunit are colored with tan carbons whilst the bisubstrate is colored with cyan carbons. Potential hydrogen bonds displayed with grey dotted lines.
There may be some limitations to the interpretation of the structure of the bisubstrate-complex in this crystal form, which the authors consider a conformationally restricted APO structure interacting with the bisubstrate. There is some indication that the occupancy of the bisubstrate is < 1.0. The average B-factor for the bisubstrate is 20–30 Å2 larger than the surrounding protein atoms, and there is residual electron density for the sidechain of Tyr27 in its ‘APO’ rotamer. In addition, α4 remains in its ‘APO’ position, instead of moving closer to and interacting fully with the pantothenoate portion of CoA, as has been demonstrated in an hSSAT-AcCoA complex (PDBID-2B3V) (17), and in accordance with the position of α4 in numerous other GNAT structures (30). Instead, the adenosine moiety, which normally interacts with surface residues, is wedged between α4 and the pantothenate, with the adenine stacking face - to - face against Phe139. However, the structure determined here provides interesting structural details. First, the structure demonstrates that the bisubstrate analog can occupy both the CoA and the polyamine binding site, as suggested by the competitive inhibition pattern of the bisubstrate against both CoA and polyamine substrates. Secondly, the bisubstrate structure can be compared to the structure of hSSAT with the inhibitor N1, N11-bis(ethyl)norspermine (BE-3-3-3, PDBID=2B4B) (17), shedding more light on the polyamine binding site and potential residues involved in the acid/base chemistry. The polyamine functionality of the bisubstrate (Figure 4c) and BE-3-3-3 both interact through van der Waals contacts with L128 and the sidechains of W154* and W84* (starred residues are from the opposing monomer of the dimer.) Differences are observed in the loop from which W84* originates as it is in an alternate conformation in the BE-3-3-3 complex. The C9-N11-ethyl moieties of BE-3-3-3 are positioned differently than the corresponding terminal atoms of the bisubstrate such that BE-3-3-3 interacts with the edge instead of the face of sidechain W84* (Supplementary figure S1). There are five electronegative sidechains that line the pocket (E28, E32, D82*, E92, D93) and are adjacent to either N4, N9 or N12 of spermine. Interestingly none interact directly, nor through any water molecules visualized at this resolution, similar to the mode of interaction of hSSAT observed with BE-3-3-3. This suggests that polyamines may interact, or are attracted to, the active site by long range electrostatics. However, they are not restrained by hydrogen bonding to such acidic residues and are instead free to move within the active site cavity to optimize van der Waals interactions.
BE-3-3-3 appears not to penetrate the active site as deeply as would be suggested possible by the hSSAT bisubstrate complex, with the N1-ethyl moiety of BE-3-3-3 overlaying with the C2-C3 carbons of spermine and the N1 moiety of BE-3-3-3 positioned close to the N4 of the spermine moiety. In the bisubstrate complex, the N1 of spermine is hydrogen bonded to the carbonyl oxygen of Leu128 of strand β5, similar to the interaction observed in many other GNAT family members and, therefore, its position is unlikely to be disrupted due to the bisubstrate linkage (Figure 4C). In the hSSAT – AcCoA complex (17), the thioester carbonyl is phydrogen bonded to the backbone amide of Phe94 on β4. This hydrogen bond is broken in the bisubstrate complex, with the carbonyl group now interacting with the side chain hydroxyl of Tyr140. It is not clear if this interaction is a model for a product complex or is a strained interaction due to the covalent bond between CoA and N1-acetylspermine of the bisubstrate.
To examine which groups observed in the active site may participate in the acid and/or base catalysis of the reaction, the pH dependence of the reaction was determined. The kcat pH profile of the acetyl transfer reaction by hSSAT was bell-shaped, with unitary limiting slopes (+1, −1) at the pH extremes (Figure 5), suggesting the involvement of two groups whose ionization is critical for catalytic activity. The pH dependence of kcat suggests that the deprotonation of a single group exhibiting a pK value of 8.87 ± 0.05 and the protonation of a single group exhibiting a pK value of 7.27 ± 0.04 causes a loss of catalytic activity (Figure 5). A possible role for the group exhibiting the pK value of 8.87 is to function as a general acid by donating a proton to the sulfur of the coenzyme A during the collapse of the tetrahedral intermediate. Various hSSAT structures, including the bisubstrate complex presented here suggest that the side chain phenolic OH of Tyr140 is in position to protonate the sulfhydryl of CoA (17). In addition, the substitution of Tyr140 with a phenylalanine reduced activity to <5% (17). The group that exhibits a pK value of 7.27 is most likely an enzyme group that acts as a general base to promote catalysis via abstraction of a proton from the amino group of the polyamine that is being acetylated. Bewley, et. al. (17) proposed that Glu28 might act as the general base, however, its mutation to a glutamine only reduced activity by 55% with a three-fold increase in the Km value of spermidine (31). One would expect a significantly larger decrease in the catalytic activity if Glu28 functioned in this chemical role, and in the bisubstrate complex, Glu28 is not well positioned to accept protons from the amine of substrate. Instead, the bisubstrate structure suggests Glu92, through one or more waters is the terminal proton acceptor and responsible for acidic pK value of 7.27 observed. A water molecule, positioned in the splay between β4 and β5, and hydrogen bonded to the backbone carbonyl of Glu92 and the amide nitrogen of Leu128 is a conserved feature of GNAT ternary complexes solved to date, and is stereochemically well positioned to accept the proton from the substrate and pass it on to an adjoining water or directly to Glu92.
Figure 5. pH activity profile of hSSAT.
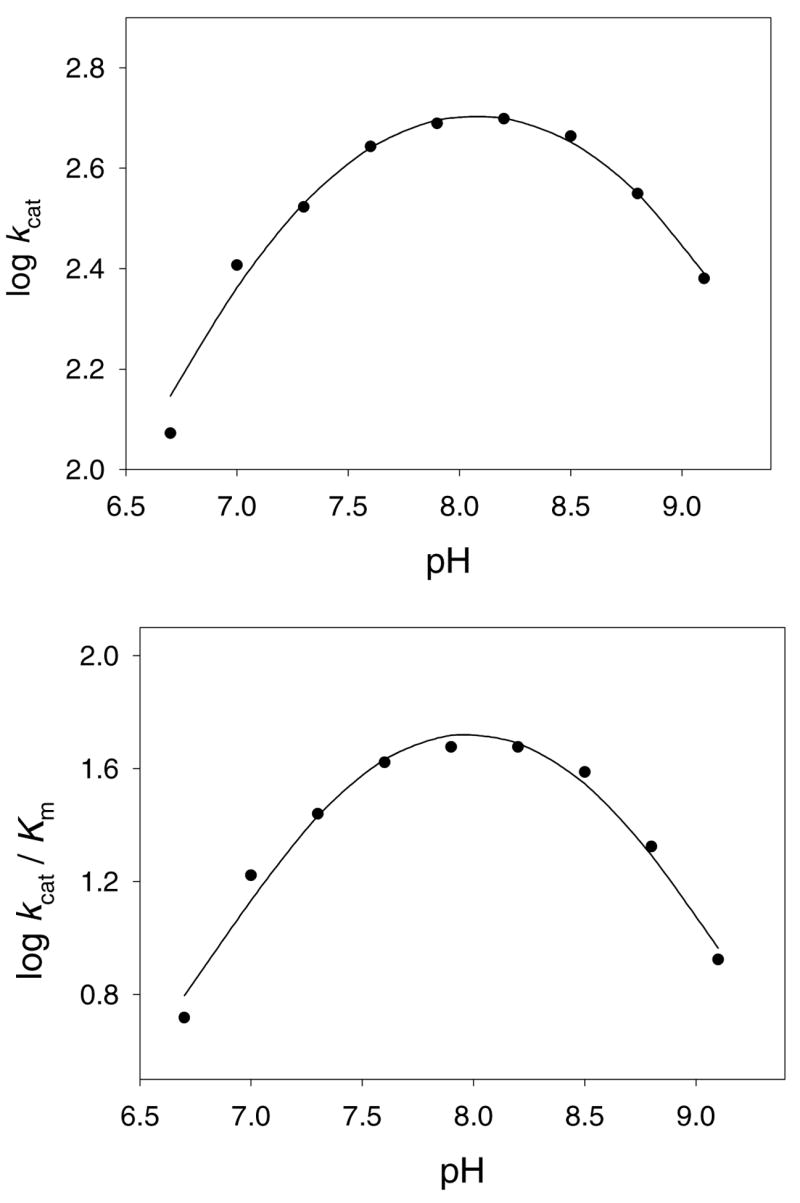
The symbols are experimentally determined values, while the smooth line is a fit of the data to Equation 5.
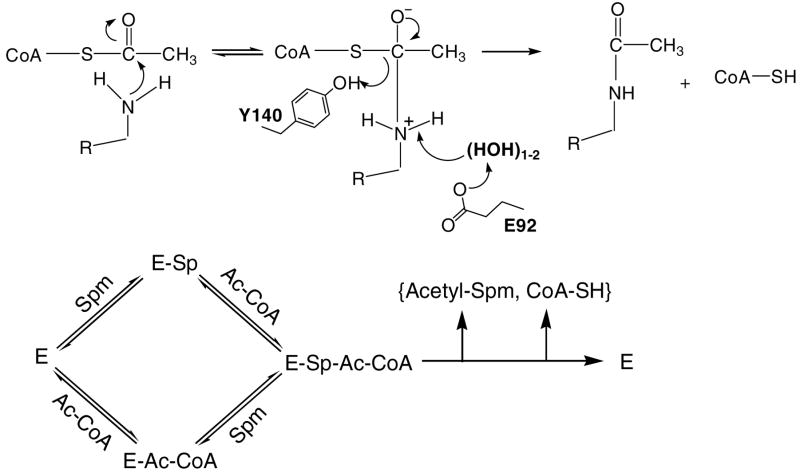
We therefore propose a model for the reaction catalyzed by hSSAT that includes this acid/base assistance (Figure 6). Either of the substrates can bind to the free enzyme and once the ternary complex is formed, nucleophilic attack on the carbonyl of the thioester generates the zwitterionic, tetrahedral intermediate. Based on our pH studies, we invoke the participation of a general acid (Tyr140) to assist in protonating the sulfur of the coenzyme A and a general base (Glu92) to deprotonate either the positively charged N1-amine of the substrate or the zwitterionic intermediate. Similar mechanisms involving catalysis by promoting the appropriate decomposition of a similar tetrahedral intermediate have been proposed for several GNATs (32–36). The chemical steps portrayed in Figure 6 are not likely to be rate determining based on the magnitude of the solvent kinetic isotope effects. The purified and crystallized “apo” enzyme contains bound CoA, suggesting that CoA copurifies with the enzyme, and is thus bound tightly. Thus, CoA dissociation is likely to be the rate-limiting step, as observed for other N-acetyltransferases (32, 37).
Figure 6.
Proposed chemical and kinetic mechanism for acetyl transfer activity by hSSAT
Supplementary Material
Three figures showing (Figure S1) the superposition of the hSSAT bisubstrate analog complex and hSSAT BE-3-3-3 complex (PDBID=2B4B), (Figure S2) Structures of the bisubstrate inhibitor, BE-3-3-3 and other polyamines used in the study and (Figure S3) the mass spectrum of the synthesized bisubstrate analogue. This material is available free of charge via the Internet at http://pubs.acs.org.
Abbreviations used
- IPTG
isopropyl thio-β-D-galactosidase
- DTT
dithiothreitol
- LB
Luria broth
- EDA
ethylenediamine
- DET
diethyltriamine
Footnotes
This work was supported by NIH Grants A160899 (to J.S.B.), T32 AI07501 (to M.W.V.) and T32 GM07288 (to M.Y.)
Structural data have been deposited in the Protein Data Bank (File name: PDB2JEV)
References
- 1.Casero RA, Jr, Celano P, Ervin SJ, Applegren NB, Wiest L, Pegg AE. Isolation and characterization of a cDNA clone that codes for human spermidine/spermine N1-acetyltransferase. J Biol Chem. 1991;266:810–814. [PubMed] [Google Scholar]
- 2.Pegg AE. Recent advances in the biochemistry of polyamines in eukaryotes. Biochem J. 1986;234:249–262. doi: 10.1042/bj2340249. [DOI] [PMC free article] [PubMed] [Google Scholar]
- 3.Pegg AE. Polyamine metabolism and its importance in neoplastic growth and a target for chemotherapy. Cancer Res. 1998;48:759–774. [PubMed] [Google Scholar]
- 4.Moinard C, Cynober L, de Bandt J. Polyamines: metabolism and implications in human diseases, Clin. Nutr. 2005;24:184–197. doi: 10.1016/j.clnu.2004.11.001. [DOI] [PubMed] [Google Scholar]
- 5.Morrison LD, Kish SJ. Brain polyamine levels are altered in Alzheimer’s disease. Neurosci Lett. 1995;197:5–8. doi: 10.1016/0304-3940(95)11881-v. [DOI] [PubMed] [Google Scholar]
- 6.Russell DH, Rosenblum MG, Beckerman RC, Durie BG, Taussig LM, Barnett DR. Altered polyamine metabolism in cystic fibrosis. Pediatr Res. 1979;13:1137–1140. doi: 10.1203/00006450-197910000-00011. [DOI] [PubMed] [Google Scholar]
- 7.Rosenblum MG, Durie BG, Beckerman RC, Taussig LM, Russell DH. Cystic fibrosis: decreased conjugation and excretion of [14C]spermidine. Science. 1978;200:1496–1497. doi: 10.1126/science.663632. [DOI] [PubMed] [Google Scholar]
- 8.Russell DH. Increased polyamine concentrations in the urine of human cancer patients. Nat New Biol. 1971;233:144–145. doi: 10.1038/newbio233144a0. [DOI] [PubMed] [Google Scholar]
- 9.Russell DH. Effects of methotrexate and cytosine arabinoside on polyamine metabolism in a mouse L1210 leukemia. Cancer Res. 1972;32:2459–2462. [PubMed] [Google Scholar]
- 10.Janne J, Poso H, Raina A. Polyamines in rapid growth and cancer. Biochim Biophys Acta. 1978;473:241–293. doi: 10.1016/0304-419x(78)90015-x. [DOI] [PubMed] [Google Scholar]
- 11.Casero RA, Jr, Ervin SJ, Celano P, Baylin SB, Bergeron RJ. Differential response to treatment with the bis(ethyl)polyamine analogues between human small cell lung carcinoma and undifferentiated large cell lung carcinoma in culture. Cancer Res. 1989;49:639–643. [PubMed] [Google Scholar]
- 12.Bernacki RJ, Bergeron RJ, Porter CW. Antitumor activity of N, N′-bis(ethyl) spermine homologues against human MALME-3 melanoma xenografts. Cancer Res. 1992;52:2424–2430. [PubMed] [Google Scholar]
- 13.Seiler N. Catabolism of polyamines. Amino Acids. 2004;26:217–233. doi: 10.1007/s00726-004-0070-z. [DOI] [PubMed] [Google Scholar]
- 14.Casero RA, Jr, Pegg AE. Spermidine/spermine N1-acetyltransferase-the turning point in polyamine metabolism. FASEB J. 1993;7:653–61. [PubMed] [Google Scholar]
- 15.Libby PR, Ganis B, Bergeron RJ, Porter CW. Characterization of human spermidine/spermine N1-acetyltransferase purified from cultured melanoma cells. Arch Biochem Bioph. 1991;284:238–244. doi: 10.1016/0003-9861(91)90291-p. [DOI] [PubMed] [Google Scholar]
- 16.Zhu YQ, Zhu DY, Yin L, Zhang Y, Vonrhein C, Wang DC. Crystal structure of human spermidine/spermine N1-acetyltransferase (hSSAT): the first structure of a new sequence family of transferase homologous superfamily. Proteins. 2006;63:1127–1131. doi: 10.1002/prot.20965. [DOI] [PubMed] [Google Scholar]
- 17.Bewley MC, Graziano V, Jiang J, Matz E, Studier FW, Pegg AE, Coleman CS, Flanagan JM. Structures of wild-type and mutant human spermidine/spermine N1-acetyltransferase, a potential therapeutic drug target. Proc Natl Acad Sci U S A. 2006;103:2063–2068. doi: 10.1073/pnas.0511008103. [DOI] [PMC free article] [PubMed] [Google Scholar]
- 18.Yu M, Magalhães ML, Cook PF, Blanchard JS. Bisubstrate Inhibition: Theory and Application to N-acetyltransferases. Biochemistry. 2006;45:14788–14794. doi: 10.1021/bi061621t. [DOI] [PubMed] [Google Scholar]
- 19.Leslie AG. The integration of macromolecular diffraction data. Acta Crystallogr D Biol Crystallogr. 2006;62:48–57. doi: 10.1107/S0907444905039107. [DOI] [PubMed] [Google Scholar]
- 20.Navaza J. An automated package for molecular replacement. Acta Cryst. 1994;A50:157–163. [Google Scholar]
- 21.Emsley P, Cowtan K. Coot: model-building tools for molecular graphics. Acta Crystallogr D Biol Crystallogr. 2004;60:2126–2132. doi: 10.1107/S0907444904019158. [DOI] [PubMed] [Google Scholar]
- 22.Murshudov GN, Vagin AA, Dodson EJ. Refinement of macromolecular structures by the maximum-likelihood method. Acta Crystallogr D Biol Crystallogr. 1997;53:240–255. doi: 10.1107/S0907444996012255. [DOI] [PubMed] [Google Scholar]
- 23.Woolridge DP, Martinez JD, Stringer DE, Gerner EW. Characterization of a novel spermidine/spermine acetyltransferase, BltD, from Bacillus subtilis. Biochem J. 1999;340:753–758. [PMC free article] [PubMed] [Google Scholar]
- 24.Della Ragione F, Pegg AE. Studies of the specificity and kinetics of rat liver spermidine/spermine N1-acetyltransferase. Biochem J. 1983;213:701–706. doi: 10.1042/bj2130701. [DOI] [PMC free article] [PubMed] [Google Scholar]
- 25.Williams JW, Northrop DB. Synthesis of a tight-binding, multisubstrate analog inhibitor of gentamicin acetyltransferase I. J Antibiot (Tokyo) 1979;32:1147–1154. doi: 10.7164/antibiotics.32.1147. [DOI] [PubMed] [Google Scholar]
- 26.Gao F, Yan X, Baettig OM, Berghuis AM, Auclair K. Regio- and Chemoselective 6′-N-derivatization of Aminoglycosides: Bisubstrate Inhibitors as Probes to Study Aminoglycoside 6′-N-Acetyltransferases. Angew Chem Int Ed Engl. 2005;44:6859–6862. doi: 10.1002/anie.200501399. [DOI] [PubMed] [Google Scholar]
- 27.Khalil EM, Cole PA. A Potent Inhibitor of the Melatonin Rhythm Enzyme. J Am Chem Soc. 1998;120:6195–6196. [Google Scholar]
- 28.Hickman AB, Namboodiri MAA, Klein DC, Dyda F. The Structural Basis of Ordered Substrate Binding by Serotonin N-Acetyltransferse: Enzyme Complex at 1.8 A Resolution with a Bisubstrate Analog. Cell. 1999;97:361–369. doi: 10.1016/s0092-8674(00)80745-x. [DOI] [PubMed] [Google Scholar]
- 29.Poux AN, Cebrat M, Kim CM, Cole PA, Marmorstein R. Structure of the GCN5 Histone Acetyltransferase Bound to a Bisubstrate Inhibitor. Proc Nat’l Acad Sci USA. 2002;99:14065–14070. doi: 10.1073/pnas.222373899. [DOI] [PMC free article] [PubMed] [Google Scholar]
- 30.Vetting MW, de Carvalho LPS, Yu M, Hegde SS, Magnet S, Roderick SL, Blanchard JS. Structure and functions of the GNAT superfamily of acetyltransferases. Arch Biochem Biophys. 2005;433:212–226. doi: 10.1016/j.abb.2004.09.003. [DOI] [PubMed] [Google Scholar]
- 31.Coleman CS, Huang H, Pegg AE. Role of the carboxyl terminal MATEE sequence of spermidine/spermine N1-acetyltransferase in the activity and stabilization by the polyamine analog N1, N12-bis(ethyl)spermine. Biochemistry. 1995;34:13423–13430. doi: 10.1021/bi00041a020. [DOI] [PubMed] [Google Scholar]
- 32.Magnet S, Lambert T, Courvalin P, Blanchard JS. Kinetic and mutagenic characterization of the chromosomally encoded Salmonella enterica AAC(6′)-Iy aminoglycoside N-acetyltransferase. Biochemistry. 2001;40:3700–3709. doi: 10.1021/bi002736e. [DOI] [PubMed] [Google Scholar]
- 33.Vetting MW, Hegde SS, Javid-Majd F, Blanchard JS, Roderick SL. Aminoglycoside 2′-N-acetyltransferase from Mycobacterium tuberculosis in complex with coenzyme A and aminoglycoside substrates. Nat Struct Biol. 2002;9:653–658. doi: 10.1038/nsb830. [DOI] [PubMed] [Google Scholar]
- 34.Magalhaes ML, Blanchard JS. The kinetic mechanism of AAC3-IV aminoglycoside acetyltransferase from Escherichia coli. Biochemistry. 2005;44:16275–16283. doi: 10.1021/bi051777d. [DOI] [PMC free article] [PubMed] [Google Scholar]
- 35.Hegde SS, Blanchard JS. Kinetic and mechanistic characterization of recombinant Lactobacillus viridescens FemX (UDP-N-acetylmuramoyl pentapeptide-lysine N6-alanyltransferase) J Biol Chem. 2003;278:22861–22867. doi: 10.1074/jbc.M301565200. [DOI] [PubMed] [Google Scholar]
- 36.Hickman AB, Klein DC, Dyda F. Melatonin biosynthesis: the structure of serotonin N-acetyltransferase at 2.5 A resolution suggests a catalytic mechanism. Mol Cell. 1999;3:23–32. doi: 10.1016/s1097-2765(00)80171-9. [DOI] [PubMed] [Google Scholar]
- 37.Vetting MW, Magnet S, Nieves E, Roderick SL, Blanchard JS. A bacterial acetyltransferase capable of regioselective N-acetylation of antibiotics and histones. Chem Biol. 2004;11:565–573. doi: 10.1016/j.chembiol.2004.03.017. [DOI] [PubMed] [Google Scholar]
- 38.Grassetti DR, Murray JF., Jr Determination of Sulfhydryl Groups with 2,2′-or 4,4′-dithiopyridine. Arch Biochem Biophys. 1967;119:41–49. doi: 10.1016/0003-9861(67)90426-2. [DOI] [PubMed] [Google Scholar]
Associated Data
This section collects any data citations, data availability statements, or supplementary materials included in this article.
Supplementary Materials
Three figures showing (Figure S1) the superposition of the hSSAT bisubstrate analog complex and hSSAT BE-3-3-3 complex (PDBID=2B4B), (Figure S2) Structures of the bisubstrate inhibitor, BE-3-3-3 and other polyamines used in the study and (Figure S3) the mass spectrum of the synthesized bisubstrate analogue. This material is available free of charge via the Internet at http://pubs.acs.org.


