

Abstract
Human apolipoprotein A-I (apoA-I) is the principle apolipoprotein of high-density lipoproteins that are critically involved in reverse cholesterol transport. The intrinsically flexibility of apoA-I has hindered studies of the structural and functional details of the protein. Our strategy is to study peptide models representing different regions of apoA-I. Our previous report on [1-44]apoA-I demonstrated that this N-terminal region is unstructured and folds into ~ 60% α-helix with a moderate lipid binding affinity. We now present details of the conformation and lipid interaction of a C-terminal 46 residue peptide, [198-243]apoA-I, encompassing putative helix repeats 10, 9 and the second half of repeat 8 from the C-terminus of apoA-I. Far ultraviolet circular dichroism spectra show that [198-243] apoA-I is also unfolded in aqueous solution. However, self-association induces ~ 50% α-helix in the peptide. The self-associated peptide exists mainly as a tetramer, as determined by native electrophoresis, cross-linking with glutaraldehyde and unfolding data from circular dichroism (CD) and differential scanning calorimetry (DSC). In the presence of a number of lipid mimicking detergents, above their CMC, ~ 60% α-helix was induced in the peptide. In contrast, SDS, an anionic lipid mimicking detergent, induced helical folding in the peptide at a concentration of ~ 0.003% (~ 100 μM), ~ 70 fold below its typical CMC (0.17–0.23% or 6–8 mM). Both monomeric and tetrameric peptide can solublize dimyristoyl phosphatidyl choline (DMPC) liposomes and fold into ~ 60% α-helix. Fractionation by density gradient ultracentrifugation and visualization by negative staining electromicroscopy, demonstrated that the peptide binds to DMPC with high affinity to form at least two sizes of relatively homogenous discoidal HDL-like particles depending on the initial lipid:peptide ratio. The characteristics (lipid:peptide w/w, diameter and density) of both complexes are similar to those of plasma A-I/DMPC formed under similar conditions: small discoidal complexes (~ 3:1 w/w, ~ 110Å and ~ 1.10g/cm3) formed at initial 1:1 w/w ratio and larger discoidal complexes ( ~ 4.6:1 w/w, ~ 165 Å and ~ 1.085g/cm3) formed at initial 4:1 w/w ratio. The cross-linking of the peptide on the two sizes of disks is consistent with the calculated peptide numbers per particle, which result in sufficient helix to surround the lipid bilayer twice. Thus, our data provide direct evidence that this C-terminal region of apoA-I is responsible for the self-association of apoA-I, and this C-terminal peptide model can mimic the interaction with phospholipid of plasma apoA-I to form two sizes of homogenous discoidal complexes and thus may be responsible for apoA-I function in the formation and maintenance of HDL subspecies in plasma.
The plasma concentration of high-density lipoprotein (HDL) is an inverse marker of potential cardiovascular disease. The well-documented anti-atherogenic function of HDL is related to its critical role in reverse cholesterol transport, such as mediation of cholesterol efflux from macrophage cells and inhibition of foam cell formation. Apolipoprotein A-I (apoA-I), an exchangeable apolipoprotein with 243 amino acids, is the major protein component of HDL. The intrinsic flexibility of apoA-I allows its structure to adopt different conformations in different lipid environments. At least three distinct conformations of apoA-I, a lipid free mono-molecular or self-associated form, a less lipidated form of apoA-I as a component of nascent discoidal HDL and a lipid rich form of apoA-I as a component of mature spherical HDL, have been identified and are involved in the reverse cholesterol transport pathway.
Although plasma apoA-I probably exists in vivo predominantly in lipid bound forms, understanding the structural and conformational changes between the lipid free and different lipid bound states is essential to understanding apoA-I metabolism. Many different biophysical approaches have been utilized to investigate the structural conformation of apoA-I in lipid free and different lipid bound states [1, 2].
A large number of apoA-I natural and constructed mutants have been reported and studied by us and others, as reviewed by Sorci-Thomas et al [3]. Many of the mutants have resulted in functional implications. ApoA-I mutants associated with hereditary amyloidosis are mainly localized around N-terminus of apoA-I within residues 26-90, while mutants associated with low plasma HDL are predominantly localized in the central domain within residues 143–166. Three domains have been proposed for mature human apoA-I: the N-terminal 1–99, central domain 99–142 (or 99–186) and the C-terminal domain 143–243 (or 186–243). The region of the “central domain” is not well defined, partially due to the independent function of repeats 6 and 7 (residues 143–186)[4]. It is generally accepted that the N-terminal is important to stabilize the lipid free apoA-I conformation [5]; the central domain (probably helix 5) is important for apoA-I to accommodate different amounts of phospholipids and thus to form different sizes of nascent discoidal HDL [6]; the region of helix repeats 6 and 7 is required for LACT activation [3]; and the extreme C-terminal domain (specifically helices 9 and 10) possesses the highest lipid binding affinity and thus may initiate the lipid binding of apoA-I[7-10].
ApoA-I conformation is mainly composed of amphipathic α-helices that are thought to bind lipid [11–14] and are formed by a 22-amino acid tandem repeat that can be further sub-classified into two 11-residue repeats, A and B [15], in the exon 4 encoded region of the protein. The sequence of apoA-I contains various combinations of these A/B repeats[15]. The structure of apoA-I (and other apolipoproteins) seems to be that of discrete folded repeats that function in a concerted fashion. A continuous helix repeat assignment describes 10 tandemly repeated helices punctuated mainly by prolines. However, although this continuous helical model is the most widely used one, assignment of the precise secondary structural distribution throughout the apoA-I sequence is far from agreement by different approaches [11, 15–22]
Thus, studies of peptides [15, 23–25] that model different regions of apoA-I can provide important information on the roles of specific residues and segments, and their interactions in the structure and stability of the parent apolipoprotein. Analysis of the consensus sequences of the A and B repeat derived from the sequences of multiple exchangeable apolipoproteins [7], together with studies of 44-residue consensus sequence peptides, showed ~ 90% and ~ 50% α-helical contents for peptides with ABAB [26] and ABBA [27] sequence ordering respectively. Thus, repeat order and inter-helical interaction between the 22-mer repeats play a role in stabilizing the folding of the 22 residue segments. A 44-residue helix hairpin unit may represent a fundamental cooperative unit in apoA-I as has been suggested for apoC-1[28]. This is also supported by our previous studies on terminal truncation mutants of apoA-I [29].
We are systematically characterizing the solution conformation and lipid interactions of a series of ~44-residue peptides that represent the different arrangements of the A and B repeat motifs found in apoA-I. These include overlapping 44-residues peptides from the central domain ([99-142]apoA-I, [121-164]apoA-I [25], and [143-186]apoA-I). In addition, we have previously reported the unique properties of the N-terminal ([1-44]apoA-I)[21]. Here we report the conformational characterization and studies of the phospholipid interactions of a peptide that represents the extreme C-terminal of apoA-I ([198-243]apoA-I). The sequence of this peptide encompasses the second half of putative helix 8, helix 9 and helix 10 and represents a unique BABB repeat motif. Interestingly, the recent crystal structure of apoA-I shows the first half of helix 8 to be unstructured, and the second half of helix 8 (starting from residue 197), helix 9 and helix 10 forms a helix hairpin structure that is an independent domain [22].
MATERIALS AND METHODS
Peptide Synthesis
[198-243]apoA-I, acylated at the N-terminus and amidated at the C-terminus, was synthesized by Quality Controlled Biochemicals, Inc (Hopkinton, MA) at purities of >95%. Purity of the peptide was further verified by mass spectroscopy. The experimentally determined molecular weight was 5244, consistent with the calculated molecular weight from the amino acid sequence of 5240.
Chemicals
All regular chemical reagents were purchased from Sigma. BOG (n-Octyl-β-D-glucopyranoside C14H28O6, MW 292.37, 99%, non-ionic detergent) was purchased from Dojindo Molecular technologies, Inc (Gaithersburg, MD). SDS (sodium dodecyl sulfate, C12H25NaSO4, MW288.4, Ultra pure 10% (w/v) in solution, anion-ionic detergent) was from Invitrogen. DMPC (dimyristoyl phosphatidyl choline C14:0, FW677.9) was from Sigma. DPC (dodecylphosphocholine, C12:0, mass 351.47, alkyl phosphocholine, zwitterionic detergent) and DHPC (diheptanoyl phosphatidylcholine, C6:0, C20H40NO8P, mass 453.51, zwitterionic detergent) were both from Avanti Polar Lipids, Inc. TFE (2, 2, 2-trifluoroethanol, C2H3F3O, 99.9%, α-helix inducer) was purchased from Aldrich Chemical Company (Milwaukee, WI, now Sigma-Aldrich). Glutaraldehyde (grade I 70%) was from Sigma-Aldrich (St. Louis, MO). DPPC: Dipalmitoyl-1-14 C, mass: 734, 0.05mCi/ml in toluene:ethanol 1:1. 110 miliCi/milimolar, purchased from New England Nuclear (now PerkinElmer Life and Analytical Sciences, Inc. Boston, MA).
Circular Dichroism (CD) Spectroscopy
Far-UV CD spectra were recorded using an AVIV 62 DS spectropolarimeter, as described in detail previously [21]. Briefly, the wavelength CD spectra were recorded from 250 nm to 190 or 185 nm and averaged over at least three consecutive scans. Melting curves were monitored at 222 nm (the negative CD band of an α-helix), with a 1.00°C step size. Data was normalized to peptide concentration and expressed as molar ellipticity. Protein α-helical content was determined with 3% accuracy from the molar residue ellipticity at 222 nm [30].
Cross-linking peptide(s) and plasma apoA-I with glutaraldehyde
Glutaraldehyde is a wide range peptide cross-linker that forms covalent bonds with any two free –NH2 group within a distance of ~ 12 Å in solution [31]. Similar to other cross-linkers, the cross-linking efficiency is dependent on the concentrations of both glutaraldehyde and peptide. To determine the optimal cross-linking condition for each sample, glutaraldehyde was diluted at 0.0001%, 0.001%, 0.01%, and 0.1%. Peptide was used at various concentrations from 0.5 mg/mL to 2mg/mL. The reaction was carried out at room temperature for 2 hours. Excess glycine was added to stop the reaction for 3 minutes at room temperature. 10–20% Tricine gels were used to separate the proteins.
Differential scanning calorimetry (DSC) data collection and analysis
Excess heat capacity Cp(T) of [198-243]apoA-I was measured using a VP-DSC microcalorimeter (MicroCal). The required sample volume was ~ 600 μL. The concentrations of the peptide were from 0.5 mg/mL to 2 mg/mL in 10 mM phosphate buffer at pH 7.4. Samples and/or buffer were heated and cooled at 30 K/hr scan rate. Buffer baselines were recorded multiple times until the system reached a stable state. Cp (T) data were recorded, buffer baselines were subtracted and the data were normalized to monomer peptide concentration. Three fitting models provided by ORIGIN7.0 software were used to analyze the unfolding process of the peptide. ΔHcal (calorimetry enthalpy) was determined directly from the DSC data using the monomer concentration. ΔHv (Vant Hoff enthalpy) was calculated from the equations for the models. The ΔHv/ΔHcal ratio for each possible process was predicted: (1) ΔHv/ΔHcal=1, two-state (M↔U); (2) ΔHv/ΔHcal=x≥2, non-two-state no dissociation (Ox↔I↔Ux), (3) ΔHv/ΔHcal = ~ 2*x*x/(x+1), non-two- state with dissociation (Ox↔ multiple states ↔xU)(where “M” is monomer in native conformation, “U” is the unfolded state of the peptide, “O” is oliogomer of the peptide, “I” is an intermediate state between folding state and unfolding state, “x” is the number of peptides in the oliogomer). Both the ratio of ΔHv/ΔHcal and the shape of the fitting curve were used to monitor the quality of a specific fitting.
Preparation of reconstituted discoidal HDL like particles
Freshly dissolved peptide in 10mM phosphate buffer at pH 7.4 was used in all the experiments. Peptide-DMPC complexes were prepared by spontaneous association of the peptide with a turbid suspension of DMPC liposomes at 24 °C in phosphate buffer in a waterbath for 24 hours. To quantitate the lipid, a small amount of 14 C-DPPC (DPPC: DMPC ~1:13000 molar) was mixed with DMPC in CHCl3, dried under nitrogen and further dried within a desiccator overnight before the preparation of peptide-DMPC complexes. A wide range of initial DMPC:[198-243]apoA-I ratios w/w from 1:1 to 10:1 were studied. After the solution became clear, it was used for CD experiments, density gradient fractionation and/or EM visualization.
Density gradient ultracentrifugation
The density of the samples and the blank was adjusted to ~1.2 g/ml using solid KBr, and the samples were spun at 50K rpm, 15° C, for 48 hours. After spinning, 25 aliquots of 200 μl each were pipetted from the surface of the solution. For each fraction, density was determined by refractive index, peptide was determined by modified Lowry assay and lipid was determined by 14 C-DPPC scintillation counting, as described in detail previously [21]. For each initial lipid:peptide w/w ratio sample, the actual ratio of each fraction containing complexes was calculated from the measured lipid and peptide concentrations.
Electron Microscopy
[198-243]apoA-I/DMPC complexes, simple mixtures and peak fractions after density gradient separation, were visualized by electron microscopy using the negative staining technique [32]. Samples were observed on a CM12 electron microscope (Philips Electron Optics, Eindhoven, the Netherlands). Representative fields were photographed with an exposure time of 1.00 second, at 45K magnification.
Calculation of discoidal complex compositions
The number of DMPC per disc was estimated using the diameter of the discoidal complex from EM visualization, as described in detail previously [21]. We assume a helix diameter of 10Å and the surface area/DMPC of 65Å2 [33]. The molar ratio of lipid:peptide for each fraction was determined from the lipid/peptide mass distribution in the density gradient.
RESULTS
Conformational Characterization of [198-243]apoA-I in Solution
Figure 1 shows the far UV CD spectra of [198-243]apoA-I over a 100 fold concentration range of 0.005–0.5 mg/mL. At the lowest concentration (~ 5 μg/mL), a typical random coil spectrum with a minimum at 200 nm indicates that [198-243]apoA-I is unstructured in solution. The spectrum changes to that typical of α-helix with minima at 208 nm and 222 nm as peptide concentration increases, suggesting that self-association of [198-243]apoA-I induces α-helical structure. The insert to the figure shows the α-helix content as a function of peptide concentration. At 5 μg/mL, both the ~16% helical content and the overall unstructured nature of the spectrum suggest that [198-243]apoA-I is probably monomeric. Self-association of [198-243]apoA-I starts at 0.01 mg/mL, and the α-helical content in the peptide reaches equilibrium at ~ 0.1 mg/mL with the maximum helical content of ~ 50%.
FIGURE 1.

A. Far-UV CD spectra (θ222(λ))of [198-243]apoA-I: (□) 0.005 mg/mL, (○) 0.01 mg/mL, (△) 0.025 mg/mL, (▽) 0.05 mg/mL, (◇) 0.1 mg/mL, (+) 0.25 mg/mL, and (×) 0.5 mg/mL. The samples were in 0.01M phosphate at pH 7.4 and 25 °C. The insert figure shows the α-helical content of the peptide based on θ222, as a function of peptide concentration.
The self-association of [198-243]apoA-I was confirmed by native PhastGel electrophoresis. In contrast to the band at ~ 5 kDa (figure 2A) on SDS PAGE, which corresponds to the molecular weight of the peptide (5244 Da), a single band at ~ 20 kDa (figure 2B) was observed on native gels, suggesting that the peptide was self-associated, probably into tetramer. The self-association of the peptide was investigated further by cross-linking with glutaraldehyde (figure 2C). At a peptide concentration of 1 mg/mL and the lowest cross-linker concentration (lane 5), a clear distribution of bands corresponding to the molecular mass of monomer, dimer and trimer, together with two closely space bands corresponding to tetramer and possibly pentamer, was observed. The two bands around ~ 21 kDa in lane 5, were confirmed to be tetramer and pentamer of the peptide by MALDI-TOF mass spectrometry (data not shown). At the same peptide concentration, tetramer and maybe pentamer became predominant and lower species (monomer, dimer and trimer) became less pronounced, as the cross-linker concentration increased (lanes 6 and 7). Similar characteristics were observed for the peptide at higher concentration (lanes 3 and 4), except that larger oligomer species appeared at a molecular range of ~ 50 kDa (lanes 3 and 4). These higher species probably result from the non-specific cross-linking between the predominant peptide aggregates (i.e. tetramer and/or pentamer). However, the small oligomer species were still observed, even in the presence of excess cross-linker (lanes 4 and 7). This could result from either low cross-linker efficiency or from the existence of an equilibrium between multiple self-associated states of the peptide in solution.
FIGURE 2.
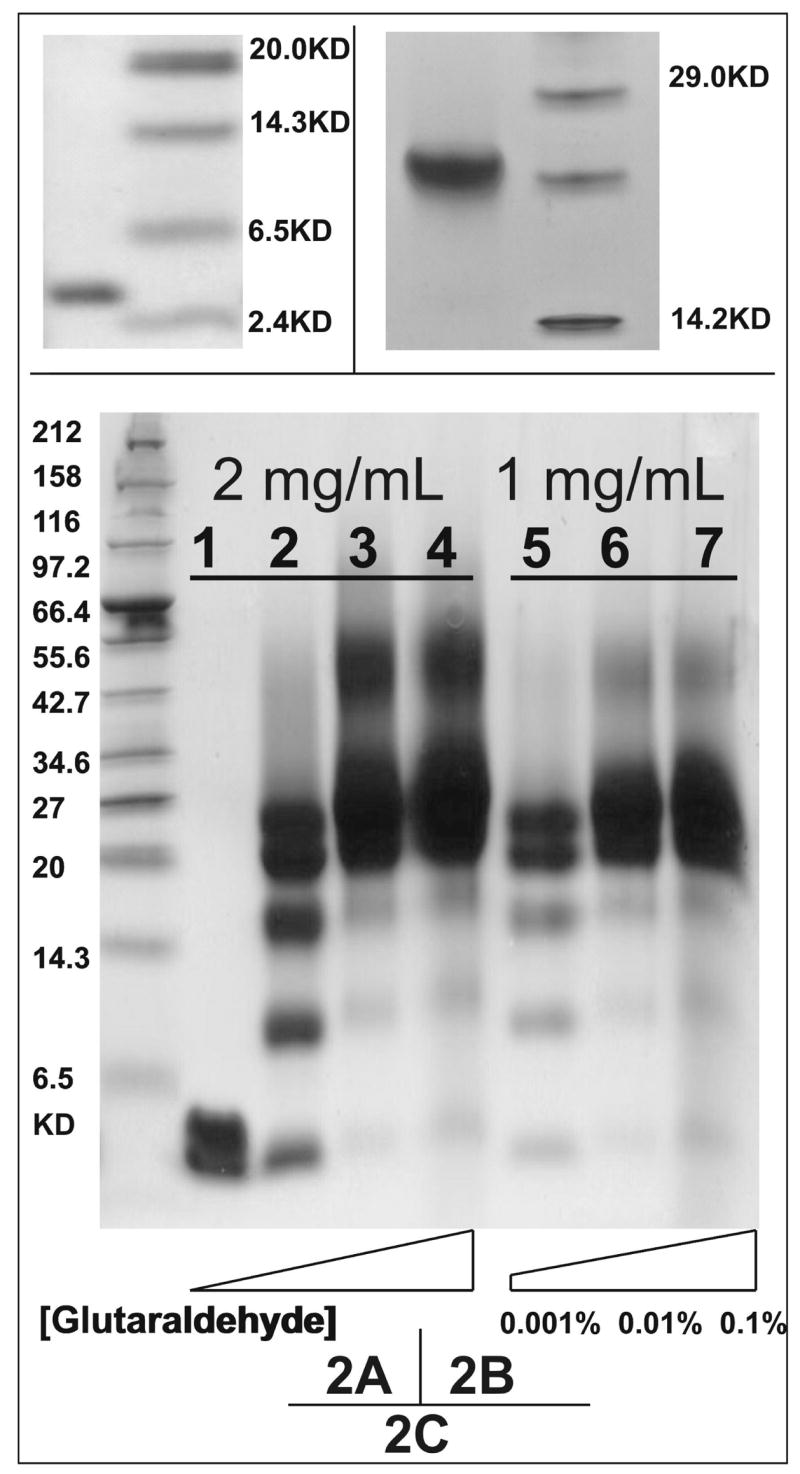
Electrophoresis studies on [198-243]apoA-I in solution. A. 1 mg/mL [198-243]apoA-I in solution, separated on SDS PAGE. B. 1 mg/mL [198-243]apoA-I in solution, separated on native 4–15% Phast Gel. C. Glutaraldehyde cross-linked peptides in solution, separated on 10–20% Tricine gradient gel. The concentrations of glutaraldehyde were: (lane1) 0, (lane 2/5) 0.001%, (lane 3/6) 0.01% and (lane 4/7) 0.1%. Peptide concentrations were 2 mg/mL from lane 1 to lane 4 and 1 mg/mL from lane 5 to lane 7.
Figure 3A shows the thermal unfolding of [198-243]apoA-I at five concentrations from 0.025 mg/mL to 0.5 mg/mL. At each peptide concentration, both thermal unfolding measurements from 0 °C to 95 °C and immediate reverse scans from 95 °C to 0 °C are shown by the same symbol. At low concentration, 0.025 mg/mL and 0.05 mg/mL specifically, the reverse scans were slightly separated from the heating curves, with the heating curve below and the cooling curve above. However, three successive heating and cooling scans of the same sample at 0.025 mg/mL, from 0 °C ↔ 50 °C, 0 °C ↔ 60°C and 0 °C ↔ 80 °C, completely overlapped (data not shown). This suggests that the slight helix loss observed in the reverse scan at 0.025 mg/mL from 95 °C to 0 °C is probably due to the permanent denaturation of a small amount of [198-243]apoA-I at high temperature. Peptide concentration determination confirmed the peptide loss from being heated at high temperature. Thus, the thermal unfolding of the peptide at all measured concentrations is reversible.
FIGURE 3.
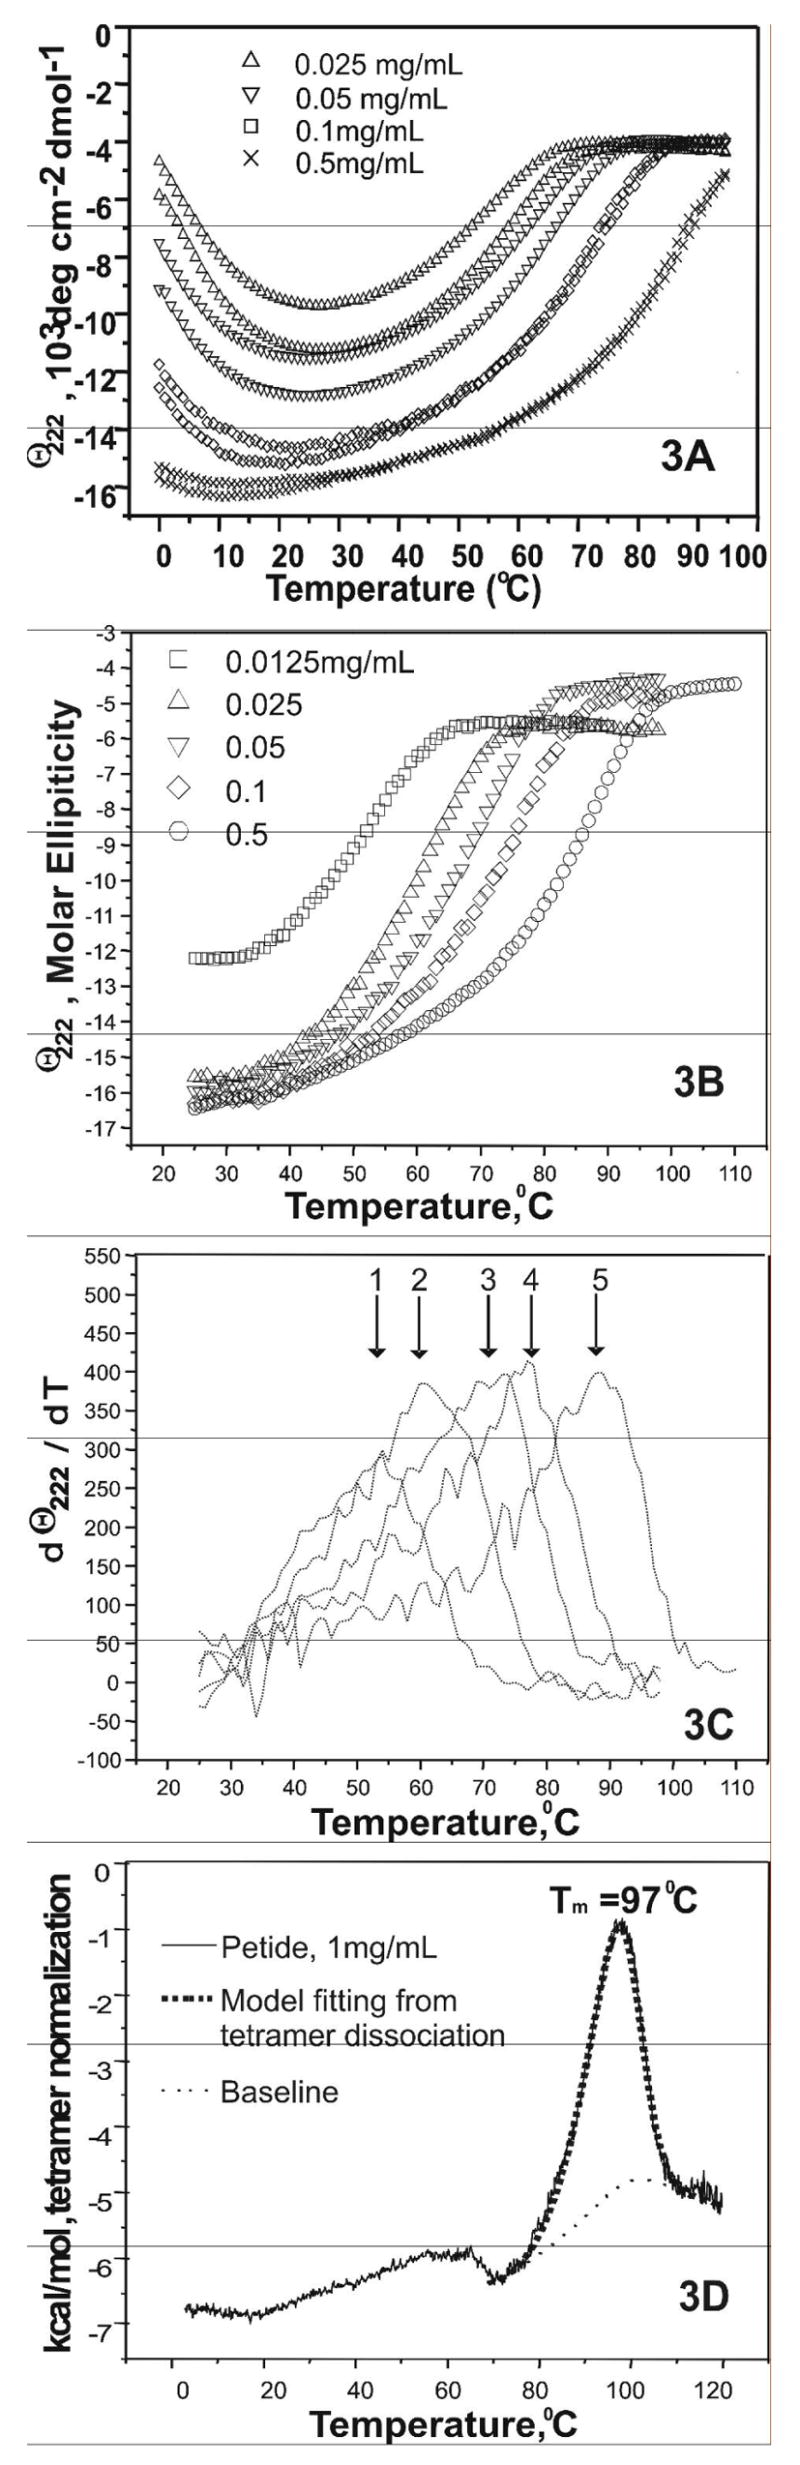
A. Thermal unfolding spectra (θ222(T)) of [198-243]apoA-I as a function of peptide concentration. The temperature range was 1°C to 95°C. The two lines show heating and cooling. The scanning rate was 0.0167 K/s (60 s/deg). Four peptide concentrations are shown: (△) 0.025 mg/mL, (▽) 0.05 mg/mL, (□) 0.1 mg/mL and (×)0.5 mg/mL. B. Thermal unfolding spectra (θ222(T)) of [198-243]apoA-I, starting from 25 °C to its unfolded state at a lower scan rate of 0.0033 K/s (300 s/deg). Five peptide concentrations are shown: (□) 0.0125 mg/mL, (△) 0.025 mg/mL, (▽) 0.05 mg/mL, (◇) 0.1 mg/mL and (○)0.5 mg/mL. C. Differentiation analysis of data in figure 3A: dθ222(T)/dT, as function of temperature. The corresponding peptide concentration and apparent Tm (marked by the arrows) for the five curves from left to right were: (1) 0.0125 mg/mL, ~ 54°C; (2) 0.025 mg/mL, ~ 61°C; (3) 0.05 mg/mL, ~ 70–75°C; (4) 0.1 mg/mL ~ 75–80°C; and (5) 0.5 mg/mL, ~ 80–92°C. D. Differential Scanning Calorimetry (DSC) on 1 mg/mL [198-243]apoA-I with a heating rate of 0.0083 K/s (30 deg/hour). The best fitting with a non-two- state tetramer dissociation model is shown. The symbols are: (—) normalized data from DSC measurement, (…) baseline generated by the fitting model and (
 ) fitting curve. Buffer line was subtracted. Only the larger peak at high temperature was analysized. The baseline was initiated according to the shape and further refined by the fitting model.
At all concentrations, the peptide undergoes apparent loss of α-helical structure at both high and low temperature, with maximum α-helix content at ~ 20°C. Since hydrophobic self-association is temperature dependent and it is strongest at room temperature [34], the apparent loss of helical structure at low temperature is probably the result of a decrease in the self-association of the peptide.
Figure 3B shows the thermal unfolding of [198-243]apoA-I at five concentrations with a slowerscan rate (0.00033 K/s or 300 s/deg) starting at room temperature. The reverse scans overlapped with their corresponding heating curves and are not shown for clarity. Interestingly, at 25 °C and all peptide concentrations examined except the lowest (0.0125 mg/mL), the α-helical contents of the peptide at different concentrations were similar, in contrast to those shown in figure 3A where the starting temperature was 0 °C. This indicates that the apparent unfolding process of the self-associated peptide at low temperature (0–25 °C) is probably a kinetically controlled process that results from both the decrease of self-association and the thermal unfolding of the peptide.
At 0.0125 mg/mL, where the α-helix content was ~ 38%, the unfolding curve of [198-243]apoA-I was sigmoidal, suggesting a cooperative two-state process. However, the unfolding curve became less cooperative in appearance as the peptide concentration increased. At 0.5 mg/mL concentration, the non-sigmoidal shape of the peptide unfolding process suggests the existence of multiple steps between the folded state and the unfolded state. The apparent Tm (figure 3C), derived from data in figure 3B, shifts to higher temperature by ~ 40°C as the peptide concentration increases from 0.0125 mg/mL (~ 54°C) to 0.5 mg/mL(~ 85–92°C). This suggests the formation of higher oligomer states at higher peptide concentration, with the higher self-associated oligomers having a higher stability.
The self-association of the peptide was investigated further by differential scanning calorimetry (DSC) measurements of the thermal unfolding at three peptide concentrations, 1 mg/mL, 2 mg/mL and 3 mg/mL. At 1 mg/mL, a sharp transition was observed at high temperature with a Tm of ~ 97 °C (figure 3D). This Tm is significantly higher (~ 5 °C) than that measured in CD experiments for the peptide at 0.5 mg/mL. At 2 mg/mL and 3 mg/mL peptide concentrations, the measured Tm did not change significantly, suggesting that self-association of the peptide reached equilibrium at 1 mg/mL concentration. A tetramer dissociation model yielded the best fitting to the sharp peak at high temperature (as shown in figure 3D). Alternative models, including a two-state, a non-two state and a non-two state other oligomer dissociation (see materials and methods) were inadequate to describe the data. The broad peaks at low temperature probably correspond to unfolding/dissociation the lower self-associated oligomers, such as dimer and trimer.
Thus, in solution, the peptide is in self-association equilibrium between monomer and multiple oligomeric states including dimer, trimer, tetramer and maybe pentamer. At low peptide concentration (0.0125 mg/mL), the equilibrium is probably dominated by unfolded monomer and folded dimer, and the thermal unfolding process of the peptide at this concentration is close to a two-state cooperative process. As concentration increases, trimer, tetramer and maybe pentamer are formed by further self-association. Tetramer becomes predominant as suggested by the DSC data. Thus, after the self-association reaches equilibrium, the major species and the most stable species is tetramer.
Interaction with detergent and folding reagents
A number of detergents, BOG, a small non-ionic lipid-mimicking detergent; SDS, an anionic detergent; DPC, a single chain phospholipid zwitter-ionic detergent; DHPC, a double short chain zwitter-ionic detergent; together with TFE, a α-helix inducer, induced the unstructured monomeric [198-243]apoA-I to fold into ~ 60% α-helix. In the presence of all non-ionic detergents, BOG, DPC and DHPC, at and above their CMC, far-UV CD spectra (data not shown) showed pronounced minima at 208 nm and 222 nm, typical of α-helix. Figure 4A shows the example of the α-helical content of [198-243]apoA-I at 25 °C, as function of BOG concentration. The α-helical structure in [198-243]apoA-I increased rapidly as the concentration of BOG increased in a small range around its CMC (~ 0.6% [35]) from 0.2% to 0.8%, and reached its maximum of ~ 60% at and above 0.8% BOG.
FIGURE 4.

A. The α-helical percentage of [198-243]apoA-I on the basis of θ222, as a function of BOG concentration. The peptide concentration was 0.005 mg/mL. The concentrations of BOG from left to right were: 0%, 0.2%, 0.4%, 0.8%, 1.0%, 1.2% and 1.6%. The corresponding BOG:peptide molar ratios were displayed on the top axis. B. The α-helical percentage of [198-243]apoA-I on the basis of θ222, as a function of SDS concentration. The peptide concentration was 0.005 mg/mL. The concentrations of SDS from left to right were: 0, 0.0002%, 0.0004%, 0.0008%, 0.001%, 0.0012%, 0.0014%, 0.0018%, 0.002%, 0.0024%, 0.125% and 0.25%. The corresponding SDS:peptide molar ratios are shown on the top axis. C. Cross-linking [198-243]apoA-I in the presence of various amounts of SDS. The peptide concentration was 1 mg/mL. Lane 1: no SDS, no cross-linker as control; lane 2: no SDS and 0.01% glutaraldehyde; lane 3: 0.2% SDS (typical CMC) and 0.01% glutaraldehyde; lane4: 0.02% SDS (~10 fold below its typical CMC but high enough to induce α-helical structure formation in [198-243]apoA-I) and 0.01% glutaraldehyde.
In contrast, in the presence of the ionic detergent SDS, the unstructured monomeric peptide started to form α-helix in 0.0004% SDS, ~ 500 fold below the typical CMC (0.17–0.23% [36, 37]) of the detergent. Figure 4B shows the α-helical content of [198-243]apoA-I at 25 °C over a wide SDS concentration range from 0.0002% to 0.25% (note that there is a break in the x-axis in order to show clearly the data at low SDS concentrations). At low SDS concentration, from 0.0002% to 0.0024% with a mid-point of 0.001% (35μM), the α-helical content of the peptide increased dramatically as the SDS concentration increased. This effective SDS concentration did not change over a 10-fold peptide concentration range (0.005–0.05 mg/mL, data not shown). Thus, SDS induces α-helical structure in [198-243]apoA-I at ~ 70 fold lower concentration than its typical CMC, suggesting that the α-helix formation in the peptide is either due to the SDS micelle formation at much lower concentration than in the absence of the peptide, or because of the specific binding of monomeric SDS to the peptide.
The SDS concentration, where the half maximum amount of α-helix was induced in [198-243]apoA-I, was ~ 0.001% (~ 35 μM), which corresponds to a SDS:peptide 36:1 molar ratio for a 0.005 mg/mL peptide concentration (top x-axis in figure 4B). In contrast, in the presence of BOG, a non-ionic detergent with similar molecular weight and micelle aggregation number (~ 84, [35]) to SDS, the equivalent detergent:peptide value for the 0.005 mg/mL peptide was much larger (14400:1 molar, top x-axis in figure 4A). Since the effective SDS concentration range is peptide concentration independent (data not shown), at 0.05 mg/mL peptide concentration, the SDS:peptide molar ratio will be ~ 3.6:1. A typical aggregation number for SDS spherical micelles is ~ 60 [38]. Thus, for [198-243]apoA-I in the presence of the SDS concentration where α-helical structure was induced, there were insufficient micelles for each peptide molecule even if the SDS micelles could be formed at such a low concentration. Therefore, single molecules of SDS may bind specifically to the peptide and induce the formation of α-helical structure, which is in contrast to the current concept [19] that SDS micelles induce and stabilize α-helical structure in apolipoproteins.
Since both self-association and SDS induced α-helical structure formation in the peptide, a cross-linking study on the interaction of self-associated (1 mg/mL) [198-243]apoA-I in different SDS concentrations was carried out (figure 4C). In the presence of 0.2% SDS (typical CMC) and 0.01% cross-linker (lane 3), a single band corresponding to monomer was observed, demonstrating that the SDS micelles disrupted the self-association of [198-243]apoA-I. Whereas, in the presence of 0.02% SDS (lane 4), ~ a concentration of ~ 10 fold below the typical CMC of SDS but enough to induce additional ~ 10% α-helical structure (data not shown) in self-associated [198-243]apoA-I, the peptide remained its tetrameric form. Thus, at sub-micellar concentration, SDS induced slightly more α-helical structure without disrupting the oligomerization of the peptide, maybe through specific binding.
Lipid Binding of [198-243]apoA-I
[198-243]apoA-I solublized DMPC liposomes over a wide range of initial ratios of DMPC: [198-243]apoA-I w/w from 1:1 to 10:1. Similar to the observations in the presence of detergents, unstructured monomeric [198-243]apoA-I (0.005 mg/mL) folded into α-helix in a DMPC concentration dependent manner and reached an apparent maximum α-helix content above 4:1 w/w DMPC: [198-243]apoA-I. The apparent α-helical content for [198-243]apoA-I in DMPC was ~ 60% (insert to figure 5B). At 0.1 mg/mL or higher peptide concentration when self-association induced ~ 50% α-helix, the helical amount did not increase significantly.
FIGURE 5.
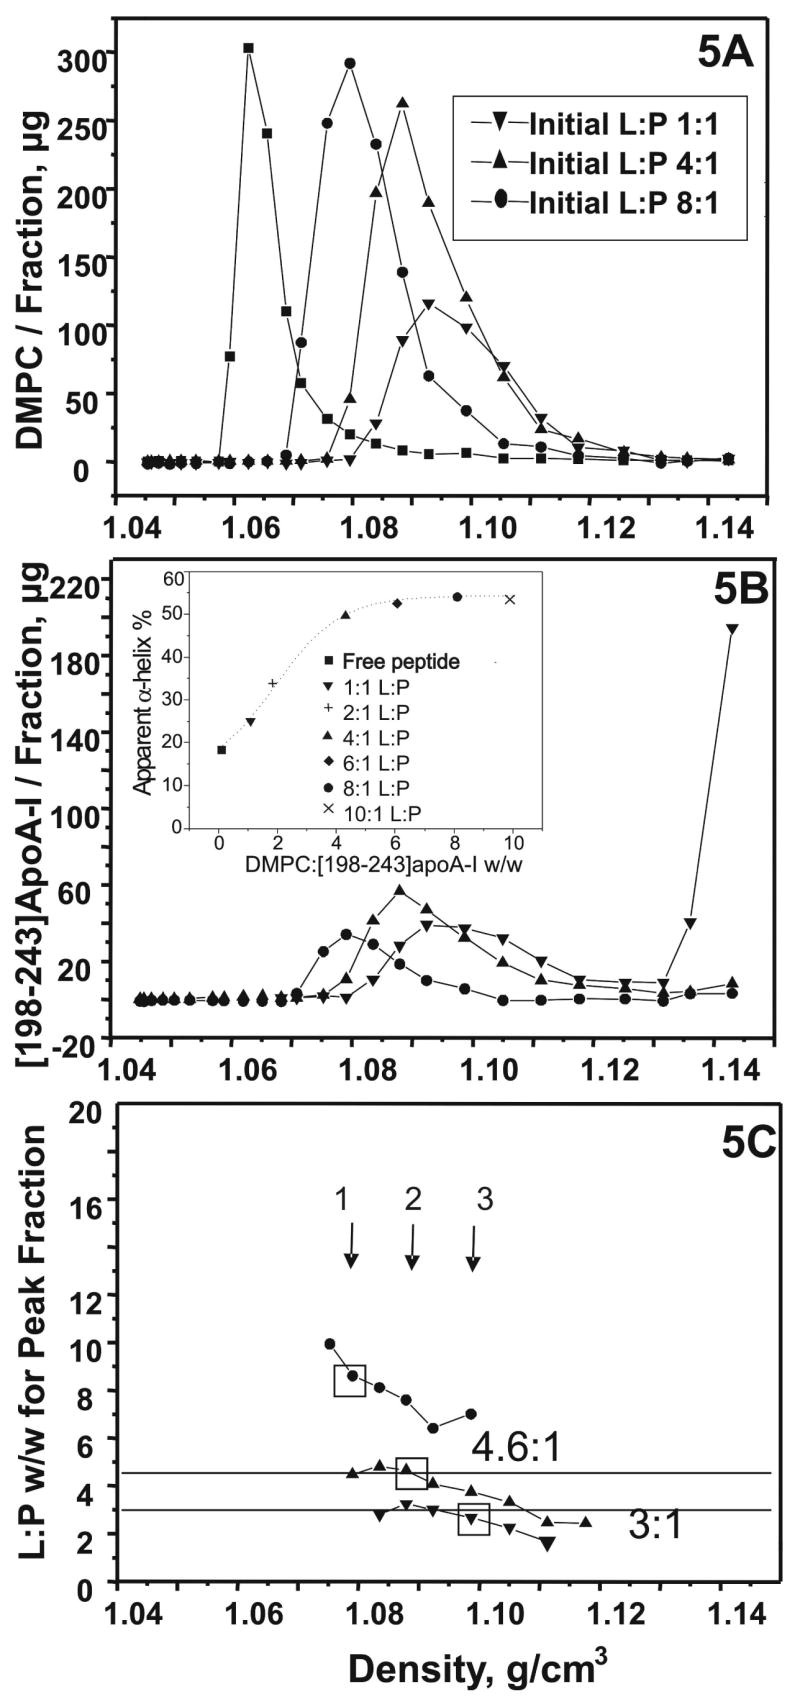
Density gradient ultracentrifugation of [198-243]apoA-I/DMPC mixtures at three initial lipid: peptide (L:P) w/w ratios: 1:1, 4:1 and 8:1. A. DMPC distribution in the density gradient. The symbols are: (–▼–) 1:1, (–▲–) 4:1, (—•—) 8:1, and (–■–) DMPC alone. B. The corresponding peptide distribution in the density gradient. Symbols are the same as above. The insert figure shows the apparent α-helical percentage of [198-243]apoA-I/DMPC from simple mixtures peptide/DMPC at different DMPC:[198-243]apoA-I w/w ratios with a peptide concentration of 0.005 mg/mL at pH 7.4 and 25°C: (■) no lipid, (▼)1:1, (+) 2:1, (▲) 4:1, (◆)6:1, (●) 8:1, and (×) 10:1. C. The corresponding DMPC: [198-243]apoA-I w/w ratio for each fraction that contains complexes as a function of density. Symbols are the same as in figure 5A. The arrows and boxes marked the peak fraction of each initial ratio: (1) 1:1; (2) 4:1; and (3) 8:1.
DMPC/[198-243]apoA-I complexes at three initial DMC:peptide w/w ratios, 1:1, 4:1 and 8:1, were separated by density gradient ultracentrifugation and the peak fractions visualized by EM. Figure 5A shows the lipid distribution and figure 5B shows the peptide distribution in the density gradient. In all cases, the lipid peak fraction corresponded to the peptide peak fraction except at an initial 1:1 w/w ratio, which showed a one-fraction shift of the lipid to the lower density range. All DMPC, together with most peptide, was enriched at a higher density range than that for free lipid, covering 3~5 fractions out of 25 in total, demonstrating complex formation. No free [198-243]apoA-I was observed at and above an initial 4:1 w/w ratio. Weight ratios, derived from figure 5A and figure 5B for those fractions containing a significant amount of complex, are shown in figure 5C. For the initial 1:1 ratio, relatively uniform ~ 3:1 weight ratio complexes and for the initial 4:1 ratio, relatively uniform ~ 4.6:1 weight ratio complexes, were formed. For the initial 8:1 ratio, rather heterogeneous particles were formed. At and above an initial 4:1 ratio, the peak ratio was similar to the initial ratio.
After density gradient ultracentrifugal separation, 3 to 5 fractions encompassing the peak for each sample were visualized individually by EM. For initial 1:1 and 4:1 ratios, the morphology of the complexes in all the fractions was similar. Typical discoidal complexes were observed individually, en face, on edge and stacked in rouleaux. A representative EM micrograph of the peak fraction at ~1.1 g/cm3 from an initial 1:1 ratio sample is shown at the right and the corresponding size distributions is shown at the left in figure 6A. Homogenous complexes, with a mean diameter ~ 110 (108±19) Å and thickness ~ 50 Å, typical of single phospholipid bilayer, were observed. For the peak fraction of initial 4:1 ratio at 1.085 g/cm3 (figure 6B), a larger homogenous complex, with a mean diameter ~ 165 (162±27) Å and the thickness of single phospholipid bilayer, was observed. For an initial ratio of DMPC:[198-243]apoA-I w/w 8:1 (data not shown), both larger disks and vesicles were observed in the peak fraction. Vesicles were predominant in fractions at lower density and more disk-like particles in fractions at higher density.
FIGURE 6.
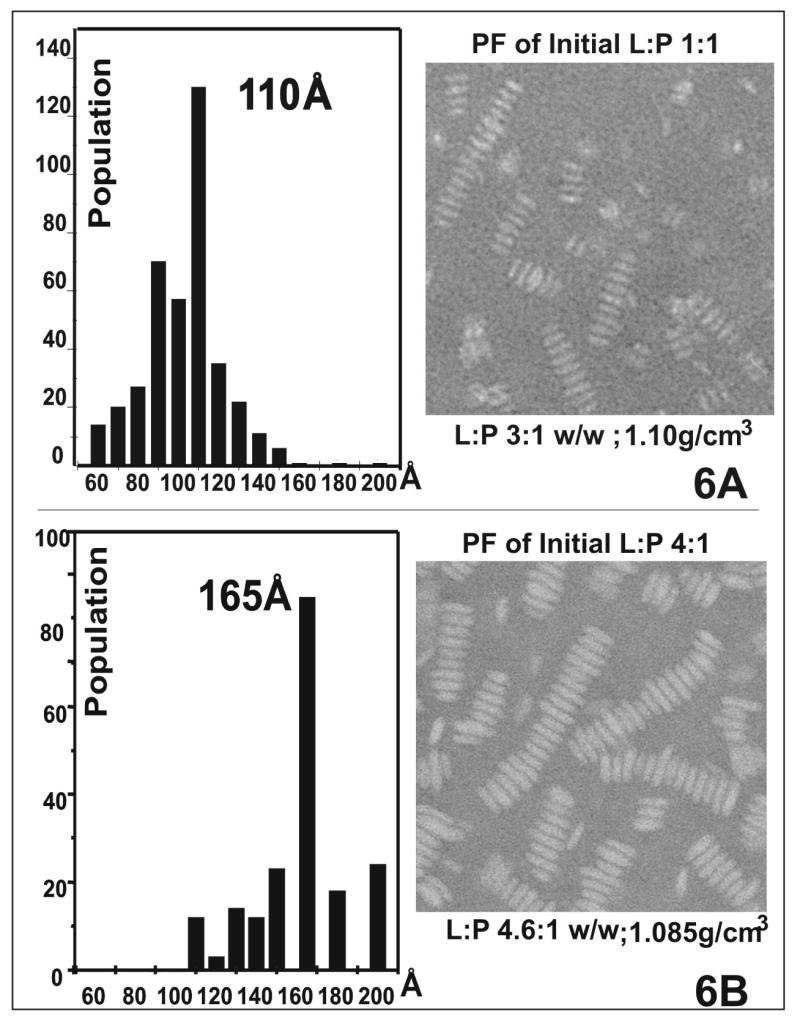
Negative staining EM images at 45K magnification observation of the peak fractions for two initial DMPC: [198-243]apoA-I w/w samples and their corresponding size distributions. A. 1:1 B. 4:1
The compositions of the discoidal particles, calculated from the combination of weight ratio and size (see materials and methods for calculation), are ~ 8 peptide and ~ 200 DMPC for small disks (~110 Å) formed at initial lipid:peptide 1:1 ratio, and ~ 14 peptide molecules and ~ 500 DMPC for large disks (~ 165 Å) formed at initial 4:1 ratio.
To determine the number of peptide molecules per disk directly, peptide molecules on the same complex were cross-linked by glutaraldehyde. As shown in figure 7, the simple mixture of DMPC:[198-243]apoA-I 1:1 w/w (lane 2 in panel C) with a predominant size of ~110 Å from EM observations (figure 6A), resulted in a broad band around ~ 40–55 kDa corresponding to ~ 8–10 peptide molecules. The peak fraction of DMPC:[198-243]apoA-I 4:1 w/w (lane 2 in panel D) with a predominant size of ~ 165 Å from EM observations (figure 6B), showed a broad band around ~ 70–90 kDa, corresponding to ~14–18 peptide molecules. Thus, for both types of disks formed by the C-terminal peptide, the peptide numbers per disk estimated from cross-linking were close to those calculated from the mean weight ratio and the size measured in EM observations.
FIGURE 7.
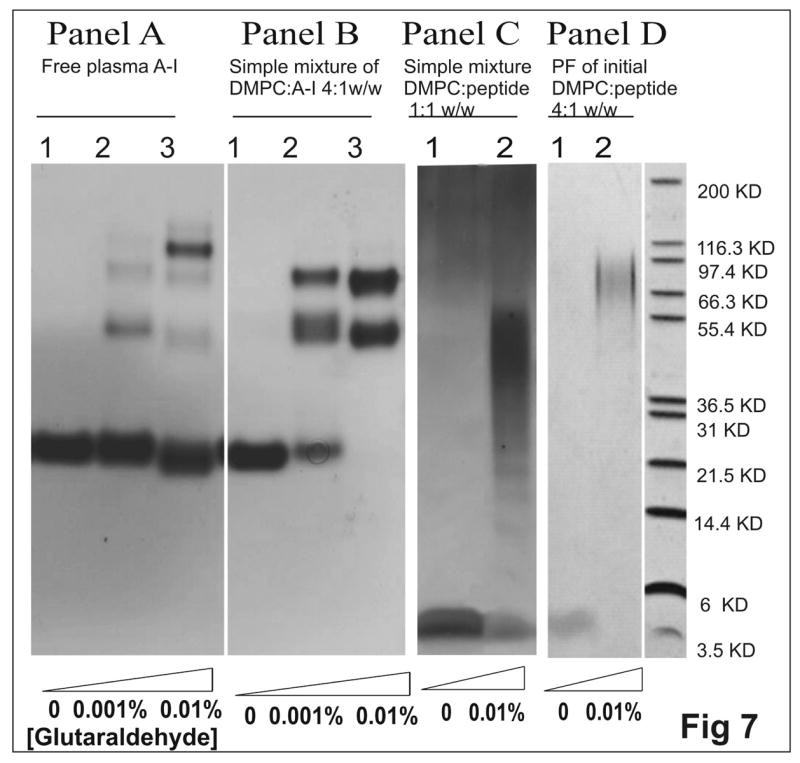
Glutaraldehyde cross-linked peptide/protein complexes of the protein-DMPC complexes, separated on 10–20% Tricine gradient gel. Panel A. 0.8 mg/mL A-I in solution. The concentrations of glutaraldehyde were: (lane1) 0, (lane2) 0.001% and (lane3) 0.01%. Panel B. 0.8 mg/mL plasma A-I in complex with DMPC from lipid:protein 4:1 w/w simple mixture. The concentrations of cross-linker were the same as panel A. Panel C. 0.8 mg/mL [198-243]apoA-I in complexed with DMPC from lipid:peptide 1:1 w/w simple mixture: (lane1) no cross-linker and (lane2) 0.01% glutaraldehyde. Panel D. 0.8 mg/mL [198-243]apoA-I in the peak fraction of initial DMPC: peptide 4:1 w/w: (lane1) no glutaraldehyde and (lane2) 0.01% glutaraldehyde. Panel C was silver stained to show the protein bands.
A simple mixture of DMPC:plasma A-I 4:1 w/w (panel B in figure 7), containing a mixture of both small (~110 Å) and large (~165 Å) disks observed at the peak fraction [32, 39], was used for comparison. In the presence of cross-linker, the molecular masses of the two pronounced bands (lane 3 in panel B), ~ 55 kDa for two cross-linked A-I from small disks (~110 Å) and ~ 80 kDa for three cross-linked A-I from the large disks (~165 Å) respectively, are similar to those for the complexes formed by the C-terminal peptide. Thus, the C-terminal peptide [198-243]apoA-I can interact with DMPC liposomes to generate two sizes of discoidal HDL like complexes, both of which are similar to the disks formed by plasma A-I under similar conditions. Therefore, [198-243]apoA-I can mimic the lipid interaction of the intact A-I.
Stability of complexes formed by [198-243]apoA-I-DMPC
To compare the stability of complexes formed by [198-243]apoA-I and apoA-I with DMPC, both thermal unfolding (θ222(T), figure 8A) and temperature-jump (θ222(t), figure 8B) experiments were performed for initial lipid:peptide/protein 4:1 w/w mixtures. The peptide representing the N-terminal apoA-I ([1-44]apoA-I), as characterized previously [21], was also investigated. The apparent Tm, was ~ 50 °C for DMPC:[1-44]apoA-I 4:1 w/w, ~ 65 °C for DMPC:[198-243]apoA-I 4:1 w/w, and ~ 82 °C for DMPC:apoA-I 4:1 w/w (figure 8A), derived from the differential analysis of the thermal unfolding heating curves at the same scanning rate. Thus, the apparent stability of the reconstituted particles are DMPC:apoA-I 4:1 w/w > DMPC:[198-243]apoA-I 4:1 w/w > DMPC:[1-44]apoA-I 4:1 w/w.
FIGURE 8.

A. Comparison thermal unfolding (θ222(T)) of complexes formed by [1-44]apoA-I, [198-243]apoA-I and plasma A-I with DMPC. The samples were lipid:peptide/protein w/w 4:1 for all, prepared at monomeric peptide or protein concentrations. The scanning rate was 0.0033 K/s (300 s/deg) for all. The top figure shows thermal unfolding heating curves of the three samples; the figure below shows their corresponding differential analysis that yielded the apparent Tm. B. Comparison Temperature-jump data (θ222(t)) of complexes formed by [1-44]apoA-I, [198-243]apoA-I and plasma A-I with DMPC. Samples were prepared at monomeric peptide or protein concentrations. The (θ222(t)) spectra were recorded every 10 seconds. The top figure shows temperature-jump data of the three samples in full length; the first 2000 seconds of those spectra are amplified in the figure below.
Temperature-jump θ222(t) data for the three types of mixtures at DMPC:peptide/protein 4:1 w/w, from 25 to 75 °C, showed a significant difference in the unfolding rates (figure 8B). At 75 °C, it took ~1–2 minutes for [1-44]apoA-I-DMPC, ~ 2 hours for [198-243]apoA-I-DMPC and ~ 16 hours for plasma A-I/DMPC to fully unfold. Thus, the differences in the unfolding rates for the same temperature-jump for the three types of complexes were consistent with the apparent Tm derived from thermal unfolding. Under similar conditions, the C-terminal peptide of apoA-I ([198-243]apoA-I) formed a more stable complex with DMPC than the N-terminal peptide ([1-44]apoA-I), which is consistent with the high lipid affinity of [198-243]apoA-I. In addition, both the peptides formed significantly less stable complexes than intact apoA-I. This suggests that inter-repeat interactions of apoA-I are important to stabilize the helical structure of intact apoA-I on discoidal complexes and thus plasma HDL.
DISCUSSION
Solution Structure
[198-243]apoA-I is unstructured in solution at ~ 1 μM concentration (0.005 mg/mL, figure 1). Previous studies on other peptides in our laboratory, [1-44]apoA-I [21], [99-142]apoA-I and [121-164]apoA-I, have also shown that they are all unstructured [25]. [143-186]apoA-I is also unstructured over concentration range from 0.02 to 0.2 mg/mL although there is a tendency for the peptide to form a dimer at and above ~ 1 mg/mL (data not shown). The five peptides cover regions of the N-terminal, C-terminal and central segment, encompassing 178 residues out of the total 243 amino acids of intact apoA-I. However, intact apoA-I in solution has ~ 60% α-helical structure, even at 2 μM concentration (0.005 mg/mL) when the protein is fully monomeric. This suggests that the interaction of the helix repeats contributes the folding of apoA-I into α-helical structure and stabilizes lipid free apoA-I. The C-terminal region in the monomeric intact apoA-I is probably in α-helical conformation that is stabilized by other helices of the molecule[18].
In contrast to other peptides of apoA-I studied by our group, which do not self-associate (e.g. [1-44]apoA-I [21], [99-143]apoA-I [26] and [121-164]apoA-I [25]) or have a weak tendency to form dimer (e.g. [143-186]apoA-I [40]), [198-243]apoA-I strongly self-associates as the concentration increases, and folds into ~ 50% α-helical structure. The self-associated [198-243]apoA-I is mainly tetramer and pentamer, as determined by cross-linking. However, native electrophoresis yielded only one band corresponding to a tetramer, and general unfolding data suggested the existence of multiple oligomers with equilibrium towards tetramer as the most stable species. Thus, the C-terminal region of residues 198-243 probably self-associates into tetramer and thus is likely responsible for the self-association of apoA-I, which also self-associates into tetramer [41]. This is also consistent with investigations using peptides of apoA-I [23, 24] and reports from a number of apoA-I terminal truncation studies by other groups. In solution, [44-186]apoA-I was reported to exist predominantly as a dimer [10]; [1-192]apoA-I existed only as monomers and dimers [7]; and the carboxyl-terminal deletion mutants [1-184]apoA-I and [1-208]apoA-I did not form higher order aggregates [8]. Interestingly, the self-association of the peptide starts at ~ 2 μM (0.01 mg/mL) and reaches its maximal helical structure at ~ 20 μM (0.1 mg/mL), as suggested by the formation of maximum α-helical structure at this concentration (figure 1). In contrast, apoA-I starts to self-associate at ~ 40 μM (0.1 mg/mL) [41], 20 fold higher molar concentration than that of [198-243]apoA-I. Thus, the self-association of [198-243]apoA-I is stronger than that of intact apoA-I. This suggests that the self-association of apoA-I through C-terminal interactions is probably modified by interaction of the C-terminus with other regions of the sequence.
The demonstration that this region of the sequence forms an independent helical hairpin domain in the recent crystal structure of apoA-I, is supportive to our suggestions that the extreme C-terminal 46 residues of apoA-I may function independently and can mimic the self-association and lipid interaction of the intact apoA-I.
As demonstrated by far-UV CD spectra and thermal unfolding data at different peptide concentrations, the self-association of [198-243]apoA-I is an equilibrium between monomer and the multiple self-associated states. The equilibrium moves towards tetramer as the peptide concentration increases. Interestingly, maximum helical structure was observed at and above 0.1 mg/mL (figure 1), whereas the tetrameric form of the peptide was predominant only at and above 1 mg/mL (figure 3). This suggests that higher oligomer association (e.g. tetramer) does not induce additional secondary structural folding in the peptide compared to lower species (e.g. dimer). However, the stability of higher oligomer species increased dramatically, as demonstrated by the increase of their Tm (figure 3). The Tm of [198-243]apoA-I at ~ 1 mg/mL, when the peptide is mainly in tetramer, is ~ 97 °C (figure 3C). This is ~ 35 °C higher than that of lipid free A–I in monomeric form [42]. Thus, the inter-molecular interactions between the tetrameric [198-243]apoA-I is much stronger than the intra-interaction between different putative helix repeats in apoA-I that folds ~ 60% of the protein into α-helical structure.
Interaction with lipid mimicking detergents
Similar to other apolipoproteins and their peptide models, [198-243]apoA-I folded into α-helical structure in the presence of a number lipid-mimicking detergents (BOG, DPC, DHPC and SDS) and protein folding reagents (TFE) (data not shown).
In contrast to all the other detergents (BOG, DPC and DHPC) investigated that induce α-helix formation in the peptides at and above detergent CMC, SDS induces α-helical structure formation in [198-243]apoA-I at μM concentrations (~ 35μM or 0.001%), hundred fold lower than its typical CMC (~ 0.17–0.23% or 6–8 mM [36]). This is also the observation for other apolipoproteins and their peptide models (0.002% for [1-44]apoA-I and 0.04% for [143-186]apoA-I, data not shown). SDS has been reported to induce α-helical structure in membrane proteins at concentrations above its typical CMC [43]. It is usually thought that α-helical structure in apolipoproteins induced by SDS is also concomitant to the formation of SDS micelles [19]. However, our data (figure 4B) suggest that this ionic detergent induces α-helical structure formation in apolipoproteins probably through specific binding, different to non-ionic or zwitter-ionic detergent (i.e. BOG, DPC and DHPC). In addition, SDS was reported to induce α-helical structure formation in the peptide of a membrane protein at SDS:peptide 1:1000 molar [44] and was proposed to be a “catalytic inducer” of α-helices. The mechanism of how SDS folds apolipoproteins into helix requires further investigation.
Lipid interaction
Both monomeric and self-associated peptide that contains ~ 50% α-helix can clear turbid DMPC suspensions over a wide range of lipid:peptide w/w ratios from 1:1 to 10:1. At 4:1 or higher ratios, no free peptide was observed, and both peptide and lipid were enriched in the density range of 1.08–1.12 g/cm3, typical of apoA-I/DMPC discoidal complexes. This is in contrast to the N-terminal peptide ([1-44]apoA-I), in which free [1-44]apoA-I always co-exists with complexes even in excess DMPC [21]. Thus, consistent with its proposed high lipid affinity, the C-terminal segment ([198-243]apoA-I) possesses a higher lipid affinity than the N-terminal segment of apoA-I. The high lipid affinity of [198-243]apoA-I is also supported by the observation that complexes formed by the C-terminal peptide with DMPC have a significantly higher stability than that of N-terminal peptide, as demonstrated by both the higher apparent Tm (figure 8A) and longer unfolding rate (figure 8B).
At self-associated concentration, [198-243]apoA-I formed two types of complexes with DMPC depending on the initial DMPC:peptide ratio, small discoidal complexes with density of ~ 1.1 g/cm3, weight ratio of ~ 3:1 (~ 23:1 molar) and size of ~ 110Å (figure 6A) and large discoidal complexes with density of ~ 1.085 g/cm3, weight ratio of ~ 4.6:1 (~ 36:1 molar) and size of ~ 165 Å (figure 6B). The calculated compositions were 8 peptide molecules and 200 DMPC for the small disks and 14 peptide molecules and 500 DMPC for the large ones. The total number of peptide molecules per particle for both types of complexes was consistent with the cross-linking study (figure 7).
Considering the α-helical content of the peptide in lipid bound form is ~ 60%, the total helix length per disk can be calculated to be ~ 340–425 Å for the small disk (~ 110 Å, figure 6A) and ~ 595–765 Å for the large disk (~ 165 Å, figure 6B). These helix lengths can be compared to the perimeter of the lipid component of the disk namely ~ 280 Å and ~ 450 Å respectively. Thus total helix length is more than sufficient to cover the disk edge with a single belt but somewhat less than that required for a continuous helical double belt. However, binding of unstructured regions of the peptide(S) to the disk edge may compensate for the lack of helical conformation. In contrast to the ~100 Å disk like complex formed by the N-terminal peptide ([1-44]apoA-I) in which helical structure was insufficient to cover the disk edge even by a single belt [21], the compositions of complexes formed by the C-terminal peptide are more consistent with a “double belt” model, similar to that proposed for full length apoA-I [45, 46].
The characteristics (density, weight ratio, size, composition and the total helix length per particle) of the two types of disks formed by the peptide are similar to those formed by the intact apoA-I under similar conditions [32, 39]. This suggests that the C-terminal peptide can mimic the phospholipid interaction of intact apoA-I, also supporting the high lipid affinity of this peptide. Thus, this segment of apoA-I may play a critical role in initiating phospholipid binding in the formation of nascent discoidal HDL. However, the stability of complexes formed by the peptide is much less than that of apoA-I, as demonstrated by the apparent Tm (figure 8A) and unfolding rate (figure 8B). This suggests that the interaction among the putative inter-helix repeats is important for intact apoA-I to cooperatively bind with phospholipids and to stabilize the complexes.
Interestingly, at monomeric concentration, when the C-terminal peptide ([198-243]apoA-I) is fully unstructured, a different disk like complex was formed. Specifically, at initial lipid: peptide 1:1 w/w, the peak fraction density was ~ 1.085 g/cm3, with a weight ratio of ~ 4:1 and a size distribution of ~ 103±20 Å (data not shown). These values were identical to the complex formed by DMPC with the fully unstructured N-terminal peptide ([1-44]apoA-I) under similar conditions [21]. The calculated composition of this disk like complex only contains enough helix to wrap the phospholipid bilayer once. This suggests that monomeric unstructured N- and C-terminal peptides may interact with phospholipid in a different manner, as compared to the pre-helical structured self-associated conformation of the C-terminal peptide ([198-243]apoA-I). The disk like structure may be a “micelle-like” complex with the peptide randomly distributed and creating curvature at the surface of the phospholipid “bilayer”. The interaction and the organization between the monomeric peptide and DMPC may be similar to that of apolipoproteins with the phospholipid monolayer at the surface of mature spherical HDL; whereas the interaction of the pre-folded and paired α-helical conformation of the self-associated C-terminal peptide with DMPC is possibly representing the interaction of apolipoproteins with phospholipid bilayer disc in the nascent discoidal HDL.
Abbreviations
- apo
apolipoprotein
- BOG
n-Octyl-β-D-glucopyranoside
- far -UV CD
far ultraviolet circular dichroism
- CMC
critical micelle concentration
- DMPC
Dimyristoyl Phosphatidyl Choline
- EM
electron microscopy
- PK
peak fraction
- SDS
Sodium Dodecyl Sulfate
Footnotes
This work was supported by Grants POHL26335 from the National Institute of Health.
References
- 1.Brouillette CG, et al. Structural models of human apolipoprotein A-I: a critical analysis and review. Biochim Biophys Acta. 2001;1531(1–2):4–46. doi: 10.1016/s1388-1981(01)00081-6. [DOI] [PubMed] [Google Scholar]
- 2.Gursky O. Apolipoprotein structure and dynamics. Curr Opin Lipidol. 2005;16(3):287–94. doi: 10.1097/01.mol.0000169348.61191.ac. [DOI] [PubMed] [Google Scholar]
- 3.Sorci-Thomas MG, Thomas MJ. The effects of altered apolipoprotein A-I structure on plasma HDL concentration. Trends Cardiovasc Med. 2002;12(3):121–8. doi: 10.1016/s1050-1738(01)00163-3. [DOI] [PubMed] [Google Scholar]
- 4.Sorci-Thomas MG, et al. Single repeat deletion in ApoA-I blocks cholesterol esterification and results in rapid catabolism of delta6 and wild-type ApoA-I in transgenic mice. J Biol Chem. 2000;275(16):12156–63. doi: 10.1074/jbc.275.16.12156. [DOI] [PubMed] [Google Scholar]
- 5.Rogers DP, et al. Structural analysis of apolipoprotein A-I: effects of amino- and carboxy-terminal deletions on the lipid-free structure. Biochemistry. 1998;37(3):945–55. doi: 10.1021/bi9713512. [DOI] [PubMed] [Google Scholar]
- 6.Gorshkova IN, et al. Lipid-free structure and stability of apolipoprotein A-I: probing the central region by mutation. Biochemistry. 2002;41(33):10529–39. doi: 10.1021/bi025807d. [DOI] [PubMed] [Google Scholar]
- 7.Ji Y, Jonas A. Properties of an N-terminal proteolytic fragment of apolipoprotein AI in solution and in reconstituted high density lipoproteins. J Biol Chem. 1995;270(19):11290–7. doi: 10.1074/jbc.270.19.11290. [DOI] [PubMed] [Google Scholar]
- 8.Laccotripe M, et al. The carboxyl-terminal hydrophobic residues of apolipoprotein A-I affect its rate of phospholipid binding and its association with high density lipoprotein. J Biol Chem. 1997;272(28):17511–22. doi: 10.1074/jbc.272.28.17511. [DOI] [PubMed] [Google Scholar]
- 9.Huang W, et al. A single amino acid deletion in the carboxy terminal of apolipoprotein A-I impairs lipid binding and cellular interaction. Arterioscler Thromb Vasc Biol. 2000;20(1):210–6. doi: 10.1161/01.atv.20.1.210. [DOI] [PubMed] [Google Scholar]
- 10.Beckstead JA, et al. Combined N- and C-terminal truncation of human apolipoprotein A-I yields a folded, functional central domain. Biochemistry. 2005;44(11):4591–9. doi: 10.1021/bi0477135. [DOI] [PubMed] [Google Scholar]
- 11.McLachlan AD. Repeated helical pattern in apolipoprotein-A-I. Nature. 1977;267(5610):465–6. doi: 10.1038/267465a0. [DOI] [PubMed] [Google Scholar]
- 12.Boguski MS, et al. Evolution of the apolipoproteins. Structure of the rat apo-A-IV gene and its relationship to the human genes for apo-A-I, C-III, and E. J Biol Chem. 1986;261(14):6398–407. [PubMed] [Google Scholar]
- 13.Luo CC, et al. Structure and evolution of the apolipoprotein multigene family. J Mol Biol. 1986;187(3):325–40. doi: 10.1016/0022-2836(86)90436-5. [DOI] [PubMed] [Google Scholar]
- 14.Boguski MS, et al. On computer-assisted analysis of biological sequences: proline punctuation, consensus sequences, and apolipoprotein repeats. J Lipid Res. 1986;27(10):1011–34. [PubMed] [Google Scholar]
- 15.Nolte RT, Atkinson D. Conformational analysis of apolipoprotein A-I and E-3 based on primary sequence and circular dichroism. Biophys J. 1992;63(5):1221–39. doi: 10.1016/S0006-3495(92)81698-3. [DOI] [PMC free article] [PubMed] [Google Scholar]
- 16.Segrest JP, et al. The amphipathic helix in the exchangeable apolipoproteins: a review of secondary structure and function. J Lipid Res. 1992;33(2):141–66. [PubMed] [Google Scholar]
- 17.Rogers DP, et al. Truncation of the amino terminus of human apolipoprotein A-I substantially alters only the lipid-free conformation. Biochemistry. 1997;36(2):288–300. doi: 10.1021/bi961876e. [DOI] [PubMed] [Google Scholar]
- 18.Gorshkova IN, et al. Probing the lipid-free structure and stability of apolipoprotein A-I by mutation. Biochemistry. 2000;39(51):15910–9. doi: 10.1021/bi0014406. [DOI] [PubMed] [Google Scholar]
- 19.Okon M, et al. Heteronuclear NMR studies of human serum apolipoprotein A-I. Part I. Secondary structure in lipid-mimetic solution. FEBS Lett. 2002;517(1–3):139–43. doi: 10.1016/s0014-5793(02)02600-5. [DOI] [PubMed] [Google Scholar]
- 20.Oda MN, et al. The C-terminal domain of apolipoprotein A-I contains a lipid-sensitive conformational trigger. Nat Struct Biol. 2003;10(6):455–60. doi: 10.1038/nsb931. [DOI] [PubMed] [Google Scholar]
- 21.Zhu HL, Atkinson D. Conformation and lipid binding of the N-terminal (1-44) domain of human apolipoprotein A-I. Biochemistry. 2004;43(41):13156–64. doi: 10.1021/bi0487894. [DOI] [PubMed] [Google Scholar]
- 22.Ajees AA, et al. Crystal structure of human apolipoprotein A-I: insights into its protective effect against cardiovascular diseases. Proc Natl Acad Sci U S A. 2006;103(7):2126–31. doi: 10.1073/pnas.0506877103. [DOI] [PMC free article] [PubMed] [Google Scholar] [Retracted]
- 23.Palgunachari MN, et al. Only the two end helixes of eight tandem amphipathic helical domains of human apo A-I have significant lipid affinity. Implications for HDL assembly. Arterioscler Thromb Vasc Biol. 1996;16(2):328–38. doi: 10.1161/01.atv.16.2.328. [DOI] [PubMed] [Google Scholar]
- 24.Mishra VK, et al. Studies of synthetic peptides of human apolipoprotein A-I containing tandem amphipathic alpha-helixes. Biochemistry. 1998;37(28):10313–24. doi: 10.1021/bi980042o. [DOI] [PubMed] [Google Scholar]
- 25.Wally J. Conformation and lipid binding properties of peptide models of exchangeable apolipoproteins: University Microfilms International Publication. Boston University; PhD 2004, # AAT 3142398. [Google Scholar]
- 26.Chao Y. Conformational studies of a consensus sequence peptide (CSP) and a real sequence peptide (RSP) of apolipoproteins by circular dichroism spectroscopy and X-ray crystallography. University Microfilms International Publication; Boston University: PhD 2003, # AAT3068030. [Google Scholar]
- 27.Dong L, Atkinson D. Structure and Stablity of a consensus sequence (CSP-BABA) of apolipoproteins. Protein Science. 2005;14(suppl 1) [Google Scholar]
- 28.Gursky O. Solution conformation of human apolipoprotein C-1 inferred from proline mutagenesis: far- and near-UV CD study. Biochemistry. 2001;40(40):12178–85. doi: 10.1021/bi0111505. [DOI] [PubMed] [Google Scholar]
- 29.Fang Y, Gursky O, Atkinson D. Structural studies of N- and C-terminally truncated human apolipoprotein A-I. Biochemistry. 2003;42(22):6881–90. doi: 10.1021/bi034152t. [DOI] [PubMed] [Google Scholar]
- 30.Mao D, Wallace BA. Differential light scattering and absorption flattening optical effects are minimal in the circular dichroism spectra of small unilamellar vesicles. Biochemistry. 1984;23(12):2667–73. doi: 10.1021/bi00307a020. [DOI] [PubMed] [Google Scholar]
- 31.Swaney JB, O’Brien K. Cross-linking studies of the self-association properties of apo-A-I and apo-A-II from human high density lipoprotein. J Biol Chem. 1978;253(19):7069–77. [PubMed] [Google Scholar]
- 32.Fang Y, Gursky O, Atkinson D. Lipid-binding studies of human apolipoprotein A-I and its terminally truncated mutants. Biochemistry. 2003;42(45):13260–8. doi: 10.1021/bi0354031. [DOI] [PubMed] [Google Scholar]
- 33.Janiak MJ, Small DM, Shipley GG. Temperature and compositional dependence of the structure of hydrated dimyristoyl lecithin. J Biol Chem. 1979;254(13):6068–78. [PubMed] [Google Scholar]
- 34.Schellman JA. Temperature, stability, and the hydrophobic interaction. Biophys J. 1997;73(6):2960–4. doi: 10.1016/S0006-3495(97)78324-3. [DOI] [PMC free article] [PubMed] [Google Scholar]
- 35.Lorber B, Bishop JB, DeLucas LJ. Purification of octyl beta-D-glucopyranoside and re-estimation of its micellar size. Biochim Biophys Acta. 1990;1023(2):254–65. doi: 10.1016/0005-2736(90)90421-j. [DOI] [PubMed] [Google Scholar]
- 36.Reynolds JA, et al. The binding of divers detergent anions to bovine serum albumin. Biochemistry. 1967;6(3):937–47. doi: 10.1021/bi00855a038. [DOI] [PubMed] [Google Scholar]
- 37.Otzen DE. Protein unfolding in detergents: effect of micelle structure, ionic strength, pH, and temperature. Biophys J. 2002;83(4):2219–30. doi: 10.1016/S0006-3495(02)73982-9. [DOI] [PMC free article] [PubMed] [Google Scholar]
- 38.Otzen DE, Oliveberg M. Burst-phase expansion of native protein prior to global unfolding in SDS. J Mol Biol. 2002;315(5):1231–40. doi: 10.1006/jmbi.2001.5300. [DOI] [PubMed] [Google Scholar]
- 39.Jonas A, Kezdy KE, Wald JH. Defined apolipoprotein A-I conformations in reconstituted high density lipoprotein discs. J Biol Chem. 1989;264(9):4818–24. [PubMed] [Google Scholar]
- 40.Zhu HL. Structure, Interaction and lipid binding of sub-domains of human apolipoprotein A-I. University Microfilms International Publication; Boston University: PhD 2006, # AAT3215009. [Google Scholar]
- 41.Teng TL, et al. An ultracentrifugal study of the self-association of canine apolipoprotein A-I in solution. J Biol Chem. 1977;252(23):8634–8. [PubMed] [Google Scholar]
- 42.Mehta R, Gantz DL, Gursky O. Human plasma high-density lipoproteins are stabilized by kinetic factors. J Mol Biol. 2003;328(1):183–92. doi: 10.1016/s0022-2836(03)00155-4. [DOI] [PubMed] [Google Scholar]
- 43.Montserret R, et al. Involvement of electrostatic interactions in the mechanism of peptide folding induced by sodium dodecyl sulfate binding. Biochemistry. 2000;39(29):8362–73. doi: 10.1021/bi000208x. [DOI] [PubMed] [Google Scholar]
- 44.Micelli S, et al. Effect of nanomolar concentrations of sodium dodecyl sulfate, a catalytic inductor of alpha-helices, on human calcitonin incorporation and channel formation in planar lipid membranes. Biophys J. 2004;87(2):1065–75. doi: 10.1529/biophysj.103.037200. [DOI] [PMC free article] [PubMed] [Google Scholar]
- 45.Segrest JP, et al. A detailed molecular belt model for apolipoprotein A-I in discoidal high density lipoprotein. J Biol Chem. 1999;274(45):31755–8. doi: 10.1074/jbc.274.45.31755. [DOI] [PubMed] [Google Scholar]
- 46.Catte A, et al. Novel changes in discoidal high density lipoprotein morphology: a molecular dynamics study. Biophys J. 2006;90(12):4345–60. doi: 10.1529/biophysj.105.071456. [DOI] [PMC free article] [PubMed] [Google Scholar]