Abstract
The anisotropic spin interactions measured for membrane proteins in weakly oriented micelles and in oriented lipid bilayers provide independent and potentially complementary high-resolution restraints for structure determination. Here we show that the membrane protein CHIF adopts a similar structure in lipid micelles and bilayers, allowing the restraints from micelle and bilayer samples to be combined in a complementary fashion to enhance the structural information. Back-calculation and assignment of the NMR spectrum of CHIF in oriented lipid bilayers, from the structure determined in micelles, provides additional restraints for structure determination as well as the global orientation of the protein in the membrane. The combined use of solution and solid-state NMR restraints also affords cross-validation for the structural analysis.
NMR spectroscopy offers two complementary approaches to the structure determination of membrane proteins, based either on samples of proteins in isotropic lipid micelles or in liquid crystalline lipid bilayers. Both methods benefit from the measurement of orientation restraints derived from anisotropic interactions, such as dipolar couplings and chemical shifts, which can be obtained by inducing various degrees of sample alignment relative to the field of the NMR magnet. The resulting orientation-dependent information provides very high-resolution restraints for structure determination and refinement of both globular and membrane proteins1–3. Measurements made in oriented lipid bilayers have the important advantage that they enable structures to be determined in an environment that closely resembles the cellular membrane. Furthermore, since the alignment tensor is fixed by the sample geometry, they provide the global orientation of the protein in the membrane. This information, while valuable in its own right, could also be used to supplement the data from micelles, by providing a second alignment to resolve among the symmetry-related orientations of protein domains. Thus, detailed structural information about membrane proteins could be obtained by combining the restraints derived from proteins in bilayers with those from proteins in micelles, provided that the same structure is present in the two types of samples.
Here we demonstrate that the integral membrane protein CHIF (FXYD4), a major regulatory subunits of the Na,K-ATPase in specialized mammalian tissues4, adopts a similar structure in bilayers as in micelles. This allows us to back-calculate and assign the NMR spectrum of CHIF in oriented lipid bilayers from the structure determined in micelles, thereby supplementing the restraints for structure determination and providing the protein orientation in the membrane.
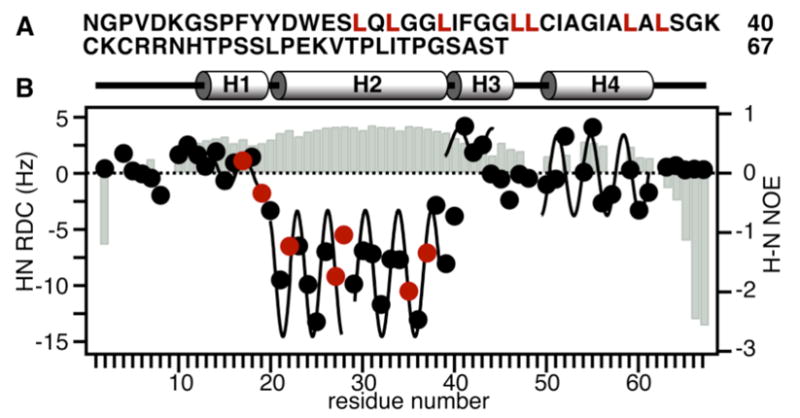
In micelles, the structure of CHIF mirrors the structure of the corresponding gene, with four helices (H1 - H4) and helix breaks mapping to intron-exon junctions, and delineating discrete structured domains5. The measurement of 1H-15N residual dipolar couplings (RDCs) (Figure 1) was instrumental for identifying helix breaks that map to genetic elements, and for determining the three-dimensional structures of both CHIF and the related protein FXYD15,6. The four helices of CHIF can be traced by fitting the experimental RDCs to sinusoids with the signature α-helical periodicity of 3.6 residues, and the 1H/15N heteronuclear NOEs indicate that they have similar backbone dynamics (Figure 1B). Although RDCs yield very accurate orientation restraints, they cannot determine the protein orientation in the membrane. This information, however, can be obtained by measuring dipolar couplings and chemical shifts in samples of the protein in oriented lipid bilayers, as illustrated in Figures 2 and 3.
Figure 1.

(A) Amino acid sequence of CHIF (NCBI accession: NP_068702). Residue numbering begins at 1 after the signal sequence. Leu in H1 and H2 are in red. Leu22 and Leu35 were introduced by mutations of native Met. (B) Secondary structure, 1H-15N RDCs, and 1H/15N heteronuclear NOEs (gray bars), for CHIF in micelles. Positions left blank correspond to Pro (3, 9, 49, 53, 58, 62) or overlapped peaks. Sample preparation and NMR experiments were as described5, 7.
Figure 2.

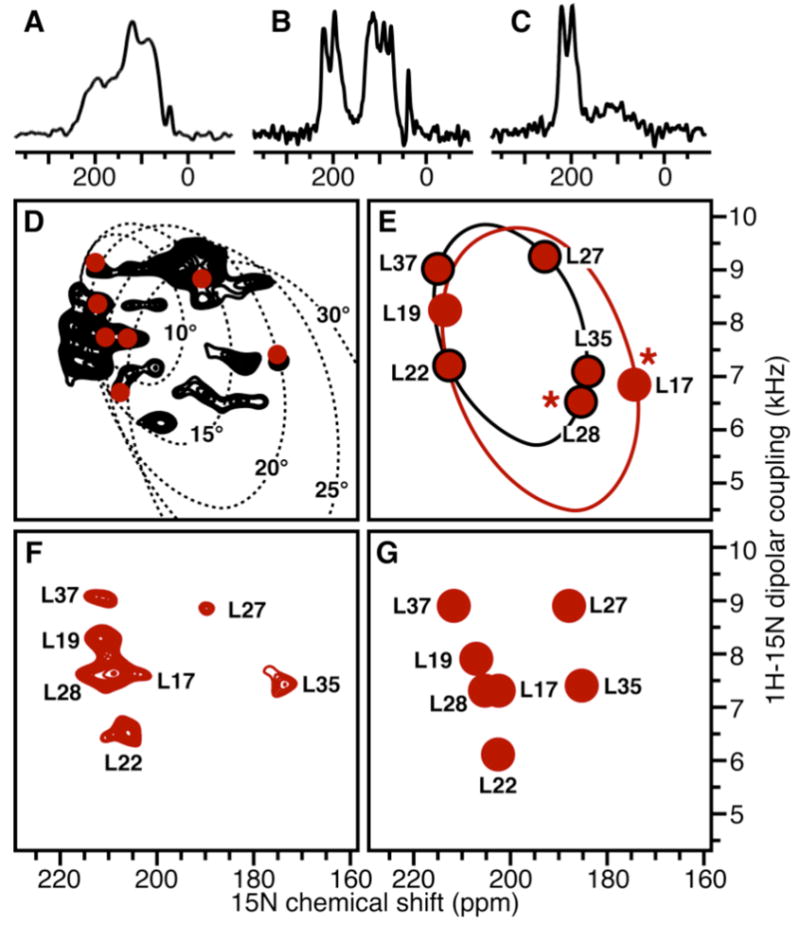
NMR spectra of 15N-labeled CHIF in lipid bilayers (B–G) oriented with the bilayer surface perpendicular to the magnetic field or (A) unoriented. (C) Sample exposed to D2O. (D–G) PISEMA spectra of the transmembrane region for (D) uniformly 15N-labeled or (E–G) Leu 15N-labeled CHIF. The dotted lines trace the wheel-like spectra calculated for ideal α-helices with different tilts. The red circles reproduce the experimental Leu spectrum. (E) The Leu spectrum (filled red circles) was calculated for two separate ideal α-helices with 15° (black line) or 20° (red line) tilt. Asterisks mark peaks that are expected to deviate from the wheel. (G) Leu spectrum back-calculated from the structure of CHIF after refinement with the dipolar couplings assigned in (F). Spectra were calculated with tensor values and FORTRAN code as described9–11. Sample preparation and NMR experiments were as described7. Samples contained 2–4 mg of 15N-labeled protein, 80 mg of di-oleoyl-phosphatidyl-choline, and 20 mg of di-oleoyl-phosphatidyl-glycerol.
Figure 3.

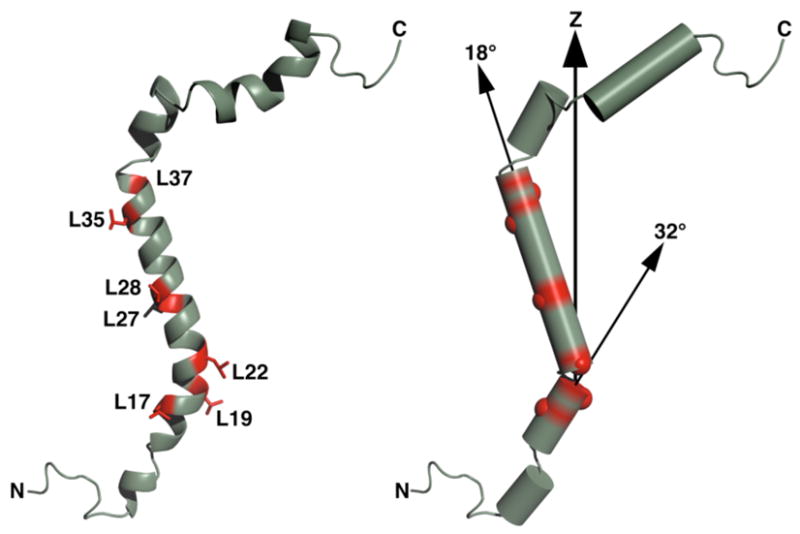
Structure of CHIF determined in micelles and oriented in the membrane using the data from oriented lipid bilayers. The structure in micelles (PDB code: 2JP3) was determined as described for its homolog FXYD16. Z is the axis perpendicular to the membrane surface.
In the 15N chemical shift spectrum of CHIF in oriented bilayers the peaks near 200 ppm are from backbone sites in the transmembrane helix7 (Figure 2B). As observed in micelles5, the amide hydrogens in this region resist exchange with D2O, indicating that they participate in tight hydrogen bonds (Figure 2C). Peaks near 80 ppm are from sites with NH bonds nearly parallel to the membrane surface, while several residues in the loop and terminal regions are mobile and give the peaks centered near 120 ppm, which are also seen in the spectrum obtained from unoriented bilayer vesicles (Figure 2A). The narrow chemical shift dispersion around 200 ppm indicates that CHIF crosses the membrane with a small tilt angle, and this is confirmed by the 1H/15N PISEMA spectra obtained for uniformly or Leu 15N-labeled protein (Figure 2D, F).
For proteins in oriented lipid bilayers, PISEMA spectra exhibit characteristic wheel-like patterns of resonances that reflect the protein structures and orientations in the membrane8–10. The direct relationship between spectrum and structure makes it possible to calculate NMR spectra from specific structural models of proteins, and provides a method for structure determination11,12.
To estimate the tilt of the CHIF transmembrane helix we first compared the spectra of CHIF with those calculated for ideal α-helices (φ, Ψ = −60°, −40°) with varying transmembrane tilts, and found that CHIF adopts an approximate tilt of less than 20° (Figure 2D). The seven Leu (17, 19, 22, 27, 28, 35, 37) in helices H1 and H2 give the spectrum in Figure 2F and fall between the 15° and 20° tilt ideal helix traces, however, the RDC data (Figure 1), and the corresponding structure of CHIF in micelles (Figure 3), show that a break at Gly20 causes H1 and H2 to adopt different orientations, and suggest that the PISEMA spectrum has to be fitted with two helices of different tilts. The structure also suggests that these fits will be distorted by deviations in torsion angle regularity at Leu17 and Leu28 (Figure 2E, asterisks).
With these considerations in mind, we set out to generate test assignments, as described11, of the Leu PISEMA spectrum based on back-calculation from two separate ideal helices, one spanning Leu17 and 19, and the other Leu22, 27, 28, 35, and 37, each with 15° or 20° tilt, and different rotations around their long helix axes (Figure 2E). Each of the ten plausible test assignments was then used to generate a list of dipolar coupling restraints which were input to the XPLOR-NIH SANI potential to orient the micelle structure by rigid body internal dynamics13,14. The resulting oriented coordinates were used, in turn, to back-calculate the PISEMA spectrum, which was then evaluated for its closeness of fit to the experimental spectrum by computing the RMSDs between the observed and calculated NMR frequencies. Of the ten test assignments, only one was able to reproduce the pattern of the dipolar couplings and chemical shifts (Figure 2F–G), regardless of any uncertainty in the NH bond length and chemical shift tensor, while the others either violated the structure or yielded chemical shifts very different from those observed experimentally.
To obtain frequency-independent values of the RMSDs for dipolar couplings and chemical shifts, each deviation (Δ) between observed (Fo) and calculated (Fc) frequency was scaled by the resolution index (Ri)15, calculated by dividing the spectral range available for each interaction (10 kHz; 150 ppm) by the observed linewidth (0.5 kHz; 3 ppm), yielding ΔHN = |Fo−Fc|/20 for the dipolar coupling and ΔN = |Fo−Fc|/50 for the chemical shift (Ri,N = 150/3; Ri,HN = 10/0.5). The resulting RMSDs of 0.03 (dipolar couplings) and 0.13 (chemical shifts) reflect experimental errors as well as uncertainties in the tensors and structure coordinates. Since the chemical shifts were not included in the structural refinement, their RMSD is analogous to the Rfree parameter used in X-ray crystallography, providing a measure of structural analysis cross-validation.
The structure of CHIF oriented in the membrane in this way (Figure 3) shows that helix H1 (Phe10 - Leu19) adopts a tilt of 32°, H2 (Gly20 - Gly39) a tilt of 18°, and H3 (Lys40 - Arg45) a tilt of 30°. Helix H4 (Pro49 - Thr61) is curved and adopts a tilt between 80° and 60°. The transmembrane region of the spectrum of uniformly 15N-labeled CHIF appears to show little evidence for an ideal helix tilted at 30°, however, we note that while H2 has dihedral angles near the ideal values, H1, H3, as well as H4 deviate significantly from ideality. Furthermore, the PISEMA spectra in Figure 2 were obtained with experimental parameters optimized for observation in the transmembrane region. Finally, it is also possible that the kinks are somewhat less pronounced in bilayers than in micelles; this will have to be confirmed by measuring additional structural restraints.
The ability to back calculate the spectrum in bilayers from the structure determined in micelles indicates that the structures in these distinct environments are similar, and suggests that the data obtained from these two types of samples can be used in a complementary fashion. While this may not hold in all cases, this is one of many indications that the structured domains of membrane proteins are similar in micelles and bilayers.
Acknowledgments
This work was supported by the NIH (R01CA082864). It utilized the NIH-supported Resource for NMR Molecular Imaging of Proteins (P41EB002031) and Burnham Institute NMR Facility (P30CA030199).
References
- 1.Opella SJ, Marassi FM. Chem Rev. 2004;104:3587–606. doi: 10.1021/cr0304121. [DOI] [PMC free article] [PubMed] [Google Scholar]
- 2.Prestegard JH, Bougault CM, Kishore AI. Chem Rev. 2004;104:3519–40. doi: 10.1021/cr030419i. [DOI] [PubMed] [Google Scholar]
- 3.Bax A, Kontaxis G, Tjandra N. Methods Enzymol. 2001;339:127–74. doi: 10.1016/s0076-6879(01)39313-8. [DOI] [PubMed] [Google Scholar]
- 4.Garty H, Karlish SJ. Annu Rev Physiol. 2006;68:431–59. doi: 10.1146/annurev.physiol.68.040104.131852. [DOI] [PubMed] [Google Scholar]
- 5.Franzin CM, Yu J, Thai K, Choi J, Marassi FM. J Mol Biol. 2005;354:743–50. doi: 10.1016/j.jmb.2005.10.018. [DOI] [PMC free article] [PubMed] [Google Scholar]
- 6.Teriete P, Franzin CM, Choi J, Marassi FM. Biochemistry. 2007 doi: 10.1021/bi700391b. in press. [DOI] [PMC free article] [PubMed] [Google Scholar]
- 7.Franzin CM, Gong XM, Thai K, Yu J, Marassi FM. Methods. 2007;41:398–408. doi: 10.1016/j.ymeth.2006.08.011. [DOI] [PMC free article] [PubMed] [Google Scholar]
- 8.Wang J, Denny J, Tian C, Kim S, Mo Y, Kovacs F, Song Z, Nishimura K, Gan Z, Fu R, Quine JR, Cross TA. J Magn Reson. 2000;144:162–7. doi: 10.1006/jmre.2000.2037. [DOI] [PubMed] [Google Scholar]
- 9.Marassi FM, Opella SJ. J Magn Reson. 2000;144:150–5. doi: 10.1006/jmre.2000.2035. [DOI] [PMC free article] [PubMed] [Google Scholar]
- 10.Marassi FM. Biophys J. 2001;80:994–1003. doi: 10.1016/S0006-3495(01)76078-X. [DOI] [PMC free article] [PubMed] [Google Scholar]
- 11.Marassi FM, Opella SJ. Protein Sci. 2003;12:403–11. doi: 10.1110/ps.0211503. [DOI] [PMC free article] [PubMed] [Google Scholar]
- 12.Asbury T, Quine JR, Achuthan S, Hu J, Chapman MS, Cross TA, Bertram R. J Magn Reson. 2006;183:87–95. doi: 10.1016/j.jmr.2006.07.020. [DOI] [PubMed] [Google Scholar]
- 13.Clore GM, Gronenborn AM, Tjandra N. J Magn Reson. 1998;131:159–62. doi: 10.1006/jmre.1997.1345. [DOI] [PubMed] [Google Scholar]
- 14.Schwieters CD, Clore GM. J Magn Reson. 2001;152:288–302. doi: 10.1006/jmre.2001.2413. [DOI] [PubMed] [Google Scholar]
- 15.Marassi FM, Ramamoorthy A, Opella SJ. Proc Natl Acad Sci U S A. 1997;94:8551–6. doi: 10.1073/pnas.94.16.8551. [DOI] [PMC free article] [PubMed] [Google Scholar]


