Abstract
Glucocorticoid (GC) receptors (GRs) have profound anti-survival effects on human small cell lung cancer (SCLC). To explore the basis of these effects, protein partners for GRs were sought using a yeast two-hybrid screen. We discovered a novel gene, FAM33A, subsequently identified as a SKA1 partner and involved in mitosis, and so renamed Ska2. We produced an anti-peptide antibody that specifically recognized full-length human SKA2 to measure expression in human cell lines and tissues. There was a wide variation in expression across multiple cell lines, but none was detected in the liver cell line HepG2. A xenograft model of human SCLC had intense staining and archival tissue revealed SKA2 in several human lung and breast tumours. SKA2 was found in the cytoplasm, where it co-localized with GR, but nuclear expression of SKA2 was seen in breast tumours. SKA2 overexpression increased GC transactivation in HepG2 cells while SKA2 knockdown in A549 human lung epithelial cells decreased transactivation and prevented dexamethasone inhibition of proliferation. GC treatment decreased SKA2 protein levels in A549 cells, as did Staurosporine, phorbol ester and trichostatin A; all agents that inhibit cell proliferation. Overexpression of SKA2 potentiated the proliferative response to IGF-I exposure, and knockdown with shRNA caused cells to arrest in mitosis. SKA2 has recently been identified in HeLa S3 cells as part of a complex, which is critical for spindle checkpoint silencing and exit from mitosis. Our new data show involvement in cell proliferation and GC signalling, with implications for understanding how GCs impact on cell fate.
Introduction
Glucocorticoids (GC) act through the GC receptor (GR), a member of the nuclear receptor superfamily of ligand-regulated transcription factors (Hollenberg et al. 1985, Weinberger et al. 1985, 1987, Perlmann & Evans 1997, Margolis et al. 2005, Bookout et al. 2006). On activation, the GR is capable of both upregulating and downregulating target gene expression (Ray et al. 1999). The final functional effect of activated GR in a given cell is critically determined by its interactions with a spectrum of co-modulator proteins (Lonard et al. 2004, O'Malley 2004, Wu et al. 2005). Several canonical nuclear receptor interaction motifs are well recognized, including LxxLL and LIM domains (Cheskis et al. 2003, Kassel et al. 2004), but in addition, other interacting partners do not have defined peptide motifs, e.g. RelA (Nissen & Yamamoto 2000, Garside et al. 2004). While the co-modulator families primarily alter the amplitude of the GR effect, e.g. steroid receptor coactivator 1; (SRC1; Stevens et al. 2003), other GR-interacting proteins are responsible for mediating GR action, e.g. activator protein 1 (AP-1; Gottlicher et al. 1998).
GCs are widely used in the initial treatment of patients with lung cancer, primarily for their anti-emetic and anti-inflammatory effects, but direct anti-tumour action has also been proposed (Sommer et al. 2007). They have profound inhibitory effects on cell cycle progression and cell proliferation in human lung cancer cell lines (Hofmann et al. 1995). GCs, such as dexamethasone (Dex), have also been shown to have anti-tumourigenic effects in mouse models of lung cancer (Witschi et al. 2005). The mode of action in this model is unclear but it is thought that GCs affect cell differentiation. Alternatively, GCs may be acting in the lung cancer models by inhibiting cell proliferation, given their effects in human lung cancer cells (Hofmann et al. 1995). We have characterized small cell lung carcinoma (SCLC) cells that are deficient in GR expression and resistant to GC action (Ray et al. 1994, Hofmann et al. 1995, Sommer et al. 2007). Importantly, overexpression of the GR in these cells powerfully induced apoptosis (Sommer et al. 2007), suggesting that acquisition of GC resistance is a survival mechanism for human SCLC (Sommer et al. 2007). Thus, the GR is a potentially informative node for novel pathogenic mechanisms in lung cancer.
Our aim was to find novel GR-interacting proteins expressed in the well-characterized SCLC cells, which could provide new insights into the cellular mechanisms associated with their proliferative potential. Using a yeast two-hybrid screen we identified a specific interaction between GR and FAM33A, which has recently been identified as SKA2, a conserved protein involved in the kinetochore complex (Hanisch et al. 2006). Depletion of SKA2 by small interfering RNAs causes the cells to be suspended in a metaphase-like state. This delays the exit from mitosis and the onset of anaphase. From this, the authors propose that the SKA complex is required for stabilizing kinetochore-microtubule attachments and/or checkpoint silencing.
The studies presented here on the identification of SKA2 in human tumour cell lines, its interaction with the GR and the impact of depletion of SKA2 on apoptotic- and proliferation-associated genes suggest SKA2 may play a role in regulation of lung cancer cell proliferation.
Materials and Methods
Compounds
Dex, phorbol 12-myristate 13-acetate, Forskolin, trichostatin A (TSA) and insulin-like growth factor-I (IGF-I) were from Sigma–Aldrich; mifepristone (RU486) was from Affinity Bioreagents; Staurosporine was purchased from Calbiochem (Darmstadt, Germany).
Cell culture
The human lung epithelial carcinoma cell line, A549, the human liver carcinoma cell line, HepG2, 3T3L1 adipocyte cells and the human embryonic kidney cell line, HEK293, were obtained from ECACC (Porton Down, UK). A549, HEK293 and 3T3-L1 cells were maintained in Dulbecco's modified Eagle's medium (DMEM) with 10% foetal calf serum (FCS). HepG2 liver carcinoma cells were maintained in Minimum Essential Medium (Eagle) containing Earl's salts supplemented with 10% FCS and 1% non-essential amino acids. CORL103, CORL24 and DMS79 cells were derived from histologically confirmed bronchiogenic SCLC (Pettengill et al. 1980, Baillie-Johnson et al. 1985). SCLC cells were cultured in RPMI 1640 medium (Sigma–Aldrich), supplemented with 2·5% FCS and 10 mM HEPES (Ray et al. 1994, 1996a). CEM-7A cells were obtained from Dr Ged Brady (EpiStem Ltd, Manchester, UK) and maintained in RPMI 1640 medium supplemented with Glutamax (Invitrogen) and 10% FCS (Alourfi et al. 2005). Rat-1 cells were obtained from ATCC and maintained in high glucose DMEM supplemented with Glutamax (Invitrogen) and 10% FCS. AtT20 cells were obtained from ECCAC and were cultured as described (Ray et al. 1996b).
All cells were cultured in normal growth medium supplemented with 10% charcoal dextran-stripped FCS (HyClone, Logan, UT, USA) before treatment with Dex.
Yeast two-hybrid screen
The yeast two-hybrid screen has been reported before (Garside et al. 2006).
DNA constructs
The pcDNA3GR plasmid has been previously described (Ray et al. 1999). The TAT3-luc plasmid was a kind gift from Prof. Keith Yamamoto and Dr Jorge Iniguez-Lluhi (Department of Cellular and Molecular Pharmacology, University of California, San Francisco) (Iniguez-Lluhi et al. 1997). The cMyc-SKA2 construct contained the open reading frame inserted into the N-terminal cMyc tagged vector cytomegalovirus (CMV)-Tag3B (Stratagene). A GST-SKA2 fusion plasmid was made by inserting SKA2 cDNA into the pGEX-5X-1 vector (Amersham Pharmacia Biotech).
SKA2 shRNA vectors were made using the vector pSUPER (Oligoengine, Seattle, WA, USA). Sense and antisense oligonucleotide sequences were made (MWG Biotech AG, London, UK). Knockdown sequence: 5′-GATCCCCGGCTGGAATATGAAATCAATTCAAGAGATTGATTTCATATTCCAGCCTTTTTCGAAA-3′ and scrambled bp control: 5′-GATCCCCTTCTCCGAACGTGTCACGTTTCAAGAGAACGTGACACGTTCGGAGAATTTTTCGAAA-3′.
BglII and HindIII restriction sites added to the sequences were used for subsequent ligation into pSUPER. The oligonucleotides were annealed by adding 3 μg of each into 48 μl annealing buffer (100 mM sodium chloride, 50 mM HEPES (pH 7·4)). The mixture was then incubated at 90 °C for 4 min, followed by 70 °C for 10 min. The mixture was then slowly cooled to 10 °C. The shRNA sequences were then ligated into pSUPER using T4 DNA ligase (Roche).
Interaction between Ska2 and GR in vitro
GST and GST-SKA2 were expressed in Escherichia coli strain DH5α (Promega Corp.) and were purified as described (Stevens et al. 2003).
Western blotting
Cells were lysed using 1× RIPA buffer (100 mM Tris base, 150 mM NaCl, 1% Igepal, 2·5% sodium deoxycholate, 1 mM EDTA) and tissues lysed using a modified RIPA buffer (50 mM Tris–HCl, 150 mM NaCl, 1% Triton X-100, 1% sodium deoxycholate, 1 mM EDTA, 0·1% SDS). Both buffers contained protease inhibitors (Complete, Roche Molecular Biochemicals). Cell and tissue extracts were analysed by SDS-PAGE and western blotting using the following primary antibodies: 1:1000 SKA2 rabbit polyclonal antibody (raised to the predicted amino acid sequence) or 1:2000 mouse monoclonal α-tubulin (DM1A, Sigma–Aldrich Ltd). The specificity of the 14 kDa band detected using SKA2 antibody (see above) was confirmed using SKA2-specific blocking peptides, antibody was incubated with a fivefold excess, by weight, of the immunogenic peptide overnight at 4 °C in 1% milk blocking buffer.
Immunofluorescence
HEK293 cells infected with a GR-eYFP-expressing retrovirus and A549 cells were grown on coverslips and treated with either DMSO (vehicle), Dex (100 nM) or RU486 (100 nM) for 1 h. The cells were washed with 1× PBS and fixed with 4% paraformaldehyde. Human lung tissue was obtained from the North West Lung Centre, Medicines Evaluation Unit, Wythenshawe Hospital, Manchester, UK. After fixation with 4% paraformaldehyde, tissue sections and cells were permeabilized with TD buffer (10 mM Tris–HCl (pH 8·0) and 50 mM NaCl) and blocked with TD buffer containing 1% BSA and 0·2% Triton X-100. A 1:400 dilution of SKA2 anti-peptide antibody (see above) in washing buffer (TD buffer plus 1% BSA and 0·05% Triton X-100) was added for 2 h at room temperature. Images were taken using a Bio-Rad MRC1024 confocal scanning Microscope, as previously described (Garside et al. 2006).
Quantification of nuclear/cytoplasmic staining
HEK293 cells from triplicate slides of three separate experiments were scored for nuclear and cytoplasmic localization of both Texas Red-conjugated proteins and eYFP-tagged proteins. Treated and untreated cells were assigned ‘predominantly cytoplasmic’ (C) or ‘predominantly nuclear’ (N) for both SKA2 and GR-eYFP by a masked observer. These numbers were expressed as a percentage of the total cell number.
Generation of stable cell lines
The cMyc-SKA2 plasmid DNA was linearized and transfected using FuGENE 6 (Roche). Cells were incubated with 1 mg/ml G418 sulphate. After 2 weeks discrete colonies formed, which were cloned and screened for gene expression by western blot.
To create stable cell lines expressing shRNA, cells were co-transfected using FuGENE 6 (Roche) with the appropriate pSUPER vector and the vector pcDNA3 (to confer G418 resistance to the cell). After 48 h transfection, the growth medium of the cells was supplemented with 1 mg/ml G418 (Calbiochem). Colonies were selected and expanded under G418 selection.
Reporter gene studies
Cells were transfected with the TAT3-luc reporter gene and analysed as previously described (Stevens et al. 2003, Garside et al. 2004, 2006).
Proliferation assays
Cells were seeded in 96-well plates and treated as indicated. Cell number was estimated using the MTS reagent (American Tissue Culture Collection) or measured by haemocytometer.
Immunohistochemistry of human lung cancer
Human SCLC xenografts were obtained by innoculating 108 DMS 79 cells with Matrigel (1:1) subcutaneously in the flank of athymic, nude mice. In addition, a panel of human lung cancer and malignant mesotheliomas from biopsy tissue surplus to requirements for clinical diagnosis was obtained from patients at Manchester Royal Infirmary and Wythenshawe Hospital, who had placed no restriction on the use of surplus tissue when consented for biopsy or resection of tumour. At least six separate sections were analysed for each tumour type. SKA2 staining was quantitated in triplicate sections of a panel of lung carcinomas using a colour card (0–3 for intensity) compared against a ‘no primary’ control by a masked observer. Data were averaged across the triplicates and expressed as intensity from 0 to 3 for each type of carcinoma.
Staining of mitotic cells
Cells were grown overnight on coverslips and mounted in 4′,6-diamidino-2-phenylindole-containing mounting medium (Vectashield, Vector Laboratories Ltd, Peterborough, UK). Quantification of mitotic figures was performed using fluorescent microscopy (excitation and emission at 360 and 460 nm respectively), a field of 100 cells was counted and the percentage of cells undergoing mitosis was calculated.
Breast array
The human breast tissue array has been described previously (Zhu et al. 2006). Detection of FAM33A expression followed the standard immunoperoxidase approach. Analysis was done by a masked observer and statistical comparison by χ2-test.
RNAi
Short interfering siRNAs specific to SKA2 were custom designed using the HiPerformance algorithm (Novartis Pharmaceuticals) and synthesized (Qiagen Ltd). Sequences are available on request.
Microarray and data analysis
Labelled cDNA was hybridized to HG-U133 PLUS2 oligonucleotide arrays (Affymetrix, Santa Clara, CA, USA). Technical quality control of the arrays was done to check for outliers using dChip software (Li & Wong 2001). Normalization and expression analysis used robust multiple array average (RMA; Bolstad et al. 2003). Since off-target effects can be expected in siRNA experiments, two independent siRNAs were used. Each experiment was done in duplicate. Statistical analysis was performed by comparing non-silencing control with the combined siRNA samples group with limma (Smyth 2004). False discovery rate correction was performed with QVALUE (Storey et al. 2004). Post-analysis was performed using the MAPPFinder Gene Ontology tool of GenMapp 2.0 software, San Francisco, CA, USA (Doniger et al. 2003), DAVID Bioinformatics Resources 2006 and MetaCore software (GeneGo, Inc., St Joseph, MI, USA). The microarray data were submitted in a Minimum Information About a Microarray Experiment-compliant format to the ArrayExpress database (http://www.ebi.ac.uk/arrayexpress/) and an accession number was assigned (E-MEXP-265).
siRNA sequences
The duplex sequences were as follows: siRNA #1 sense strand r(CCC ACA GAA CCU AAA GUA A)dT+dT and antisense strand r(UUA CUU UAG GUU CUG UGG G)dAdG; siRNA #3 sense strand r(GGC UGG AAU AUG AAA UCA A)dTdT and antisense strand r(UUG AUU UCA UAU UCC AGC C)dTdG; siRNA #4 sense strand r(CGA UUU AAA UAU AUG UAC A)dTdT and antisense strand r(UGU ACA UAU AUU UAA AUC G)dTdT.
A commercially available non-silencing control siRNA (Qiagen Ltd) was transfected to control for off-target effects. The sequence for the sense strand of this duplex was UUC UCC GAA CGU GUC ACG UdT dT and the antisense strand, ACG UGA CAC GUU CGG AGA AdT dT.
Statistical analysis
All additional statistical analysis was carried out using SPSS (Chicago, IL, USA) for Windows version 13.0. Specific tests are described in the figure legends.
Results
Identification of SKA2 as a GR-interacting protein
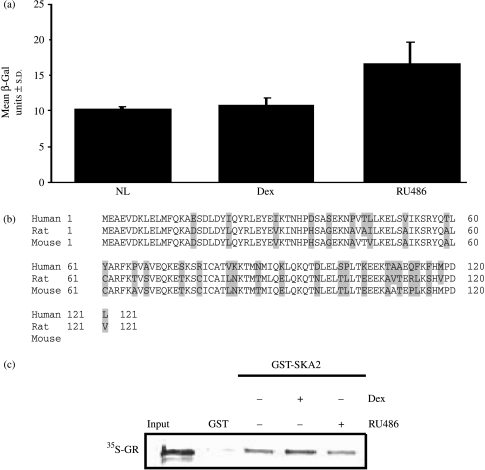
We identified SKA2 as interacting with the C-terminal domain of the GR (amino acids 525–777) in a yeast two-hybrid library generated from the human SCLC cell line CORL103. The interaction between GR and SKA2 was confirmed in re-transformed yeast cells and found to be constitutive but also seen in the presence of Dex and RU486 (Fig. 1a).
Figure 1.
SKA2 interacts with the GR in yeast and in vitro. (a) Yeast are transformed with reporter, GR ‘bait’, and library clone R59 (encoding SKA2). A single colony was selected from the stock plate and used to create liquid cultures of yeast cells. These were incubated, in triplicate, for 3 h with either vehicle (no ligand, NL), 50 mM dexamethasone (Dex) or 50 mM RU486. The cells were then lysed and incubated with CPRG substrate. Background activity in these assays was <1. (b) Evolutionary sequence comparison between human and both rat and mouse SKA2. Non-identical amino acids are highlighted. (c) Autoradiograph of a GST ‘pull down’ in which [35S]GR was incubated with GST-SKA2 or GST alone in the presence or absence of dexamethasone (50 μM) or RU486 (50 μM). The GST was pulled down and the resulting complexes resolved by SDS-PAGE. The 35S-labeled GR bound to the GST fusion protein was visualized by phosphoimaging.
SKA2 is encoded by an 831 nucleotide cDNA sequence, which derives from a four exon gene located on human chromosome 17q 23.2 and is highly conserved (Fig. 1b). There were no indications of protein function from its amino acid sequence, and no homology with known nuclear receptor co-modulators.
To confirm a direct interaction between the GR and SKA2, we used a GST pull-down approach (Stevens et al. 2003). There was a clear interaction between the two proteins, but little difference was seen in the presence of either Dex or RU486 (Fig. 1c), as predicted from the yeast studies.
Development of an antibody and analysis of endogenous SKA2 expression
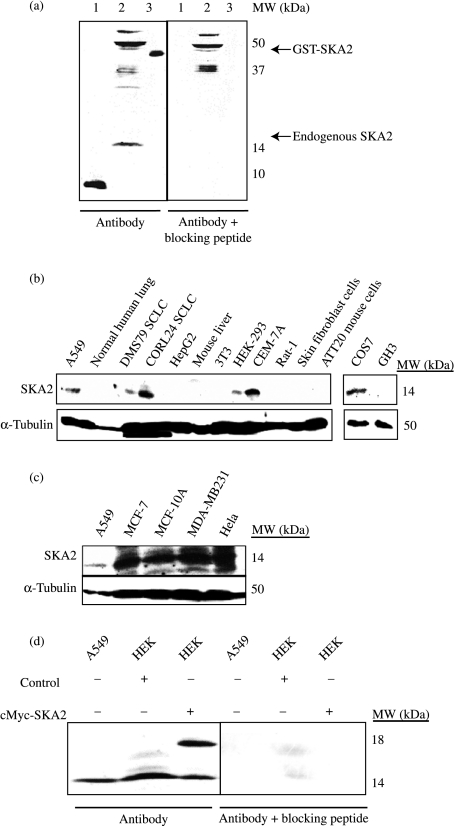
We raised a specific rabbit antibody to human SKA2 (Fig. 2a). SKA2 protein was detected in both human SCLC and NSCLC cells as well as other human cell lines, but strikingly not in the human liver cell line HepG2 (Fig. 2b). Further immunoblot analysis revealed SKA2 expression in several breast cancer cell lines and in HeLa cells (Fig. 2c). When cmyc-SKA2 was transfected into HEK cells, both endogenous and transfected forms of SKA2 were detected (Fig. 2d).
Figure 2.
SKA2 is a 14 kDa protein expressed in SCLC and non-SCLC cell lines. (a) Western blot showing SKA2 protein expression using novel anti-peptide antibody. The SKA2 immunogenic peptide (lane 1), endogenous SKA2 in A549 cell lysate (lane 2), and recombinant bacterially expressed GST-SKA2 (lane 3) were detected as bands of 8, 14 and 42 kDa, as predicted. Peptide-blocked antibody controls are also shown, as indicated. (b) Western blot showing SKA2 expression in cell lines and tissues. A549 human non-SCLC cells, normal human lung tissue, DMS79 human SCLC cells, CORL24 human SCLC cells, HepG2 human liver carcinoma cells, mouse liver tissue, 3T3L1 mouse fibroblast cells, HEK293 human embryonic kidney cells, CEM-7A human T-lymphoblast cells, Rat-1 rat fibroblast cells, primary human skin fibroblast cells, AtT20 mouse pituitary cells, COS7 transformed monkey kidney fibroblast cells and GH3 rat pituitary cells. (c) Western blot showing SKA2 expression in human breast cancer cell lines MCF-7, MCF-10A and MDA-MB231, by comparison with A549 and HeLa cells. (d) SKA2 protein expression in A549 and HEK293 cells transfected with empty expression vector (control) and with cmyc-SKA2. Endogenous SKA2 is a 14 kDa protein and the exogenous cMyc-SKA2 is an 18 kDa protein.
Expression of SKA2 in human lung and breast carcinomas
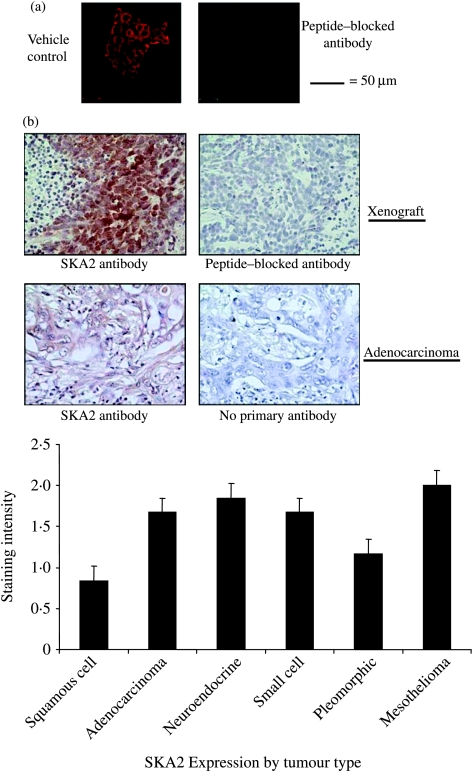
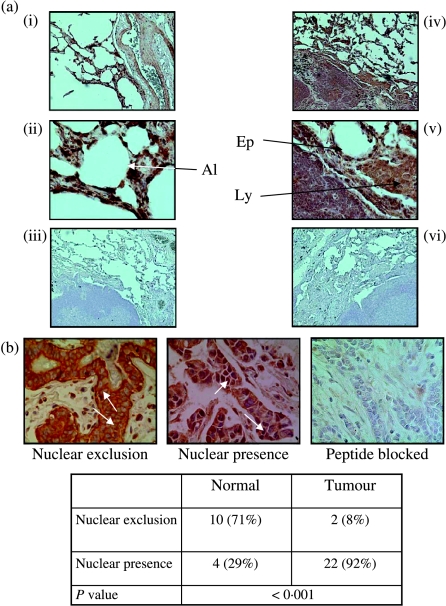
Immunofluorescence localized SKA2 mainly to the cytoplasm of the NSCLC cell line, A549 (Fig. 3a). Expression of SKA2 was also seen in human SCLC xenografts (Fig. 3b) and in a resected human lung adenocarcinoma. SKA2 was also detected in a selection of primary human lung cancers of different histological types. However, using the more sensitive immunoperoxidase technique, expression of SKA2 was also seen in non-tumourous human lung recovered from the resection margins of surgical specimens (Fig. 4a).
Figure 3.
Expression of SKA2 in lung cancer. (a) Immunofluoresence analysis of SKA2 in A549 cells under basal and treatment conditions as indicated. (b) Immunoperoxidase staining of SKA2 in human SCLC xenografts in athymic mice and primary human lung adenocarcinoma. Antibody controls (antibody blocked with peptide and no primary) are presented, as indicated. Graph shows small-scale pilot analysis of SKA2 expression in six primary human lung cancers. At least eight sections from each tumour were scored by a masked observer against a colour card (0–3 for intensity).
Figure 4.
Expression of SKA2 in normal human lung tissue and normal and tumour sections from a breast tissue array. (a) Immunoperoxidase staining of SKA2 in normal human lung at (i and iv) low power, (ii and v) high power and (iii and vi) peptide adsorbed controls. Expression is seen in epithelium (Ep), alveolar structures (Al) and lymphoid follicles (Ly). (b) Immunostaining for SKA2 showed cytoplasmic staining with nuclear exclusion predominantly in normal tissue. Staining in both the nucleus and cytoplasm was evident in many tumour samples. The peptide adsorbed control is shown.
As high-level SKA2 expression was seen in breast cancer cell lines, expression was sought in a breast tissue array. Expression of SKA2 was easily detected and specificity was ensured by using peptide adsorbed controls (Fig. 4b). As with the lung cancer tissue samples, expression of SKA2 was found in both normal and cancerous breast (Fig. 4b) with similar expression levels (mean intensity: 2·5 for cancers and 2·4 for normal; P=0·67). However, there was a striking difference in the intracellular distribution of the SKA2 between normal and tumour tissue, with a greater proportion of the tumour cells having nuclear SKA2 when compared with the normal breast (P<0·001).
Intracellular localization of SKA2 and GR in HEK293 cells
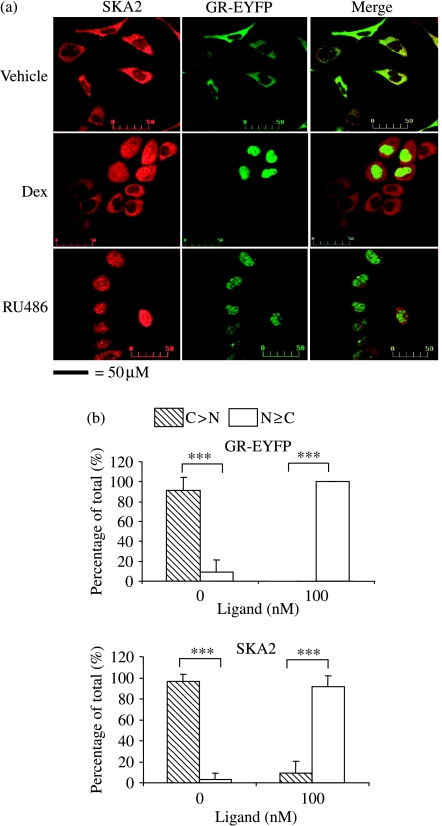
As the distribution of SKA2 within cells appeared to be different in normal and tumour cells, we studied its localization in relation to that of the GR. We stained for SKA2 expression using our antibody in HEK293 cells infected with a GR-eYFP-expressing retrovirus and analyzed untreated and treated cells by immunofluorescence. GR was cytoplasmic under basal conditions and both Dex, an agonist, and RU486, an antagonist, promoted nuclear translocation of the GR, as expected (Fig. 5a and b). SKA2 was also cytoplasmic under basal conditions, showing co-localization with GR (Fig. 5a) However, in ligand-treated cells expressing high levels of transgenic GR, there was also nuclear translocation of SKA2, further supporting an interaction between the two proteins (Fig. 5).
Figure 5.
SKA2 co-localizes with GR and moves to the nucleus in Dex-treated cells. (a) Immunofluorescence of HEK293 cells stably expressing GR-eYFP, which were treated with vehicle, Dex (100 nM) or RU486 (100 nM) as indicated, for 1 h before fixation. The cells were stained for SKA2 using the anti-peptide antibody, with and without peptide-blocking and a Texas Red-conjugated secondary antibody. (b) Quantification of SKA2 and GR-EYFP cytoplasmic and nuclear distribution. Cells expressing the GR-eYFP were selected for analysis. A total of 46 untreated cells and 101 treated cells from three separate experiments were assigned ‘predominantly cytoplasmic’ (C) or ‘predominantly nuclear’ (N) for both SKA2 and GR-EYFP by a masked observer. Statistical analysis used ANOVA followed by Tukey–Kramer post hoc test, ***P<0·001.
SKA2 modulates GR function
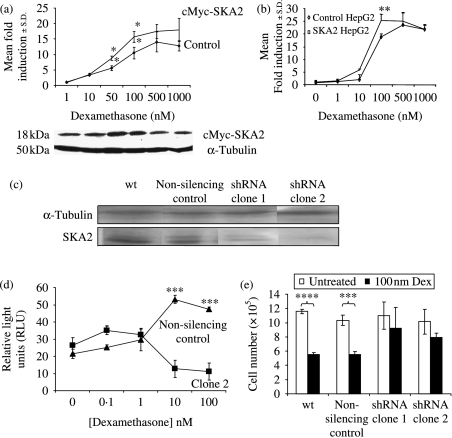
The effects of SKA2 on GR function were determined by expressing SKA2 in the SKA2 null, HepG2 cells. Both transient co-transfection of SKA2 with a reporter gene (Fig. 6a) and introduction of the reporter to the cells stably overexpressing SKA2 (Fig. 6b) resulted in potentiation of GC transactivation.
Figure 6.
SKA2 effects on glucocorticoid function. (a) HepG2 cells were transiently transfected with SKA2, a TAT3-luc reporter gene and a CMV-renilla control plasmid and then treated in triplicate with a range of concentrations of dexamethasone for 16 h before harvest, and luciferase assay. Corrected luciferase values were obtained and expressed relative to the vehicle-treated control. Statistical analysis used ANOVA followed by Tukey–Kramer post hoc test, **P<0·01. Results are representative of three experiments. Expression of exogenous cMyc-SKA2 (18 kDa) is shown in inset immunoblot. (b) SKA2 was stably overexpressed in HepG2 cells and the cells were then transiently transfected with TAT3-luc and treated with dexamethasone in triplicate as above, **P<0·01. Results are representative of three experiments. (c) SKA2 protein expression in wild-type A549 cells (wt), a clone stably expressing the non-silencing control shRNA (non-silencing control) and two clones stably expressing the SKA2 shRNA. Clone1 displayed intermediate expression levels of SKA2 and clone 2 showed low levels of expression, α-tubulin was used as a loading control. (d) A549 cell clones expressing clone 2 (low SKA2 expression) or a non-silencing control was transfected with the TAT3-luciferase reporter construct. After 24 h, cells were exposed to a range of dexamethasone concentrations for a further 24 h. Results were normalized against a renilla control. Graph shows mean of n=3±s.e.m. and analyzed by ANOVA followed by Bonferroni post hoc test, ***P<0·001. Results are representative of two independent transfection experiments. (e) Effect of dexamethasone (100 nM) on total cell number in A549 cells was assessed after 5 days of growth. Graph shows average of three separate counts±s.e.m. Treatments compared using t-test, ****P<0·0001, ***P=0·004. Results are representative of two separate experiments, and two further experiments were assessed by MTS.
Further examination of the effects of SKA2 on GR function utilized knockdown of SKA2 by stable expression of shRNA in A549 cells (which we have shown to express SKA2 protein, Fig. 2). This generated clones expressing shRNA with either moderate (clone1) or low (clone 2) residual expression of SKA2 (Fig. 6c). Knockdown of SKA2 (in clone 2) reversed the GC-stimulated transactivation of the TAT3-luciferase reporter, when compared with the effect in the non-silencing control (Fig. 6d).
We also examined the effect of SKA2 on GC regulation of cell proliferation. Dex (100 nM) inhibited proliferation in A549 cells by 50%. In clones with moderate (clone 1) and low (clone 2) expression of SKA2, the effect of Dex was abolished (Fig. 6e). Importantly, there was no effect of altered SKA2 expression on basal proliferation.
Regulation of SKA2 expression
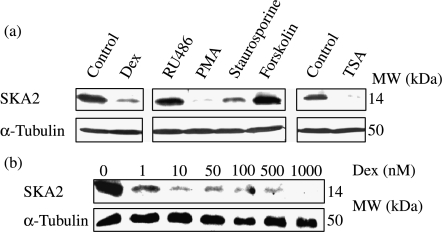
Analysis of the SKA2 gene locus did not suggest how its expression was regulated. Therefore, A549 cells were treated with a panel of agents known to affect cell survival or proliferation. We examined the effects of the various compounds on SKA2 protein expression by immunoblot. This revealed marked inhibition of SKA2 expression by Dex, Staurosporine, phorbol ester and TSA, all of which either induce apoptosis or inhibit cell proliferation in A549 cells (Fig. 7).
Figure 7.
Regulation of FAM33A/SKA2. (a) Western blot of SKA2 expression in A549 cells treated with dexamethasone (100 nM), RU486 (100 nM), PMA (0·1 μM), Staurosporine (20 nM), Forskolin (1 μM), TSA (HDAC inhibitor) (0·5 μM) and the respective vehicle controls for 18 h. (b) Western blot showing concentration response of SKA2 regulation by dexamethasone (Dex). Results are representative of three separate experiments.
SKA2 potentiates cell proliferation
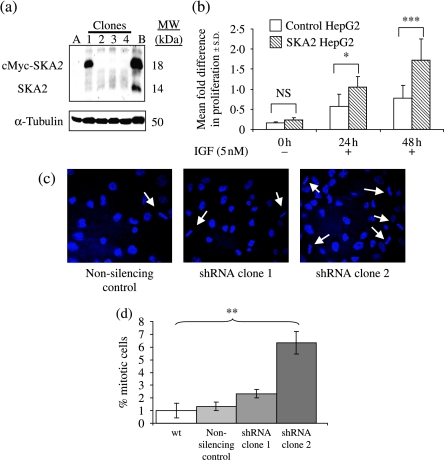
To determine the effect of SKA2 on cell proliferation, a non-expressing cell line, HepG2 (Fig. 2), was transfected with a SKA2 expression cassette and stable clones were selected (Fig. 8a). The SKA2-expressing clone had a significantly enhanced proliferative response at 24 h post-IGF-I and a nearly twofold increase in proliferation at 48 h, compared with control, but there were no significant differences seen under non-stimulated conditions (Fig. 8b).
Figure 8.
SKA2 affects cell proliferation and mitosis. (a) Western blot showing stable expression of cMyc-SKA2 in HepG2 cells. SKA2-null HepG2 cells were transfected with cMyc-SKA2, clones were selected using neomycin and screened for cMyc-SKA2 expression by immunoblot. Clones 1–4 are presented; clone 1 expressed SKA2. A, parental HepG2 cells; B, HEK293 cells transiently transfected with cMyc-SKA2. Migration of the endogenous SKA2 in HEK cells and the transgenic myc-tagged SKA2 is marked. (b) MTT cell proliferation assay. Cells from clone 1 and non-expressing clone 4 were serum starved for 24 h before treatment with 5 nM IGF-I in triplicate. Cells were assayed after both 24 and 48 h. Statistical analysis used ANOVA followed by Tukey–Kramer post hoc test, *P=0·02, ***P=0·0001. Results are representative of two experiments. (c) Mitotic figures. A549 clones expressing shRNA to SKA2 and non-silencing control were grown overnight on coverslips and mounted in DAPI-containing mounting medium; arrows indicate mitotic cells. (d) Quantification of mitotic figures. The percentage of cells undergoing mitosis was calculated from a field of 100 cells. Graph shows average of three separate counts±s.e.m; t-test was used with Bonferroni correction for multiple comparisons. Wild-type compared with clone 2, **P=0·021; other comparisons with wild-type were non-significant.
Knockdown of SKA2 in A549 cells caused cells to be held in mitosis (Fig. 8c) as evidenced by the percentage of increase in mitotic figures when compared with the non-silencing control (Fig. 8d).
Gene array profiling of SKA2 function
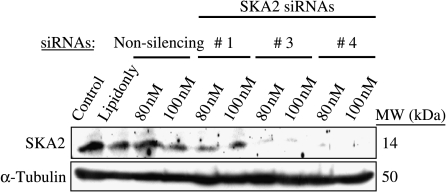
Initial studies identified specific siRNA sequences that potently inhibited SKA2 protein expression. Two separate sequences were sought to allow additional refinement in the post-array analysis (Fig. 9). For post-analysis purposes, a relatively lenient q value threshold of 0·2 produced 119 probe sets that were specifically and significantly regulated by both SKA2-specific siRNAs. Of these genes, SKA2 was itself downregulated eightfold.
Figure 9.
Two effective siRNA molecules targeting SKA2 were identified and used in microarray analysis to compare the transcriptional changes between wild-type A549 cells and A549 cells transfected with SKA2 siRNA molecules. Three SKA2-specific siRNAs were transiently transfected into cells at the concentrations shown. Two of the siRNAs showed greater than 80% SKA2 knockdown at 24 h (numbers 3 and 4). These two were used in the microarray analysis summarized in Table 1.
These genes were analysed for enrichment of Gene Ontology categories with GennMAPP (Doniger et al. 2003), DAVID (Sherman et al. 2007) and MetaCore (GeneGo, Inc.) softwares. We found that SKA2 knockdown in A549 cells resulted in coordinate regulation of a pattern of genes including gene products known to be involved in cell cycle, apoptosis and signalling (Table 1).
Table 1.
Genes regulated by SKA2 knockdown involved in cell cycle, apoptosis and signalling (SKA2 result included). Genes found to be significantly up- or downregulated in response to ‘knockdown’ of SKA2 expression by specific siRNA. Statistical significance is indicated by q value
| Entrez gene | Probe set ID | Fold change | q value | Gene title | |
|---|---|---|---|---|---|
| Gene symbol | |||||
| Downregulated | |||||
| SKA2 | 348 235 | 225684_at | −8·7 | 0·044 | Family with sequence similarity 33, member A |
| ABCA1 | 19 | 203504_s_at | −2·9 | 0·033 | ATP-binding cassette, sub-family A (ABC1), member 1 |
| PPP2R1B | 5519 | 202883_s_at | −2·6 | 0·110 | Protein phosphatase 2 (formerly 2A), regulatory subunit A, β isoform |
| CCL2 | 6347 | 216598_s_at | −2·5 | 0·143 | Chemokine (C-C motif) ligand 2 |
| IL6ST | 3572 | 204863_s_at | −2·2 | 0·110 | Interleukin 6 signal transducer (gp130, oncostatin M receptor) |
| PPP2CA | 5515 | 238719_at | −2·1 | 0·148 | Protein phosphatase 2 (formerly 2A), catalytic subunit, α isoform |
| BMP2K | 55 589 | 226853_at | −2·0 | 0·090 | BMP2 inducible kinase |
| EMR1 | 2015 | 207111_at | −2·0 | 0·185 | EGF-like module containing, mucin-like, hormone receptor-like 1 |
| SOCS3 | 9021 | 227697_at | −1·9 | 0·198 | Suppressor of cytokine signalling 3 |
| LRP12 | 29 967 | 220254_at | −1·9 | 0·143 | Low density lipoprotein-related protein 12 |
| RGS17 | 26 575 | 220334_at | −1·9 | 0·110 | Regulator of G-protein signalling 17 |
| WWTR1 | 25 937 | 202132_at | −1·6 | 0·159 | WW domain containing transcription regulator 1 |
| WWTR1 | 25 937 | 202133_at | −1·5 | 0·166 | WW domain containing transcription regulator 1 |
| Upregulated | |||||
| NOVA1 | 4857 | 205794_s_at | 1·5 | 0·185 | Neuro-oncological ventral antigen 1 |
| COL4A4 | 1286 | 214602_at | 1·6 | 0·159 | Collagen, type IV, α 4 |
| UNC5D | 137 970 | 231325_at | 1·7 | 0·169 | Unc-5 homolog D (C. elegans) |
| IGFBPL1 | 347 252 | 227760_at | 1·8 | 0·193 | IGF-binding protein-like 1 |
| GRB10 | 2887 | 209409_at | 1·8 | 0·169 | Growth factor receptor-bound protein 10 |
| G3BP2 | 9908 | 208841_s_at | 1·8 | 0·159 | GTPase activating protein (SH3 domain) binding protein 2 |
| PHACTR2 | 9749 | 227947_at | 1·8 | 0·159 | Phosphatase and actin regulator 2 |
| AI831506 (Refseq) | – | 226520_at | 2·0 | 0·091 | Primary neuroblastoma cDNA, clone:Nbla11485 |
| NOLC1 | 9221 | 211951_at | 2·2 | 0·088 | Nucleolar and coiled-body phosphoprotein 1 |
| CASP7 | 840 | 207181_s_at | 2·5 | 0·159 | Caspase 7, apoptosis-related cysteine peptidase |
| MESDC2 | 23 184 | 224675_at | 4·2 | 0·021 | Mesoderm development candidate 2 |
Discussion
As part of a genetic screen for GR-interacting proteins in SCLC we identified SKA2. During our characterization of SKA2, it was independently discovered as part of a complex involved in mitosis (Hanisch et al. 2006). SKA2 is required for assembly of condensed chromosomes on the metaphase plate (Hanisch et al. 2006). This, in turn, regulates the spindle checkpoint which on silencing, allows the exit from metaphase and the onset of anaphase. SKA2 protein requires SKA1, a protein binding partner, for stability, and SKA2 is required for correct assembly of SKA1 on the kinetochore. When cells were depleted of SKA proteins there was a marked delay in progress through mitosis, implying failure to silence the spindle checkpoint. This suggests that the SKA proteins have a role in regulating progression through mitosis.
We found SKA2 expression not only in multiple human lung cancer and breast cancer cell lines and primary tumours, but also in normal lung and breast tissue. HepG2 cells expressed no detectable SKA2 protein, demonstrating that high-level SKA2 expression is not a universal feature of transformed cells. Given that we and others (Hanisch et al. 2006) have found SKA2 in the cytoplasm of interphase cultured cells, it is interesting to note that there was markedly higher nuclear localization of SKA2 in breast cancer than normal breast tissue.
Unexpectedly, we found that in cells overexpressing a GR construct, there was partial SKA2 translocation to the nucleus following GC treatment. This suggests that there may be functional interaction between the two proteins in the cytoplasm and that SKA2, which lacks a nuclear localization domain, is being ‘drawn’ into the nucleus by the movement of GR. However, this effect appears to require overexpression of GR to be seen clearly. This suggests that under particular conditions, as seen in breast cancer or GR overexpression, the nuclear exclusion of SKA2 in interphase is lost, with possible consequences for cell proliferation or survival.
As SKA2 was found to interact with the GR, its effect on GR transactivation function was sought. Overexpressed SKA2 resulted in modest enhancement of GR transactivation, while knockdown of SKA2 markedly inhibited GR transactivation. This supports a functional interaction between the two proteins. SKA2 also appears to have a role in GC inhibition of cell proliferation, in that, knockdown of SKA2 prevented the decrease in cell number seen with Dex treatment.
SKA2 protein expression was inhibited by agents that share anti-proliferative or pro-apoptotic actions on A549 cells. Dex had profound inhibitory effects on SKA2 expression and given that GCs are widely used in the induction phase of anti-cancer chemotherapy, this has implications for cell cycle control and appropriate chromosomal segregation, through interference with the spindle checkpoint (Hanisch et al. 2006).
To explore SKA2 function further, it was overexpressed in the SKA2 deficient cell line HepG2. This significantly enhanced proliferation following incubation with IGF-I, which suggests involvement of SKA2 in either growth factor signalling or cell survival/proliferation pathways. This is supported by knockdown of SKA2 in A549 cells, which produced an increase in cells arrested in mitosis as previously shown for HeLa S3 cells (Hanisch et al. 2006).
Cells were subjected to transcript profiling and genes were identified where expression was regulated by both SKA2 siRNAs, but not by a non-targeting siRNA. The SKA2 transcript was found in this group of genes to be markedly repressed, confirming the success of the knockdown approach. Functional grouping of identified genes using gene ontology approaches identified significant enrichment in pathways regulating cell survival, cell proliferation and also cytokine/growth factor action, as evidenced by the list of significantly regulated genes clustered in these pathways (Table 1).
To conclude, we have identified and functionally characterized a novel GR-interacting protein, which we isolated from a human SCLC cell line. It has recently been identified as SKA2, a protein involved in regulating anaphase onset in HeLa S3 cells. Our studies show that SKA2 is expressed not only in a range of cell lines but also found in human lung and breast cancer tissue. In cells overexpressing GR, treatment with GC causes SKA2 to be co-localized with the GR in the nucleus. Interestingly, SKA2 is found predominantly in the nucleus in breast tumours but in the cytoplasm in normal tissue. The impact of depletion of SKA2 on apoptotic- and proliferation-associated genes suggests that SKA2 may play a role in regulation of cancer cell proliferation.
Declaration of Interest
The authors declare that there is no conflict of interest that could be perceived as prejudicing the impartiality of the research reported.
Funding
The Wellcome Trust (D W R and A W) and MRC (I J S and B T) for funding. BBSRC studentships awarded to C W, L R and P K. D W R was supported by a Glaxo SmithKline Fellowship.
Acknowledgements
We are grateful to Dr D Singh and Dr P Hasleton for provision of lung tumours and archival tumours, and Andy Hayes and Leanne Wardleworth for microarray work.
References
- Alourfi Z, Donn RP, Stevens A, Berry A, McMaster A, Ray DW. Glucocorticoids suppress macrophage migration inhibitory factor (MIF) expression in a cell-type-specific manner. Journal of Molecular Endocrinology. 2005;34:583–595. doi: 10.1677/jme.1.01647. [DOI] [PubMed] [Google Scholar]
- Baillie-Johnson H, Twentyman PR, Fox NE, Walls GA, Workman P, Watson JV, Johnson N, Reeve JG, Bleehen NM. Establishment and characterisation of cell lines from patients with lung cancer (predominantly small cell carcinoma) British Journal of Cancer. 1985;52:495–504. doi: 10.1038/bjc.1985.220. [DOI] [PMC free article] [PubMed] [Google Scholar]
- Bolstad BM, Irizarry RA, Astrand M, Speed TP. A comparison of normalization methods for high density oligonucleotide array data based on variance and bias. Bioinformatics. 2003;19:185–193. doi: 10.1093/bioinformatics/19.2.185. [DOI] [PubMed] [Google Scholar]
- Bookout AL, Jeong Y, Downes M, Yu RT, Evans RM, Mangelsdorf DJ. Anatomical profiling of nuclear receptor expression reveals a hierarchical transcriptional network. Cell. 2006;126:789–799. doi: 10.1016/j.cell.2006.06.049. [DOI] [PMC free article] [PubMed] [Google Scholar]
- Cheskis BJ, McKenna NJ, Wong CW, Wong J, Komm B, Lyttle CR, O'Malley BW. Hierarchical affinities and a bipartite interaction model for estrogen receptor isoforms and full-length steroid receptor coactivator (SRC/p160) family members. Journal of Biological Chemistry. 2003;278:13271–13277. doi: 10.1074/jbc.M211031200. [DOI] [PubMed] [Google Scholar]
- Doniger SW, Salomonis N, Dahlquist KD, Vranizan K, Lawlor SC, Conklin BR. MAPPFinder: using Gene Ontology and GenMAPP to create a global gene-expression profile from microarray data. Genome Biology. 2003;4:R7. doi: 10.1186/gb-2003-4-1-r7. [DOI] [PMC free article] [PubMed] [Google Scholar]
- Garside H, Stevens A, Farrow S, Normand C, Houle B, Berry A, Maschera B, Ray D. Glucocorticoid ligands specify different interactions with NF-kappaB by allosteric effects on the glucocorticoid receptor DNA binding domain. Journal of Biological Chemistry. 2004;279:50050–50059. doi: 10.1074/jbc.M407309200. [DOI] [PubMed] [Google Scholar]
- Garside H, Waters C, Berry A, Rice L, Ardley HC, White A, Robinson PA, Ray D. UbcH7 interacts with the glucocorticoid receptor and mediates receptor autoregulation. Journal of Endocrinology. 2006;190:621–629. doi: 10.1677/joe.1.06799. [DOI] [PubMed] [Google Scholar]
- Gottlicher M, Heck S, Herrlich P. Transcriptional cross-talk, the second mode of steroid hormone receptor action. Journal of Molecular Medicine. 1998;76:480–489. doi: 10.1007/s001090050242. [DOI] [PubMed] [Google Scholar]
- Hanisch A, Sillje HH, Nigg EA. Timely anaphase onset requires a novel spindle and kinetochore complex comprising Ska1 and Ska2. EMBO Journal. 2006;25:5504–5515. doi: 10.1038/sj.emboj.7601426. [DOI] [PMC free article] [PubMed] [Google Scholar]
- Hofmann J, Kaiser U, Maasberg M, Havemann K. Glucocorticoid receptors and growth inhibitory effects of dexamethasone in human lung cancer cell lines. European Journal of Cancer. 1995;31A:2053–2058. doi: 10.1016/0959-8049(95)00431-9. [DOI] [PubMed] [Google Scholar]
- Hollenberg SM, Weinberger C, Ong ES, Cerelli G, Oro A, Lebo R, Thompson EB, Rosenfeld MG, Evans RM. Primary structure and expression of a functional human glucocorticoid receptor cDNA. Nature. 1985;318:635–641. doi: 10.1038/318635a0. [DOI] [PMC free article] [PubMed] [Google Scholar]
- Iniguez-Lluhi JA, Lou DY, Yamamoto KR. Three amino acid substitutions selectively disrupt the activation but not the repression function of the glucocorticoid receptor N terminus. Journal of Biological Chemistry. 1997;272:4149–4156. doi: 10.1074/jbc.272.7.4149. [DOI] [PubMed] [Google Scholar]
- Kassel O, Schneider S, Heilbock C, Litfin M, Gottlicher M, Herrlich P. A nuclear isoform of the focal adhesion LIM-domain protein Trip6 integrates activating and repressing signals at AP-1- and NF-kappaB-regulated promoters. Genes and Development. 2004;18:2518–2528. doi: 10.1101/gad.322404. [DOI] [PMC free article] [PubMed] [Google Scholar]
- Li C, Wong WH. Model-based analysis of oligonucleotide arrays: expression index computation and outlier detection. PNAS. 2001;98:31–36. doi: 10.1073/pnas.011404098. [DOI] [PMC free article] [PubMed] [Google Scholar]
- Lonard DM, Tsai SY, O'Malley BW. Selective estrogen receptor modulators 4-hydroxytamoxifen and raloxifene impact the stability and function of SRC-1 and SRC-3 coactivator proteins. Molecular and Cellular Biology. 2004;24:14–24. doi: 10.1128/MCB.24.1.14-24.2004. [DOI] [PMC free article] [PubMed] [Google Scholar]
- Margolis RN, Evans RM, O'Malley BW. The Nuclear Receptor Signaling Atlas: development of a functional atlas of nuclear receptors. Molecular Endocrinology. 2005;19:2433–2436. doi: 10.1210/me.2004-0461. [DOI] [PubMed] [Google Scholar]
- Nissen RM, Yamamoto KR. The glucocorticoid receptor inhibits NFkappaB by interfering with serine-2 phosphorylation of the RNA polymerase II carboxy-terminal domain. Genes and Development. 2000;14:2314–2329. doi: 10.1101/gad.827900. [DOI] [PMC free article] [PubMed] [Google Scholar]
- O'Malley BW. Results of a search for the mechanisms of steroid receptor regulation of gene expression. Annals of the New York Academy of Sciences. 2004;1038:80–87. doi: 10.1196/annals.1315.014. [DOI] [PubMed] [Google Scholar]
- Perlmann T, Evans RM. Nuclear receptors in Sicily: all in the famiglia. Cell. 1997;90:391–397. doi: 10.1016/s0092-8674(00)80498-5. [DOI] [PubMed] [Google Scholar]
- Pettengill OS, Sorenson GD, Wurster-Hill DH, Curphey TJ, Noll WW, Cate CC, Maurer LH. Isolation and growth characteristics of continuous cell lines from small-cell carcinoma of the lung. Cancer. 1980;45:906–918. doi: 10.1002/1097-0142(19800301)45:5<906::aid-cncr2820450513>3.0.co;2-h. [DOI] [PubMed] [Google Scholar]
- Ray DW, Littlewood AC, Clark AJ, Davis JR, White A. Human small cell lung cancer cell lines expressing the proopiomelanocortin gene have aberrant glucocorticoid receptor function. Journal of Clinical Investigation. 1994;93:1625–1630. doi: 10.1172/JCI117143. [DOI] [PMC free article] [PubMed] [Google Scholar]
- Ray DW, Davis JR, White A, Clark AJ. Glucocorticoid receptor structure and function in glucocorticoid-resistant small cell lung carcinoma cells. Cancer Research. 1996a;56:3276–3280. [PubMed] [Google Scholar]
- Ray DW, Ren SG, Melmed S. Leukemia inhibitory factor (LIF) stimulates proopiomelanocortin (POMC) expression in a corticotroph cell line. Role of STAT pathway. Journal of Clinical Investigation. 1996b;97:1852–1859. doi: 10.1172/JCI118615. [DOI] [PMC free article] [PubMed] [Google Scholar]
- Ray DW, Suen CS, Brass A, Soden J, White A. Structure/function of the human glucocorticoid receptor: tyrosine 735 is important for transactivation. Molecular Endocrinology. 1999;13:1855–1863. doi: 10.1210/mend.13.11.0376. [DOI] [PubMed] [Google Scholar]
- Smyth GK. Linear models and empirical bayes methods for assessing differential expression in microarray experiments. Statistical Applications in Genetics and Molecular Biology. 2004;3:Article3. doi: 10.2202/1544-6115.1027. [DOI] [PubMed] [Google Scholar]
- Sommer P, Le Rouzic P, Gillingham H, Berry A, Kayahara M, Huynh T, White A, Ray DW. Glucocorticoid receptor overexpression exerts an antisurvival effect on human small cell lung cancer cells. Oncogene. 2007;26:7111–7121. doi: 10.1038/sj.onc.1210524. [DOI] [PubMed] [Google Scholar]
- Stevens A, Garside H, Berry A, Waters C, White A, Ray D. Dissociation of steroid receptor coactivator 1 and nuclear receptor corepressor recruitment to the human glucocorticoid receptor by modification of the ligand-receptor interface: the role of tyrosine 735. Molecular Endocrinology. 2003;17:845–859. doi: 10.1210/me.2002-0320. [DOI] [PubMed] [Google Scholar]
- Storey JD, Taylor JE, Siegmund D. Strong control, conservative point estimation, and simultaneous conservative consistency of false discovery rates: a unified approach. Journal of the Royal Statistical Society. Series B. 2004;66:187–205. [Google Scholar]
- Weinberger C, Hollenberg SM, Ong ES, Harmon JM, Brower ST, Cidlowski J, Thompson EB, Rosenfeld MG, Evans RM. Identification of human glucocorticoid receptor complementary DNA clones by epitope selection. Science. 1985;228:740–742. doi: 10.1126/science.2581314. [DOI] [PubMed] [Google Scholar]
- Weinberger C, Giguere V, Hollenberg SM, Thompson C, Arriza J, Evans RM. Human steroid receptors and erb-A gene products form a superfamily of enhancer-binding proteins. Clinical Physiology and Biochemistry. 1987;5:179–189. [PubMed] [Google Scholar]
- Witschi H, Espiritu I, Ly M, Uyeminami D. The chemopreventive effects of orally administered dexamethasone in Strain A/J mice following cessation of smoke exposure. Inhalation Toxicology. 2005;17:119–122. doi: 10.1080/08958370590899712. [DOI] [PubMed] [Google Scholar]
- Wu HY, Hamamori Y, Xu J, Chang SC, Saluna T, Chang MF, O'Malley BW, Kedes L. Nuclear hormone receptor coregulator GRIP1 suppresses, whereas SRC1A and p/CIP coactivate, by domain-specific binding of MyoD. Journal of Biological Chemistry. 2005;280:3129–3137. doi: 10.1074/jbc.M412560200. [DOI] [PubMed] [Google Scholar]
- Zhu Y, Singh B, Hewitt S, Liu A, Gomez B, Wang A, Clarke R. Expression patterns among interferon regulatory factor-1, human X-box binding protein-1, nuclear factor kappa B, nucleophosmin, estrogen receptor-alpha and progesterone receptor proteins in breast cancer tissue microarrays. International Journal of Oncology. 2006;28:67–76. [PubMed] [Google Scholar]


